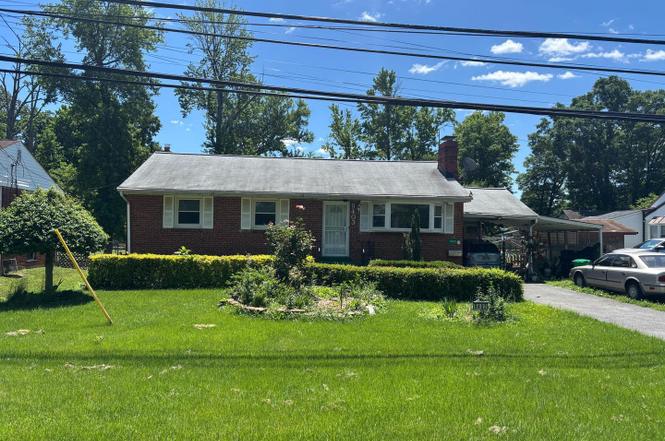
9403 Good Luck Rd · Seabrook, MD
Flood risk 1/10 · Minimal
- FEMA flood zone
- X (unshaded)
- Chance of flooding over 30 yrs
- 0.0%
- Est. flood insurance / yr
- $473 – $860
Fire risk 2/10 · Minimal
- Est. fire insurance / yr
- $755 – $1,403
Heat risk 7/10 · Major
- Hot days now (above 104°F)
- 7 days/yr
- Hot days in 30 yrs
- 15 days/yr
Wind risk 4/10 · Minor
- Chance of severe wind over 30 yrs
- 21.0%
Air-quality risk 5/10 · Moderate
- Unhealthy air days now
- 6 days/yr
- Unhealthy air days in 30 yrs
- 7 days/yr
Risk factors via First Street. Map © Google.
Why this score? — see what drove the C grade
The composite is a weighted blend of 9 inputs, each scored 0–100. Each bar is that input's sub-score; the figure is the points it added to the 100-point composite (weight × sub-score).
- Cash flow +25.4/30.0
- DSCR +8.4/10.0
- 1% rule +7.5/10.0
- ARV discount +7.5/15.0
- Livability +3.5/5.0
- Condition / age +2.5/5.0
- Rent growth +2.0/5.0
- Schools +1.7/10.0
- Appreciation +0.0/10.0
$190,000
🖨 Deal sheet 📄 Offer letter ✓ Due diligence
Listing remarks
ONLINE AUCTION: This auction takes place on the Ashland Auction Group Website Bidding Platform. Bidding begins06/15/2026 @ 10:00 AM. Bidding ends 06/17/2026 @ 11:10 AM. List Price is Suggested Opening Bid. Deposit: $30,000. 1 Story Detached home located in Lanham, Maryland within Prince George's County. The property features a driveway and a carport. Residents can enjoy the nearby attractions such as Glenn Dale Park, Luminis Health Doctors Community Center, Vista Gardens Marketplace, & +/- 15 miles to Downtown Washington DC. Easy Access to Major Traffic Artery 495 Beltway. Occupancy status is unknown.
Key facts
- Driveway
- Carport
- Nearby attractions
Tags
Property features AI
Finance
- Other: Assessor used as source for living area and year built; 920 sq ft finished above grade and 920 sq ft below grade (unfinished)
- Financial info: Ownership is fee simple
Exterior
- Utilities: Natural gas hot water; Natural gas heating fuel; Public sewer; Other water source
- Home design: Brick construction
- Construction: Brick construction; Other foundation
- Exterior features: Detached structure; Above-grade and below-grade other structures; No tidal water
Interior
- Bedrooms: Three bedrooms on the main level
- Bathrooms: Two full bathrooms (both on the main level)
- Heating & cooling: Forced air heating; Electric cooling
- Interior features: Two fireplaces
Neighborhood map
What this means for you Summary
Snapshot
- This is a 3-bed/2.0-bath single-family listed at $190k.
Deal economics
- At list price, monthly cash flow is $437 ($5k/yr) — positive.
- The deal already cash-flows at list — no discount required.
- Meets the 1% rule at list price ($2k rent vs $190k).
- Cap rate 9.1% vs local median 4.6% in Seabrook — top-decile yield for the area; either an underpriced asset or a hidden risk that comps aren't pricing in. Stress-test before assuming the spread holds.
Location & tenants
- Location reads 70/100 on livability (#162 in MD) — a middle-class / working-renter tenant base. Strengths: employment A+, housing A+, commute B; Watch: health & safety C-, crime D-, amenities F.
- Prince George'S County Public Schools (suburban): math 8% / reading 24% proficiency, ranked #21 of 24 in MD (top 88%) — low school quality limits family demand, transient renter base, plan for 1-2y turnover.
- Market conditions: Rents soft (-1.9%/yr); 124 active listings in the ZIP; 5 comparable units currently listed for rent nearby; rentals leasing fast (median 10d on market — plan ~1-2 weeks tenant-placement turnaround); 40% of comp listings sitting > 30 days — soft ceiling on asking rent; solid renter incomes; 1,481 units permitted in Prince George's County in 2024 (0 in 5+ unit buildings).
Forward outlook
- Local home prices are declining (-3.0%/yr); year-one equity from $1k of loan paydown is wiped out by about $6k of value loss. Plan a longer hold.
- Prince George's County population projected at +18% by 2050 — long-run rental-demand tailwind backs the buy-and-hold thesis.
Negotiation context
- Only 8 days on market — expect competitive offers; lowballing is unlikely to land.
- Current owner paid $129k; 47% above their basis — modest negotiation headroom, anchor on the comps not their cost.
Risks & watch-outs
- Watch-outs: built in 1959 — expect roof / HVAC / electrical / plumbing capex.
- Climate carrying-cost: extreme-heat days projected 7→15/yr by 2055 (HVAC capex compounding) — expect insurance premiums to compound above CPI over the hold.
Questions for the listing agent
- Built in 1959 — when were the roof, HVAC, electrical panel, plumbing, and water heater last replaced?
- Is there a deadline driving the sale (1031 exchange, divorce, estate, relocation)? That informs how much negotiation room exists.
- Crime grade is D in this area — have there been break-ins, vandalism, or insurance claims at this property in the last 3 years? What carrier currently insures it and at what premium?
- What's the average days-on-market for RENTAL listings here right now (not sales)? A rising rental-DOM trend means longer vacancies and softer asking-rent achievability than the comps imply.
- What's the recent tenant-quality profile in this submarket — average credit score on applications, eviction rate, late-payment / NSF rate, and stable-employment percentage? A property-management company in the area should have these aggregated.
- How much new for-sale + rental construction is in the pipeline within 1–3 miles? Heavy new supply typically softens prices + rents 12–24 months out; constrained supply supports both.
Investment metrics
- 1% rule
- 1.25% ✓
- Cap rate
- 9.05%
- Cash-on-cash
- 9.86%
- DSCR
- 1.44
- GRM
- 6.7
CMA / ARV
- ARV (on-the-fly)
- $435,160
- Comps found
- 2
Show comp detail 2 sales within ~0.75 mi
| Address | Dist | Beds/Ba | Sqft | Sold | Price | $/sf | Match |
|---|---|---|---|---|---|---|---|
| 9904 Lanham Severn Rd | 0.57mi | 3/2.0 | 988 (+7%) | 0mo | $360,000 | $364 | 61 |
| 9705 Locust Ave | 0.74mi | 4/2.0 (+1) | 972 (+6%) | 0mo | $459,900 | $473 | 51 |
Match score weights: distance 35% · size 25% · config 20% · recency 20%. Top-matched comps best support the ARV.
Projected returns pro-forma
-3.0% appreciation · 0.0% rent growth · sell at horizon
- IRR
- -5.1%
- Equity multiple
- 0.82×
- Total profit
- $-9,789
- Equity at exit
- $28,330
- IRR
- 0.3%
- Equity multiple
- 1.02×
- Total profit
- $908
- Equity at exit
- $16,428
Cash invested: $53,200 (down + closing). Projections, not guarantees.
Landlord ↔ Tenant lean methodology
- Overall (STATE)
- 27 Tenant-Leaning
- State Maryland
- 27 Tenant-Leaning · D+14
- County
- — inherits STATE
- City
- — inherits STATE
ZIP-level market 20706
- Rents YoY
- -1.9%
- Active inventory
- 124
- Price-to-rent
- 6.7×
Monthly cashflow live
- Estimated rent
- $2,373 high interval (Pro) →
- Mortgage (P&I)
- −$996
- Tax from tax record
- −$362 /mo · $4,341/yr
- Insurance
- −$79
- HOA
- −$0
- Vacancy / Maint / Mgmt
- −$498
- Net cashflow
- $437
Break-even live
UW: 25.0% down · 7.5% · 30yr · 1.5% tax · 5.0% vac · 8.0% maint · 8.0% mgmt
Financing live
Cash to close
- Down payment
- $47,500
- Closing costs
- $5,700
- Reserves months
- —
- Total cash needed
- —
Loan-product check · same deal, 3 products live
Conventional
25% down · 7.5% · 30yr
- Down + closing
- —
- Monthly P&I
- —
- Monthly cashflow
- —
- DSCR
- —
- Eligible?
- —
Personal DTI + credit; lowest rate.
DSCR
20% down · 8.5% · 30yr
- Down + closing
- —
- Monthly P&I
- —
- Monthly cashflow
- —
- DSCR
- —
- Eligible?
- —
No personal income docs; deal must DSCR.
Hard money
10% down · 12.0% · 12mo
- Down + closing
- —
- Monthly P&I
- —
- Monthly cashflow
- —
- DSCR
- —
- Eligible?
- —
Short-term bridge; refi at stabilization.
Rent comps 5 comps
| Address | Beds | Baths | Sqft | Rent | $/sqft | DOM | Units | Dist |
|---|---|---|---|---|---|---|---|---|
| 8671 Greenbelt Rd #101 Greenbelt, MD | 3.0 | 1.0 | 1072 | $2,099 | $1.96 | 43d | 1 | 0.83mi |
| 8501 Greenbelt Rd Greenbelt, MD | 1.0–3.0 | 1.0–2.0 | 933 | $2,364 | $2.53 | 43d | 1 | 0.86mi |
| 10023 Greenbelt Rd Lanham, MD | 1.0–3.0 | 1.0–2.0 | 983 | $2,412 | $2.45 | 1d | 16 | 1.02mi |
| 9971 Good Luck Rd Lanham, MD | 1.0–3.0 | 1.0–2.0 | 1155 | $2,397 | $2.08 | 1d | 27 | 1.03mi |
| 5618 Whitfield Chapel Rd Lanham, MD | 1.0–2.0 | 1.0 | 743 | $1,922 | $2.59 | 10d | 1 | 1.41mi |
Listing history 6 events
-
2026-06-18days on market $190,000 Active 8 DOM
-
2026-06-17days on market $190,000 Active 7 DOM
-
2026-06-16days on market $190,000 Active 6 DOM
-
2026-06-15days on market $190,000 Active 5 DOM
-
2026-06-13remarks 609-char remark
-
2026-06-13$190,000 Active 3 DOM
ⓘ Source: listings_history table (triggers on properties + properties_extension) + one-shot
backfill from property_details.listing_events for pre-trigger history.
Tax reassessment forecast MD · Partial reset (capped growth)
- Current annual tax
- $4,341 · $362/mo
- Projected year-2 tax
- $4,341 · $362/mo
- Expected delta
- $0/yr ($0/mo · 0.0%)
ⓘ Screening estimate from a state-policy table — verify with the county assessor before closing.
Climate risk First Street
- Flood 1/10 Low FEMA zone X (unshaded) · 0% chance over 30 yrs
- Wildfire 2/10 Low
- Heat 7/10 Severe 7 d/yr ≥104°F today · 15 d/yr by 30 yrs out
- Wind 4/10 Moderate 21% chance of damaging wind over 30 yrs
- Air quality 5/10 Major 6 unhealthy d/yr today · 7 by 30 yrs out
Nearby sold comps map
Loading sold comps map…
Walkable amenities ~0.75 mi
Loading nearby amenities…
Taxation est. · year 1
- Rental income
- $28,473
- − Mortgage interest
- −$10,643
- − Property taxes
- −$4,341
- − Insurance
- −$950
- − Repairs & maintenance
- −$2,278
- − Management
- −$2,278
- − Depreciation
- −$5,527
- Taxable income
- $2,455
- Est. tax owed @ 24.0%
- −$589
- After-tax cash flow
- $4,656/yr
For passive investors: Depreciation is non-cash, so a rental often shows a tax loss while cash-flowing — sheltering income. Rental losses are passive: they offset passive income freely, and up to $25,000/yr can offset ordinary (W-2) income if you actively participate and your MAGI is under $100k (phasing out to $0 by $150k); unused losses carry forward. On sale, claimed depreciation is recaptured at up to 25%, and gains may owe capital-gains tax (a 1031 exchange can defer both). Figures are a year-1 estimate at your 24.0% rate — not tax advice; consult a CPA.
Schools (NCES district)
- District
- Prince George'S County Public Schools
- NCES district ID
- 2400510
- Math proficiency
- 8% ▼ -11.00%
- Reading proficiency
- 24% ▼ -9.00%
- Median HH income
- $73,967
- Composite
- 16.82/100
- National rank
- #9151
- State rank
- #21 of 24 in MD
Livability — Seabrook
- Score
- 70/100
- State rank
- #162
- US rank
- #7350
Category grades
Schools grade is shown separately in the Schools card above.
Census & demographics
- Census place
- Seabrook, MD
- County
- Prince Georges County · 919,866 people
- Metro
- Washington-Arlington-Alexandria, DC-VA-MD-WV
- Population (ZIP)
- 42,612
- Household income
- $104,523
- Rent vs Own
- Severe rent burden
- 641.0
Population outlook (Prince George's County) Hauer SSP2
- Today (2025)
- 1,005,426 people
- By 2030
- 1,048,416 · +4.3%
- By 2040
- 1,123,425 · +11.7%
- By 2050
- 1,183,220 · +17.7%
- By 2075
- 1,306,202 · +29.9%
- By 2100
- 1,408,179 · +40.1%
Race, ethnicity, and origin ACS 2023
- Neighborhood character
- Diverse neighborhood (Simpson 0.58)
- Race & ethnicity
- Black 59% Hispanic / Latino 26% Two or more races 10% White 7% Asian 5%
- Hispanic origin (detail)
- Mexican 9% Dominican 2%
- Common ancestry
- Hispanic 1% Swiss 1%
- Foreign-born
- 37% · Canada, United Kingdom, Vietnam
- Languages at home
- 60% English-only · Spanish 23% French/Haitian/Cajun 4% Other Indo-European 3%
Political lean MEDSL · Prince George's
- 2024 margin
- Solid D (+75.2) · D 86.3% · R 11.2% · Other 2.5%
- 2008→2024 swing
- -3.3pp toward R · 2008: 78.5pp · 2024: 75.2pp
- All cycles
- 2024: D+75.2 2020: D+80.5 2016: D+81.0 2012: D+80.9 2008: D+78.5
Not yet ingested
- Civics
- —
Market trends
- HPI YoY
- ▼ -279.37%
- Current HPI
- 284.8481
- Rent YoY
- ▼ -1.85%
- Metro
- Washington-Arlington-Alexandria, DC-VA-MD-WV
- State GDP YoY
- ▲ 2.97%
- F500 in state
- 12
Industry mix (Fortune 500 HQ in MD)
| Industry | F500 HQs | Revenue |
|---|---|---|
| Aerospace / Defense | 1 | $71B |
|
||
| Utilities | 1 | $25B |
|
||
| Hotels | 1 | $24B |
|
||
| Consumer Goods | 1 | $7B |
|
||
| Real Estate | 1 | $6B |
|
||
| Chemicals | 1 | $2B |
|
||
Price history
+47.3% since first listed2 events — show timeline
- 2026-06-10 Listed $190,000 BRIGHT MLS
- 1992-04-14 Sold (Public Records) $129,000 Public Records
Property tax history
+6.1%/yrLatest (2025): $4,341 · +4.5% YoY. Source: county tax records.
Cash-flow waterfall
monthlySold comps — $/sqft
last 12 mo · ≤1 miLoading sold comps…