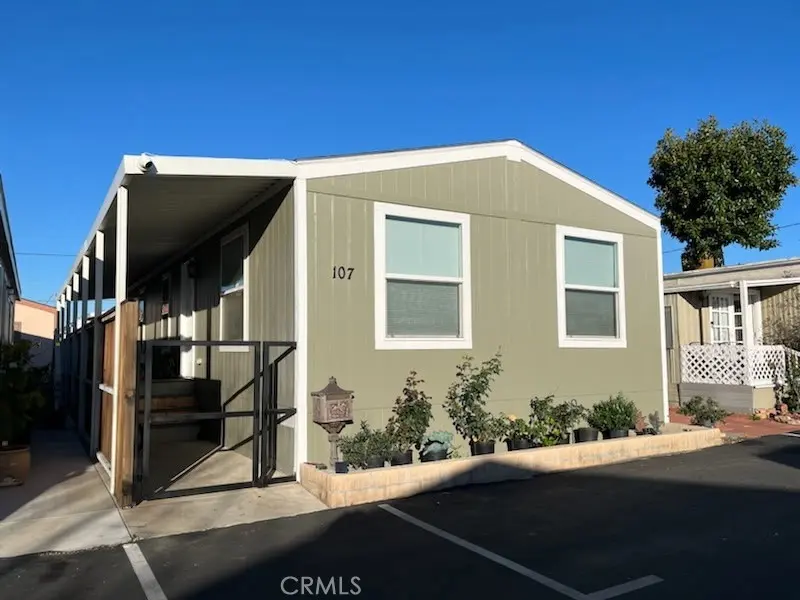
7560 Woodman Pl #107 · Los Angeles, CA
Flood risk 1/10 · Minimal
- FEMA flood zone
- X (unshaded)
- Chance of flooding over 30 yrs
- 0.0%
- Est. flood insurance / yr
- $507 – $1,088
Fire risk 1/10 · Minimal
- Est. fire insurance / yr
- $659 – $1,223
Heat risk 6/10 · Moderate
- Hot days now (above 97°F)
- 7 days/yr
- Hot days in 30 yrs
- 21 days/yr
Wind risk 1/10 · Minimal
- Chance of severe wind over 30 yrs
- —
Air-quality risk 5/10 · Moderate
- Unhealthy air days now
- 7 days/yr
- Unhealthy air days in 30 yrs
- 9 days/yr
Risk factors via First Street. Map © Google.
Why this score? — see what drove the C grade
The composite is a weighted blend of 9 inputs, each scored 0–100. Each bar is that input's sub-score; the figure is the points it added to the 100-point composite (weight × sub-score).
- Cash flow +28.6/30.0
- DSCR +10.0/10.0
- 1% rule +7.2/10.0
- Condition / age +4.0/5.0
- Schools +3.6/10.0
- Livability +3.4/5.0
- Rent growth +2.2/5.0
- ARV discount +0.0/15.0
- Appreciation +0.0/10.0
$245,000
🖨 Deal sheet (PDF) 📄 Offer letter ✓ Due diligence
Listing remarks MLS
THIS BEAUTIFUL 3-BEDROOM, 2-BATH BUILT IN 2022 IS A RARE FIND IN THE PARK. YOU ' LL WALK INTO THE INVITING KITCHEN FEATURING A KITCHEN ISLAND AND TOTALLY PICTURE YOURSELF LIVING HERE. ONE OF THE LARGER DOUBLE WIDE HOMES AVAILABLE. THIS HOME IS IN MOVE-IN CONDITION. HAS CENTRAL AIR CONDITIONING, LAUNDRY, AND MORE, CLOSE TO SHOPPING, GREAT RESTAURANTS, AND PUBLIC TRANSPORTATION. SUBJECT TO PARK MANAGEMENT APPROVAL.
Key facts
- Move-in condition
- Kitchen island
- Close to shopping
Tags
Neighborhood map
What this means for you Summary
Snapshot
- This is a 3-bed/2.0-bath manufactured listed at $245k. Condition is rated good.
Deal economics
- At list price, monthly cash flow is $809 ($10k/yr) — positive.
- The deal already cash-flows at list — no discount required.
- Meets the 1% rule at list price ($3k rent vs $245k).
- Recommended offer: $230k (6.0% below list) — sets the bar for market timing.
- Cap rate 10.3% vs local median 2.1% in Los Angeles — top-decile yield for the area; either an underpriced asset or a hidden risk that comps aren't pricing in. Stress-test before assuming the spread holds.
Location & tenants
- Location reads 68/100 on livability (#273 in CA) — a middle-class / working-renter tenant base. Strengths: amenities A+, commute A+, employment B; Watch: health & safety C-, crime F, cost of living F.
- Los Angeles Unified (urban): math 29% / reading 54% proficiency, ranked #223 of 517 in CA (top 43%) — families likely to look elsewhere, expect single-tenant / working-renter base with shorter leases; 67% free/reduced lunch — lower-income household profile, screen leases tightly.
- Zoned schools: Ranchito Avenue Elementary (417 students, 91% FRL); James Madison Middle (1,284 students, 93% FRL); Van Nuys Senior High (math 40% / reading 56%, grade D, #380 of 1,170 statewide, top 33%, 2,323 students, 84% FRL) — zoned schools average 89% FRL vs 67% district-wide (22 pts higher); higher-poverty schools than district average — tighter screening recommended.
- Market conditions: Rents soft (-1.3%/yr); 75 active listings in the ZIP; 40 comparable units currently listed for rent nearby; rentals at typical pace (median 27d on market — plan ~3-4 weeks tenant-placement turnaround); 19,697 units permitted in Los Angeles County in 2024 (9,426 in 5+ unit buildings).
- At $2,983/mo this rent would consume 57% of the median local household income ($63k/yr) (locally 4944% of renters already pay >50% of income on rent) — very limited rent-growth headroom before tenants either downsize or default.
Forward outlook
- Local home prices are declining (-3.0%/yr); year-one equity from $2k of loan paydown is wiped out by about $7k of value loss. Plan a longer hold.
- Los Angeles County population projected at +9% by 2050 — modest demand growth; plan on rents tracking national, not racing it.
Negotiation context
- It's been on market 83 days — a 6% lower offer ($230k) is reasonable based on typical stale-listing flexibility.
- 2 sale attempts; this cycle's ask has dropped $15k (6%) from the opening price — seller is motivated, your offer sets the floor, not the list.
Risks & watch-outs
- Climate carrying-cost: extreme-heat days projected 7→21/yr by 2055 (HVAC capex compounding) — expect insurance premiums to compound above CPI over the hold.
Questions for the listing agent
- It's been on market 83 days. Have you received any prior offers? Is the seller open to a 6% concession, seller financing, or rate buy-down credit?
- Why hasn't it sold? Are there any deal-killer items the seller is aware of (foundation, flood, title, zoning, code violations)?
- Is there a deadline driving the sale (1031 exchange, divorce, estate, relocation)? That informs how much negotiation room exists.
- Schools are D-rated, which usually means shorter tenancies and higher turnover. Who's the typical renter profile here, and what's been the actual vacancy rate?
- Crime grade is F in this area — have there been break-ins, vandalism, or insurance claims at this property in the last 3 years? What carrier currently insures it and at what premium?
- What's the average days-on-market for RENTAL listings here right now (not sales)? A rising rental-DOM trend means longer vacancies and softer asking-rent achievability than the comps imply.
- What's the recent tenant-quality profile in this submarket — average credit score on applications, eviction rate, late-payment / NSF rate, and stable-employment percentage? A property-management company in the area should have these aggregated.
- How much new for-sale + rental construction is in the pipeline within 1–3 miles? Heavy new supply typically softens prices + rents 12–24 months out; constrained supply supports both.
Investment metrics
- 1% rule
- 1.22% ✓
- Cap rate
- 10.25%
- Cash-on-cash
- 14.15%
- DSCR
- 1.63
- GRM
- 6.8
CMA / ARV
- ARV (median comp)
- $175,970
- List price
- $245,000
- Delta
- 39.23%
- Verdict
- OVERPRICED
- Comps
- 2 within 1.0 mi
Show comp detail 3 sales within ~0.75 mi
| Address | Dist | Beds/Ba | Sqft | Sold | Price | $/sf | Match |
|---|---|---|---|---|---|---|---|
| 7560 Woodman Pl #4 | 0.00mi | 3/2.0 | 1,056 (+2%) | 8mo | $200,000 | $189 | 91 |
| 7560 Woodman Pl #9 | 0.03mi | 3/2.0 | 1,056 (+2%) | 13mo | $230,000 | $218 | 85 |
| 7560 Woodman Pl #26 | 0.00mi | 3/2.0 | 1,056 (+2%) | 20mo | $210,000 | $199 | 81 |
Match score weights: distance 35% · size 25% · config 20% · recency 20%. Top-matched comps best support the ARV.
Projected returns pro-forma
-3.0% appreciation · 0.0% rent growth · sell at horizon
- IRR
- 1.2%
- Equity multiple
- 1.04×
- Total profit
- $3,018
- Equity at exit
- $36,530
- IRR
- 7.7%
- Equity multiple
- 1.51×
- Total profit
- $34,982
- Equity at exit
- $21,183
Cash invested: $68,600 (down + closing). Projections, not guarantees.
Landlord ↔ Tenant lean methodology
- Overall (CITY)
- 0 Strongly Tenant-Friendly
- State California
- 18 Strongly Tenant-Friendly · D+13
- County
- — inherits STATE
- City Los Angeles
- 0 Strongly Tenant-Friendly · D+22
ZIP-level market 91405
- Rents YoY
- -1.3%
- Active inventory
- 75
- Price-to-rent
- 6.8×
Monthly cashflow live
- Estimated rent
- $2,983 high interval (Pro) →
- Mortgage (P&I)
- −$1,285
- Tax from tax record
- −$161 /mo · $1,935/yr
- Insurance
- −$102
- HOA
- −$0
- Vacancy / Maint / Mgmt
- −$627
- Net cashflow
- $809
Break-even live
Sensitivity live
| Price | -10% $947 | -5% $878 | +0% $809 | +5% $739 | +10% $670 |
|---|---|---|---|---|---|
| Rent | -10% $573 | -5% $691 | +0% $809 | +5% $927 | +10% $1,044 |
| Rate | -1.0pp $932 | -0.5pp $871 | base $809 | +0.5pp $745 | +1.0pp $681 |
UW: 25.0% down · 7.5% · 30yr · 1.5% tax · 5.0% vac · 8.0% maint · 8.0% mgmt
Financing live
Cash to close
- Down payment
- $61,250
- Closing costs
- $7,350
- Reserves months
- —
- Total cash needed
- —
Loan-product check · same deal, 3 products live
Conventional
25% down · 7.5% · 30yr
- Down + closing
- —
- Monthly P&I
- —
- Monthly cashflow
- —
- DSCR
- —
- Eligible?
- —
Personal DTI + credit; lowest rate.
DSCR
20% down · 8.5% · 30yr
- Down + closing
- —
- Monthly P&I
- —
- Monthly cashflow
- —
- DSCR
- —
- Eligible?
- —
No personal income docs; deal must DSCR.
Hard money
10% down · 12.0% · 12mo
- Down + closing
- —
- Monthly P&I
- —
- Monthly cashflow
- —
- DSCR
- —
- Eligible?
- —
Short-term bridge; refi at stabilization.
Rent comps 40 comps
| Address | Beds | Baths | Sqft | Rent | $/sqft | DOM | Units | Dist |
|---|---|---|---|---|---|---|---|---|
| 7354 Woodman Ave Van Nuys, CA | 2.0–3.0 | 2.0 | 950 | $3,295 | $3.47 | 9d | 6 | 0.14mi |
| 7409 Woodman Ave #107 Van Nuys, CA | 2.0 | 2.0 | 1123 | $2,800 | $2.49 | 9d | 1 | 0.16mi |
| 13531 Wyandotte St Unit 9 Van Nuys, CA | 3.0 | 1.5 | 1075 | $2,785 | $2.59 | 45d | 1 | 0.21mi |
| 13816 Cohasset St Van Nuys, CA | 3.0 | 2.0 | 1180 | $3,500 | $2.97 | 1d | 1 | 0.29mi |
| 13859 Valerio St Van Nuys, CA | 2.0 | 2.5 | 1146 | $3,300 | $2.88 | 45d | 1 | 0.38mi |
| 7236 Ranchito Ave Van Nuys, CA | 3.0 | 2.0 | 1246 | $3,900 | $3.13 | 45d | 1 | 0.44mi |
| 7833 Ventura Canyon Ave Panorama City, CA | 1.0–2.0 | 1.0–2.0 | 825 | $2,675 | $3.24 | 22d | 1 | 0.48mi |
| 13903 Sherman Way #14 Van Nuys, CA | 2.0 | 1.0 | 913 | $2,300 | $2.52 | 45d | 1 | 0.50mi |
| 7061 Woodman Ave Van Nuys, CA | 2.0 | 2.0 | 906 | $2,774 | $3.06 | 45d | 1 | 0.50mi |
| 13941 Sherman Way #205 Van Nuys, CA | 2.0 | 2.0 | 1110 | $2,800 | $2.52 | 45d | 1 | 0.55mi |
| 13941 Sherman Way Van Nuys, CA | 2.0 | 2.0 | 1100 | $2,772 | $2.52 | 19d | 2 | 0.56mi |
| 7900 Woodman Ave #105 Panorama City, CA | 2.0 | 3.0 | 987 | $2,790 | $2.83 | 7d | 1 | 0.56mi |
| 7150 Costello Ave Unit 3 Van Nuys, CA | 2.0 | 1.5 | 1300 | $2,395 | $1.84 | 45d | 1 | 0.60mi |
| 13205 Barbara Ann St North Hollywood, CA | 2.0 | 2.0 | 900 | $2,127 | $2.36 | 45d | 1 | 0.61mi |
| 7033 Fulton Ave Unit 03 North Hollywood, CA | 2.0 | 1.0 | 900 | $2,395 | $2.66 | 26d | 1 | 0.62mi |
| 7441 Hazeltine Ave Van Nuys, CA | 3.0 | 2.0 | 1200 | $2,390 | $1.99 | 45d | 1 | 0.65mi |
| 7319 Hazeltine Ave #14 Van Nuys, CA | 2.0 | 2.5 | 1100 | $2,950 | $2.68 | 19d | 1 | 0.67mi |
| 7256 N Cherry Ln Van Nuys, CA | 3.0 | 3.0 | 1498 | $3,500 | $2.34 | 45d | 1 | 0.68mi |
| 14107 W Birch Ln Van Nuys, CA | 3.0 | 3.0 | 1458 | $3,495 | $2.40 | 26d | 1 | 0.70mi |
| 7252 N Cedar Rd Van Nuys, CA | 3.0 | 3.0 | 1478 | $3,500 | $2.37 | 21d | 1 | 0.70mi |
| 7235 N Cedar Rd Van Nuys, CA | 3.0 | 3.0 | 1458 | $3,236 | $2.22 | 1d | 1 | 0.72mi |
| 7221 Cedar Rd #2 Van Nuys, CA | 3.0 | 3.0 | 1492 | $1,650 | $1.11 | 9d | 1 | 0.73mi |
| 13654 Bassett St Van Nuys, CA | 2.0 | 2.0 | 982 | $2,695 | $2.74 | 7d | 1 | 0.73mi |
| 7046 Murietta Ave Van Nuys, CA | 4.0 | 2.0 | 1416 | $4,950 | $3.50 | 45d | 1 | 0.73mi |
| 14121 W Oak Ln Van Nuys, CA | 3.0 | 3.0 | 1478 | $3,450 | $2.33 | 26d | 1 | 0.74mi |
| 6859 Fulton Ave Unit 859-04 North Hollywood, CA | 3.0 | 1.5 | 1200 | $2,695 | $2.25 | 26d | 1 | 0.80mi |
| 13545 Vanowen St Van Nuys, CA | 2.0 | 2.0 | 925 | $1,995 | $2.16 | 26d | 1 | 0.81mi |
| 13429 Vanowen St Apt 404 Van Nuys, CA | 3.0 | 2.0 | 1079 | $2,795 | $2.59 | 45d | 1 | 0.82mi |
| 13429 Vanowen St Unit 206 Van Nuys, CA | 3.0 | 2.0 | 1233 | $2,990 | $2.42 | 45d | 1 | 0.83mi |
| 8039 Cantaloupe Ave Panorama City, CA | 3.0 | 2.0 | 1286 | $3,699 | $2.88 | 5d | 1 | 0.83mi |
| 13610 Vanowen St Unit 203 Van Nuys, CA | 2.0 | 2.0 | 922 | $2,050 | $2.22 | 7d | 1 | 0.85mi |
| 13610 Vanowen St Van Nuys, CA | 2.0 | 2.0 | 922 | $2,050 | $2.22 | 1d | 1 | 0.85mi |
| 14141 Gault St Van Nuys, CA | 3.0 | 2.0 | 1356 | $3,795 | $2.80 | 9d | 1 | 0.85mi |
| 6828 Fulton Ave Apt 6 North Hollywood, CA | 2.0 | 2.0 | 850 | $2,470 | $2.91 | 45d | 1 | 0.86mi |
| 6828 Fulton Ave Unit 4 North Hollywood, CA | 2.0 | 2.0 | 900 | $2,337 | $2.60 | 26d | 1 | 0.86mi |
| 6737 Woodman Ave Van Nuys, CA | 2.0 | 2.0 | 1100 | $2,100 | $1.91 | 6d | 1 | 0.90mi |
| 13243 Vanowen St #3 North Hollywood, CA | 2.0 | 2.5 | 1417 | $3,295 | $2.33 | 0d | 1 | 0.90mi |
| 13243 Vanowen St #3 North Hollywood, CA | 2.0 | 2.5 | 1417 | $3,295 | $2.33 | 26d | 1 | 0.90mi |
| 6922 Hazeltine Ave Apt 2 Van Nuys, CA | 2.0 | 2.0 | 1100 | $2,400 | $2.18 | 26d | 1 | 0.90mi |
| 6741 Nagle Ave Van Nuys, CA | 2.0 | 2.0 | 1000 | $2,500 | $2.50 | 1d | 1 | 0.92mi |
Listing history 12 events
-
2026-06-21days on market $245,000 Active 83 DOM
-
2026-06-18days on market $245,000 Active 80 DOM
-
2026-06-17days on market $245,000 Active 79 DOM
-
2026-06-16days on market $245,000 Active 78 DOM
-
2026-06-15days on market $245,000 Active 77 DOM
-
2026-06-13days on market $245,000 Active 75 DOM
-
2026-06-09days on market $245,000 Active 71 DOM
-
2026-06-08status $245,000 Active 70 DOM
-
2026-04-23price $245,000 416-char remark
Show marketing remark (416 chars)
THIS BEAUTIFUL 3-BEDROOM, 2-BATH BUILT IN 2022 IS A RARE FIND IN THE PARK. YOU ' LL WALK INTO THE INVITING KITCHEN FEATURING A KITCHEN ISLAND AND TOTALLY PICTURE YOURSELF LIVING HERE. ONE OF THE LARGER DOUBLE WIDE HOMES AVAILABLE. THIS HOME IS IN MOVE-IN CONDITION. HAS CENTRAL AIR CONDITIONING, LAUNDRY, AND MORE, CLOSE TO SHOPPING, GREAT RESTAURANTS, AND PUBLIC TRANSPORTATION. SUBJECT TO PARK MANAGEMENT APPROVAL.
-
2026-04-09status Active 416-char remark
Show marketing remark (416 chars)
THIS BEAUTIFUL 3-BEDROOM, 2-BATH BUILT IN 2022 IS A RARE FIND IN THE PARK. YOU ' LL WALK INTO THE INVITING KITCHEN FEATURING A KITCHEN ISLAND AND TOTALLY PICTURE YOURSELF LIVING HERE. ONE OF THE LARGER DOUBLE WIDE HOMES AVAILABLE. THIS HOME IS IN MOVE-IN CONDITION. HAS CENTRAL AIR CONDITIONING, LAUNDRY, AND MORE, CLOSE TO SHOPPING, GREAT RESTAURANTS, AND PUBLIC TRANSPORTATION. SUBJECT TO PARK MANAGEMENT APPROVAL.
-
2026-03-15status Pending Sale 416-char remark
Show marketing remark (416 chars)
THIS BEAUTIFUL 3-BEDROOM, 2-BATH BUILT IN 2022 IS A RARE FIND IN THE PARK. YOU ' LL WALK INTO THE INVITING KITCHEN FEATURING A KITCHEN ISLAND AND TOTALLY PICTURE YOURSELF LIVING HERE. ONE OF THE LARGER DOUBLE WIDE HOMES AVAILABLE. THIS HOME IS IN MOVE-IN CONDITION. HAS CENTRAL AIR CONDITIONING, LAUNDRY, AND MORE, CLOSE TO SHOPPING, GREAT RESTAURANTS, AND PUBLIC TRANSPORTATION. SUBJECT TO PARK MANAGEMENT APPROVAL.
-
2026-02-21$260,000 Active 416-char remark
Show marketing remark (416 chars)
THIS BEAUTIFUL 3-BEDROOM, 2-BATH BUILT IN 2022 IS A RARE FIND IN THE PARK. YOU ' LL WALK INTO THE INVITING KITCHEN FEATURING A KITCHEN ISLAND AND TOTALLY PICTURE YOURSELF LIVING HERE. ONE OF THE LARGER DOUBLE WIDE HOMES AVAILABLE. THIS HOME IS IN MOVE-IN CONDITION. HAS CENTRAL AIR CONDITIONING, LAUNDRY, AND MORE, CLOSE TO SHOPPING, GREAT RESTAURANTS, AND PUBLIC TRANSPORTATION. SUBJECT TO PARK MANAGEMENT APPROVAL.
ⓘ Source: listings_history table (triggers on properties + properties_extension) + one-shot
backfill from property_details.listing_events for pre-trigger history.
Tax reassessment forecast CA · Resets to sale price
- Current annual tax
- $1,935 · $161/mo
- Projected year-2 tax
- $1,935 · $161/mo
- Expected delta
- $0/yr ($0/mo · -0.0%)
ⓘ Screening estimate from a state-policy table — verify with the county assessor before closing.
Climate risk First Street
- Flood 1/10 Low FEMA zone X (unshaded) · 0% chance over 30 yrs
- Wildfire 1/10 Low
- Heat 6/10 Major 7 d/yr ≥97°F today · 21 d/yr by 30 yrs out
- Wind 1/10 Low
- Air quality 5/10 Major 7 unhealthy d/yr today · 9 by 30 yrs out
Nearby sold comps map
Loading sold comps map…
Walkable amenities ~0.75 mi
Loading nearby amenities…
Taxation est. · year 1
- Rental income
- $35,800
- − Mortgage interest
- −$13,724
- − Property taxes
- −$1,935
- − Insurance
- −$1,225
- − Repairs & maintenance
- −$2,864
- − Management
- −$2,864
- − Depreciation
- −$7,127
- Taxable income
- $6,061
- Est. tax owed @ 24.0%
- −$1,455
- After-tax cash flow
- $8,250/yr
For passive investors: Depreciation is non-cash, so a rental often shows a tax loss while cash-flowing — sheltering income. Rental losses are passive: they offset passive income freely, and up to $25,000/yr can offset ordinary (W-2) income if you actively participate and your MAGI is under $100k (phasing out to $0 by $150k); unused losses carry forward. On sale, claimed depreciation is recaptured at up to 25%, and gains may owe capital-gains tax (a 1031 exchange can defer both). Figures are a year-1 estimate at your 24.0% rate — not tax advice; consult a CPA.
Condition & rehab AI · 7 photos
This 3-bedroom, 2-bath home built in 2022 is in excellent condition and move-in ready. It offers a modern kitchen, hardwood floors, and a well-maintained exterior. Potential buyers and renters will appreciate the home's curb appeal and updated features.
Value-add opportunities
- Both Painting the exterior siding — Fresh paint can enhance curb appeal and property value.
- Resale Updating the kitchen backsplash — A modern backsplash can improve the kitchen's aesthetic and resale value.
- Both Upgrading the flooring — New flooring can improve the home's appearance and increase its rental value.
- Both Adding smart home features — Smart home features can increase convenience and appeal to potential buyers/renters.
- Both Upgrading the appliances — Modern appliances can improve the home's functionality and appeal to potential buyers/renters.
Renovation cost estimate screening
Value-add ROI direction
- Both Painting the exterior siding — Fresh paint can enhance curb appeal and property value. ↑
- Resale Updating the kitchen backsplash — A modern backsplash can improve the kitchen's aesthetic and resale value. ↑
- Both Upgrading the flooring — New flooring can improve the home's appearance and increase its rental value. ↑
- Both Adding smart home features — Smart home features can increase convenience and appeal to potential buyers/renters. ↑
- Both Upgrading the appliances — Modern appliances can improve the home's functionality and appeal to potential buyers/renters. ↑
ⓘ Cost ranges are severity-bucket heuristics (US national rule-of-thumb). Get contractor quotes + a written scope before underwriting a rehab budget.
Schools (NCES district)
- District
- Los Angeles Unified
- NCES district ID
- 0622710
- Math proficiency
- 29% ▼ -4.00%
- Reading proficiency
- 54% ▲ 10.00%
- Median HH income
- $50,403
- Composite
- 35.67/100
- National rank
- #4875
- State rank
- #223 of 517 in CA
Livability — Los Angeles
- Score
- 68/100
- State rank
- #273
- US rank
- #9237
Category grades
Schools grade is shown separately in the Schools card above.
Census & demographics
- Census place
- Los Angeles, CA
- County
- Los Angeles County · 9,444,647 people
- City population
- 3,838,149
- Metro
- Los Angeles-Long Beach-Anaheim, CA
- Population (ZIP)
- 56,033
- Household income
- $62,900
- Rent vs Own
- Severe rent burden
- 4944.0
Population outlook (Los Angeles County) Hauer SSP2
- Today (2025)
- 10,940,515 people
- By 2030
- 11,256,481 · +2.9%
- By 2040
- 11,729,929 · +7.2%
- By 2050
- 11,948,407 · +9.2%
- By 2075
- 11,818,114 · +8.0%
- By 2100
- 10,842,928 · -0.9%
Race, ethnicity, and origin ACS 2023
- Neighborhood character
- Diverse neighborhood (Simpson 0.57)
- Race & ethnicity
- Hispanic / Latino 60% White 23% Two or more races 20% Asian 9% Black 4%
- Hispanic origin (detail)
- Mexican 28%
- Common ancestry
- Scotch-Irish 1% Lithuanian 1%
- Foreign-born
- 47% · Canada, South Korea, China
- Languages at home
- 26% English-only · Spanish 55% Other Indo-European 10% Tagalog/Filipino 3%
Political lean MEDSL · Los Angeles
- 2024 margin
- Solid D (+32.9) · D 64.8% · R 31.9% · Other 3.3%
- 2008→2024 swing
- -7.4pp toward R · 2008: 40.4pp · 2024: 32.9pp
- All cycles
- 2024: D+32.9 2020: D+44.2 2016: D+48.0 2012: D+40.0 2008: D+40.4
Not yet ingested
- Civics
- —
Market trends
- HPI YoY
- ▼ -852.77%
- Current HPI
- 545.8158
- Rent YoY
- ▼ -1.26%
- Metro
- Los Angeles-Long Beach-Anaheim, CA
- State GDP YoY
- ▲ 3.21%
- F500 in state
- 116
Industry mix (Fortune 500 HQ in CA)
| Industry | F500 HQs | Revenue |
|---|---|---|
| Technology | 27 | $1,492B |
|
||
| Financial Services | 3 | $174B |
|
||
| Retail | 3 | $44B |
|
||
| Insurance | 3 | $26B |
|
||
| Media / Entertainment | 2 | $115B |
|
||
| Pharmaceuticals / Biotech | 2 | $62B |
|
||
Price history
-5.8% since first listed4 events — show timeline
- 2026-04-23 Price Changed $245,000 CRMLS
- 2026-04-09 Relisted — CRMLS
- 2026-03-15 Pending — CRMLS
- 2026-02-21 Listed $260,000 CRMLS
Property tax history
+1.4%/yrLatest (2025): $1,935 · +1.4% YoY. Source: county tax records.
Cash-flow waterfall
monthlySold comps — $/sqft
last 12 mo · ≤1 miLoading sold comps…