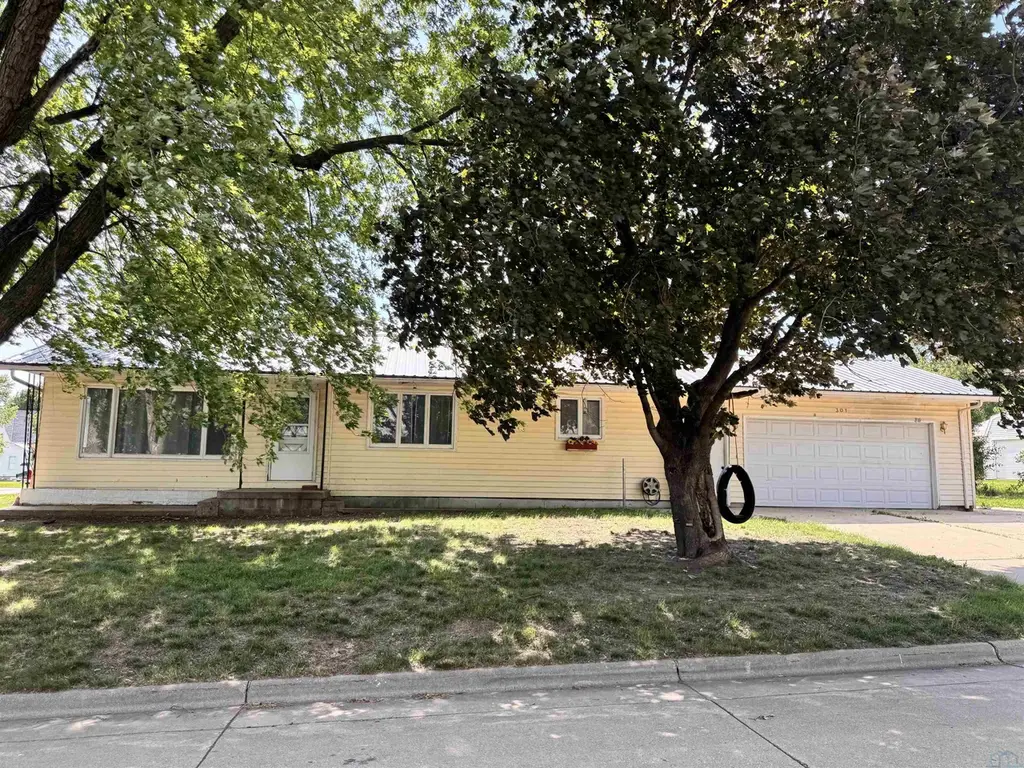
301 Summit St · Sanborn, IA
Flood risk 1/10 · Minimal
- FEMA flood zone
- X (unshaded)
- Chance of flooding over 30 yrs
- 0.0%
- Est. flood insurance / yr
- $473 – $860
Fire risk 1/10 · Minimal
- Est. fire insurance / yr
- $902 – $1,676
Heat risk 3/10 · Minor
- Hot days now (above 100°F)
- 7 days/yr
- Hot days in 30 yrs
- 15 days/yr
Wind risk 2/10 · Minimal
- Chance of severe wind over 30 yrs
- —
Air-quality risk 1/10 · Minimal
- Unhealthy air days now
- 0 days/yr
- Unhealthy air days in 30 yrs
- 0 days/yr
Risk factors via First Street. Map © Google.
Why this score? — see what drove the D+ grade
The composite is a weighted blend of 9 inputs, each scored 0–100. Each bar is that input's sub-score; the figure is the points it added to the 100-point composite (weight × sub-score).
- ARV discount +15.0/15.0
- Cash flow +7.7/30.0
- Appreciation +7.3/10.0
- Schools +6.1/10.0
- Livability +3.8/5.0
- Rent growth +2.5/5.0
- Condition / age +2.5/5.0
- 1% rule +2.2/10.0
- DSCR +1.8/10.0
$129,000
🖨 Deal sheet (PDF) 📄 Offer letter ✓ Due diligence
Listing remarks
Opportunity Knocks in Sanborn! Looking for a project with serious upside? This ranch-style home with an attached 2-car garage in Sanborn is packed with potential and ready for your vision. The heavy lifting has already been started—now it's your chance to finish it exactly the way you want! With flooring and appliances removed, this home offers a blank canvas for investors, flippers, or buyers looking to build instant equity. Bring your ideas, choose your finishes, and create a home that fits your style and budget. Features: Ranch-style layout Attached 2-car garage Excellent opportunity to customize Priced to sell Unlimited potential for the right buyer Geo-Thermal Heat Let your i
Key facts
- Geo-thermal heat
- Ranch-style layout
- 7,100 sq ft lot
Tags
Property features AI
Exterior
- Parking: Attached concrete garage with 2 parking spaces
- Utilities: Public water; Public sewer
- Home design: Single-family residential property
- Construction: Vinyl siding construction; Metal roof; Finished below-grade area
- Exterior features: Metal roof; Vinyl siding; 0.16-acre lot
Interior
- Bathrooms: 1 full bathroom
- Heating & cooling: Geothermal heating; Electric heating; Central air conditioning
- Interior features: Full basement
Neighborhood map
What this means for you Summary
Snapshot
- This is a 2-bed/2.0-bath single-family listed at $129k.
Deal economics
- At list price, monthly cash flow is $-150 ($-2k/yr) — negative.
- To cash-flow at today's rent, offer at most $103k (20.5% below list).
- To meet the 1% rule (rent ≥ 1% of price), the offer needs to be $93k (28.3% below list).
- Recommended offer: $93k (28.3% below list) — sets the bar for 1% rule.
Location & tenants
- Location reads 76/100 on livability (#184 in IA, #3,267 nationally) — a middle-class / working-renter tenant base. Strengths: crime A+, cost of living A+, housing A+; Watch: employment C-, amenities F, commute F.
- Hartley-Melvin-Sanborn Community School District (rural): math 72% / reading 73% proficiency, ranked #111 of 289 in IA (top 38%) — strong family-tenant draw, lease renewals of 3-5y typical.
- Zoned schools: Hartley-Melvin-Sanborn Elementary School (math 74% / reading 74%, grade A, #131 of 616 statewide, top 27%, 270 students, 52% FRL); Hartley-Melvin-Sanborn Middle School (math 72% / reading 72%, grade A, #95 of 246 statewide, top 42%, 174 students, 51% FRL); Hartley-Melvin-Sanborn High School (math 72% / reading 77%, grade B+, #89 of 336 statewide, top 30%, 203 students, 47% FRL).
- Market conditions: 16 active listings in the ZIP; 13 units permitted in O'Brien County in 2024 (0 in 5+ unit buildings).
Forward outlook
- In year one you build about $7k of equity ($892 loan paydown + $6k appreciation (4.5% local appreciation)).
- O'Brien County population projected at -11% by 2050 — secular population decline; favor cash flow + early exit over multi-decade hold.
- By year 6, paydown + projected appreciation supports a ~$36k cash-out refi (75% LTV) — recoverable capital for the next deal without selling this one.
Negotiation context
- Only 7 days on market — expect competitive offers; lowballing is unlikely to land.
- Current owner paid $100k; 29% above their basis — modest negotiation headroom, anchor on the comps not their cost.
Questions for the listing agent
- What do current leases actually rent for vs. the listed asking? Can we see a recent rent roll and the last 12 months of T-12 income?
- Built in 1978 — when were the roof, HVAC, electrical panel, plumbing, and water heater last replaced?
- Is there a deadline driving the sale (1031 exchange, divorce, estate, relocation)? That informs how much negotiation room exists.
- Schools are A-rated — typically a magnet for longer-tenancy family renters. What's the average tenant stay here, and is there a school-zone premium baked into asking?
- The area grade is low — what's the realistic commute time and amenity access for the typical tenant pool here? Any planned neighborhood developments (good or bad) we should know about?
- What's the average days-on-market for RENTAL listings here right now (not sales)? A rising rental-DOM trend means longer vacancies and softer asking-rent achievability than the comps imply.
- What's the recent tenant-quality profile in this submarket — average credit score on applications, eviction rate, late-payment / NSF rate, and stable-employment percentage? A property-management company in the area should have these aggregated.
- How much new for-sale + rental construction is in the pipeline within 1–3 miles? Heavy new supply typically softens prices + rents 12–24 months out; constrained supply supports both.
Investment metrics
- 1% rule
- 0.72% ✗
- Cap rate
- 4.90%
- Cash-on-cash
- -4.98%
- DSCR
- 0.78
- GRM
- 11.6
CMA / ARV
- ARV (on-the-fly)
- $202,630
- Comps found
- 3
Show comp detail 3 sales within ~0.75 mi
| Address | Dist | Beds/Ba | Sqft | Sold | Price | $/sf | Match |
|---|---|---|---|---|---|---|---|
| 512 Petrich Ave | 0.67mi | 3/2.0 (+1) | 1,682 (-4%) | 5mo | $265,000 | $158 | 52 |
| 503 Joyce St | 0.55mi | 3/2.0 (+1) | 1,920 (+9%) | 15mo | $220,000 | $115 | 42 |
| 503 E 7th St | 0.63mi | 3/1.5 (+1) | 1,697 (-4%) | 24mo | $173,000 | $102 | 38 |
Match score weights: distance 35% · size 25% · config 20% · recency 20%. Top-matched comps best support the ARV.
Projected returns pro-forma
4.51% appreciation · 3.0% rent growth · sell at horizon
- IRR
- 7.3%
- Equity multiple
- 1.46×
- Total profit
- $16,633
- Equity at exit
- $69,307
- IRR
- 9.5%
- Equity multiple
- 2.67×
- Total profit
- $60,352
- Equity at exit
- $116,589
Cash invested: $36,120 (down + closing). Projections, not guarantees.
Landlord ↔ Tenant lean methodology
- Overall (STATE)
- 83 Strongly Landlord-Friendly
- State Iowa
- 83 Strongly Landlord-Friendly · R+6
- County
- — inherits STATE
- City
- — inherits STATE
ZIP-level market 51248
- Home prices YoY
- 3.0%
- Active inventory
- 16
- Price-to-rent
- 11.6×
Monthly cashflow live
- Estimated rent
- $925 medium interval (Pro) →
- Mortgage (P&I)
- −$676
- Tax from tax record
- −$150 /mo · $1,804/yr
- Insurance
- −$54
- HOA
- −$0
- Vacancy / Maint / Mgmt
- −$194
- Net cashflow
- $-150
Break-even live
Sensitivity live
| Price | -10% $-77 | -5% $-113 | +0% $-150 | +5% $-186 | +10% $-223 |
|---|---|---|---|---|---|
| Rent | -10% $-223 | -5% $-186 | +0% $-150 | +5% $-113 | +10% $-77 |
| Rate | -1.0pp $-85 | -0.5pp $-117 | base $-150 | +0.5pp $-183 | +1.0pp $-217 |
UW: 25.0% down · 7.5% · 30yr · 1.5% tax · 5.0% vac · 8.0% maint · 8.0% mgmt
Financing live
Cash to close
- Down payment
- $32,250
- Closing costs
- $3,870
- Reserves months
- —
- Total cash needed
- —
Loan-product check · same deal, 3 products live
Conventional
25% down · 7.5% · 30yr
- Down + closing
- —
- Monthly P&I
- —
- Monthly cashflow
- —
- DSCR
- —
- Eligible?
- —
Personal DTI + credit; lowest rate.
DSCR
20% down · 8.5% · 30yr
- Down + closing
- —
- Monthly P&I
- —
- Monthly cashflow
- —
- DSCR
- —
- Eligible?
- —
No personal income docs; deal must DSCR.
Hard money
10% down · 12.0% · 12mo
- Down + closing
- —
- Monthly P&I
- —
- Monthly cashflow
- —
- DSCR
- —
- Eligible?
- —
Short-term bridge; refi at stabilization.
Listing history 8 events
-
2026-06-18status $129,000 Pending 7 DOM
-
2026-06-18days on market $129,000 Active 7 DOM
-
2026-06-17days on market $129,000 Active 6 DOM
-
2026-06-16days on market $129,000 Active 5 DOM
-
2026-06-15days on market $129,000 Active 4 DOM
-
2026-06-13days on market $129,000 Active 2 DOM
-
2026-06-12remarks 693-char remark
-
2026-06-12$129,000 Active 1 DOM
ⓘ Source: listings_history table (triggers on properties + properties_extension) + one-shot
backfill from property_details.listing_events for pre-trigger history.
Tax reassessment forecast IA · Partial reset (capped growth)
- Current annual tax
- $1,804 · $150/mo
- Projected year-2 tax
- $1,915 · $160/mo
- Expected delta
- +$111/yr (+$9/mo · 6.1%)
ⓘ Screening estimate from a state-policy table — verify with the county assessor before closing.
Climate risk First Street
- Flood 1/10 Low FEMA zone X (unshaded) · 0% chance over 30 yrs
- Wildfire 1/10 Low
- Heat 3/10 Moderate 7 d/yr ≥100°F today · 15 d/yr by 30 yrs out
- Wind 2/10 Low
- Air quality 1/10 Low 0 unhealthy d/yr today · 0 by 30 yrs out
Nearby sold comps map
Loading sold comps map…
Walkable amenities ~0.75 mi
Loading nearby amenities…
Taxation est. · year 1
- Rental income
- $11,101
- − Mortgage interest
- −$7,226
- − Property taxes
- −$1,804
- − Insurance
- −$645
- − Repairs & maintenance
- −$888
- − Management
- −$888
- − Depreciation
- −$3,753
- Taxable loss
- −$4,103
- Est. tax savings @ 24.0%
- +$985
- After-tax cash flow
- $-813/yr
For passive investors: Depreciation is non-cash, so a rental often shows a tax loss while cash-flowing — sheltering income. Rental losses are passive: they offset passive income freely, and up to $25,000/yr can offset ordinary (W-2) income if you actively participate and your MAGI is under $100k (phasing out to $0 by $150k); unused losses carry forward. On sale, claimed depreciation is recaptured at up to 25%, and gains may owe capital-gains tax (a 1031 exchange can defer both). Figures are a year-1 estimate at your 24.0% rate — not tax advice; consult a CPA.
Schools (NCES district)
- District
- Hartley-Melvin-Sanborn Community School District
- NCES district ID
- 1913660
- Math proficiency
- 72% ▲ 1.00%
- Reading proficiency
- 73% ▲ 4.00%
- Median HH income
- $46,177
- Composite
- 61.08/100
- National rank
- #790
- State rank
- #111 of 289 in IA
Livability — Sanborn
- Score
- 76/100
- State rank
- #184
- US rank
- #3267
Category grades
Schools grade is shown separately in the Schools card above.
Census & demographics
- Census place
- Sanborn, IA
- Population (ZIP)
- 1,643
Population outlook (O'Brien County) Hauer SSP2
- Today (2025)
- 13,353 people
- By 2030
- 13,040 · -2.3%
- By 2040
- 12,422 · -7.0%
- By 2050
- 11,887 · -11.0%
- By 2075
- 11,132 · -16.6%
- By 2100
- 10,176 · -23.8%
Race, ethnicity, and origin ACS 2023
- Neighborhood character
- Predominantly White (97%)
- Race & ethnicity
- White 97% Black 1%
- Common ancestry
- Iranian 32% Lithuanian 5% Portuguese 1%
- Foreign-born
- 2%
- Languages at home
- 98% English-only · Spanish 1%
Political lean MEDSL · O'Brien
- 2024 margin
- Solid R (+60.9) · D 19.0% · R 80.0% · Other 1.0%
- 2008→2024 swing
- -26.1pp toward R · 2008: -34.9pp · 2024: -60.9pp
- All cycles
- 2024: R+60.9 2020: R+56.8 2016: R+60.2 2012: R+45.2 2008: R+34.9
Not yet ingested
- Civics
- —
Market trends
- HPI YoY
- ▲ 4.51%
- Current HPI
- 156.0434
- Rent YoY
- —
- Metro
- —
- State GDP YoY
- ▲ 2.48%
- F500 in state
- 4
Industry mix (Fortune 500 HQ in IA)
| Industry | F500 HQs | Revenue |
|---|---|---|
| Financial Services | 1 | $16B |
|
||
| Retail / Convenience | 1 | $15B |
|
||
Price history
+61.3% since first listed3 events — show timeline
- 2026-06-10 Listed $129,000 NWIA
- 2022-04-18 Sold (Public Records) $99,732 Public Records
- 2006-05-11 Sold (Public Records) $80,000 Public Records
Property tax history
+1.0%/yrLatest (2025): $1,804 · +2.9% YoY. Source: county tax records.
Cash-flow waterfall
monthlySold comps — $/sqft
last 12 mo · ≤1 miLoading sold comps…