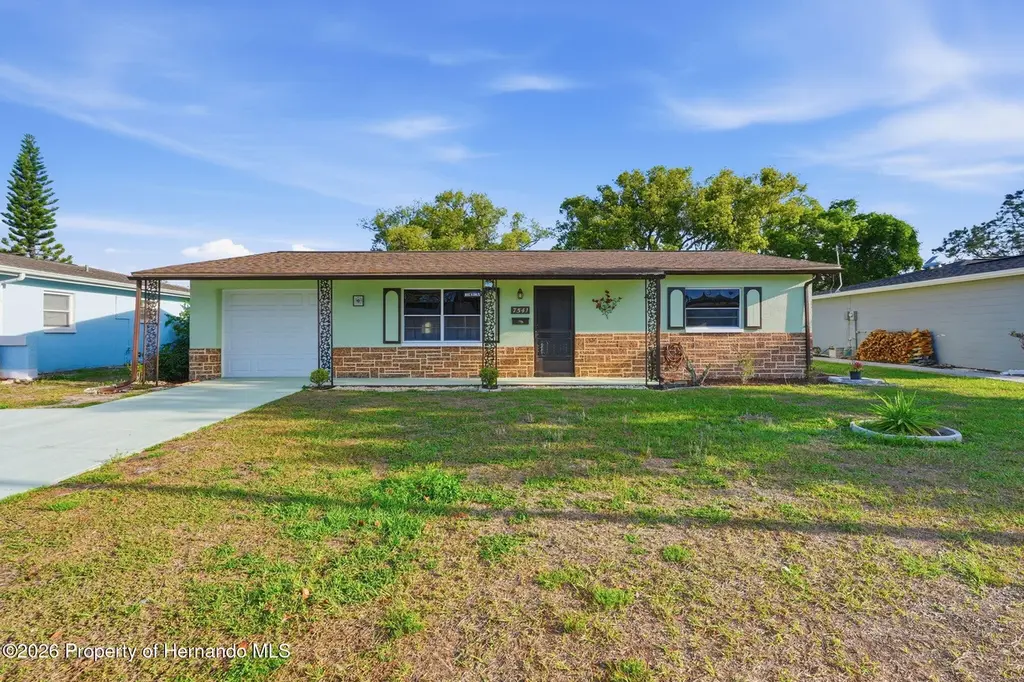
7541 Hollyridge Dr · New Port Richey East, FL
Flood risk 3/10 · Minor
- FEMA flood zone
- A
- Chance of flooding over 30 yrs
- 0.1%
- Est. flood insurance / yr
- $1,009 – $1,996
Fire risk 4/10 · Minor
- Est. fire insurance / yr
- $947 – $1,759
Heat risk 10/10 · Severe
- Hot days now (above 108°F)
- 7 days/yr
- Hot days in 30 yrs
- 27 days/yr
Wind risk 10/10 · Severe
- Chance of severe wind over 30 yrs
- 99.0%
Air-quality risk 2/10 · Minimal
- Unhealthy air days now
- 1 days/yr
- Unhealthy air days in 30 yrs
- 3 days/yr
Risk factors via First Street. Map © Google.
Why this score? — see what drove the C+ grade
The composite is a weighted blend of 9 inputs, each scored 0–100. Each bar is that input's sub-score; the figure is the points it added to the 100-point composite (weight × sub-score).
- Cash flow +24.7/30.0
- ARV discount +15.0/15.0
- DSCR +8.0/10.0
- 1% rule +5.2/10.0
- Schools +4.3/10.0
- Livability +3.4/5.0
- Condition / age +2.5/5.0
- Rent growth +1.8/5.0
- Appreciation +0.0/10.0
$177,900
🖨 Deal sheet 📄 Offer letter ✓ Due diligence
Listing remarks
Your Perfect Florida Retreat Awaits at 7541 Hollyridge Dr in New Port Richey! Step into this charming 2-bedroom, 2-bathroom single-family home in the desirable Magnolia Valley neighborhood of New Port Richey, FL 34653! Built in 1969, this inviting residence offers 1,316 sq ft of comfortable living on a generous 6,383 sq ft lot -- plenty of space to relax, entertain, or add your personal touches. Picture yourself enjoying sunny Florida days in this well-designed home with its practical layout, attached garage, and peaceful surroundings. Whether you're a first-time buyer, retiree looking for easy living, or a savvy investor ready to create instant equity, this gem has incredible potential!
Key facts
- Solid bones
- Spacious lot
- 6,534 sq ft lot
Tags
Property features AI
Finance
- Other: Zoning: R4 (residential)
- Financial info: Tax information not included per instructions
- HOA & community: Homeowners association with $25 annual fee
Exterior
- Parking: One-car garage; Garage parking
- Security: No security features listed
- Utilities: Public water; Public sewer; Electricity connected; Water connected; Sewer connected
- Home design: Single family residence; One story
- Construction: Block and stucco construction; Shingle roof
- Exterior features: Cleared lot; Asphalt-paved roads; County road frontage; Shed on property
Interior
- Kitchen: Electric oven; Electric range; Refrigerator
- Bedrooms: Bedrooms not specified
- Flooring: Carpet; Vinyl
- Bathrooms: Two full bathrooms
- Heating & cooling: Electric heating; Wall/window air conditioning units
- Interior features: Eight total rooms; Rear screened porch
- Laundry & utility: Laundry located in carport
Neighborhood map
What this means for you Summary
Snapshot
- This is a 2-bed/2.0-bath single-family listed at $178k.
Deal economics
- At list price, monthly cash flow is $245 ($3k/yr) — positive.
- The deal already cash-flows at list — no discount required.
- Meets the 1% rule at list price ($2k rent vs $178k).
- Recommended offer: $173k (3.0% below list) — sets the bar for market timing.
- Cap rate 8.8% vs local median 4.3% in New Port Richey East — top-decile yield for the area; either an underpriced asset or a hidden risk that comps aren't pricing in. Stress-test before assuming the spread holds.
Location & tenants
- Location reads 68/100 on livability (#499 in FL) — a middle-class / working-renter tenant base. Strengths: cost of living A+, housing A+, health & safety A+; Watch: amenities F, commute F, employment F.
- Pasco (suburban): math 50% / reading 52% proficiency, ranked #32 of 73 in FL (top 44%) — acceptable for families but not a draw, mixed tenant base, ~2y average lease.
- Market conditions: Rents soft (-2.9%/yr); 305 active listings in the ZIP; 28 comparable units currently listed for rent nearby; rentals at typical pace (median 22d on market — plan ~3-4 weeks tenant-placement turnaround); 6,765 units permitted in Pasco County in 2024 (1,250 in 5+ unit buildings).
- This rent runs 44% of the median local income ($50k/yr) — at the standard rent-burdened threshold; future hikes will face affordability resistance.
Forward outlook
- Local home prices are declining (-3.0%/yr); year-one equity from $1k of loan paydown is wiped out by about $5k of value loss. Plan a longer hold.
- Pasco County population projected at +29% by 2050 — long-run rental-demand tailwind backs the buy-and-hold thesis.
Negotiation context
- It's been on market 57 days — a 3% lower offer ($173k) is reasonable based on typical stale-listing flexibility.
Risks & watch-outs
- Watch-outs: flood insurance adds $125/mo.
- Climate carrying-cost: in FEMA flood zone A (mandatory federal flood insurance); severe wind risk, 99% chance of damaging wind over 30y; extreme-heat days projected 7→27/yr by 2055 (HVAC capex compounding) — expect insurance premiums to compound above CPI over the hold.
Questions for the listing agent
- It's been on market 57 days. Have you received any prior offers? Is the seller open to a 3% concession, seller financing, or rate buy-down credit?
- Built in 1969 — when were the roof, HVAC, electrical panel, plumbing, and water heater last replaced?
- What's the actual annual flood-insurance premium (NFIP or private), and is the property in a SFHA with mandatory coverage?
- What does the HOA fee cover, when was the last increase, and are there any pending special assessments or reserve-fund shortfalls?
- Is there a deadline driving the sale (1031 exchange, divorce, estate, relocation)? That informs how much negotiation room exists.
- Schools are A-rated — typically a magnet for longer-tenancy family renters. What's the average tenant stay here, and is there a school-zone premium baked into asking?
- What's the average days-on-market for RENTAL listings here right now (not sales)? A rising rental-DOM trend means longer vacancies and softer asking-rent achievability than the comps imply.
- What's the recent tenant-quality profile in this submarket — average credit score on applications, eviction rate, late-payment / NSF rate, and stable-employment percentage? A property-management company in the area should have these aggregated.
- How much new for-sale + rental construction is in the pipeline within 1–3 miles? Heavy new supply typically softens prices + rents 12–24 months out; constrained supply supports both.
Investment metrics
- 1% rule
- 1.02% ✓
- Cap rate
- 8.79%
- Cash-on-cash
- 8.93%
- DSCR
- 1.40
- GRM
- 8.1
CMA / ARV
- ARV (on-the-fly)
- $252,672
- Comps found
- 12
Show comp detail 12 sales within ~0.75 mi
| Address | Dist | Beds/Ba | Sqft | Sold | Price | $/sf | Match |
|---|---|---|---|---|---|---|---|
| 7547 Cumber Dr | 0.05mi | 3/2.0 (+1) | 1,230 (-6%) | 1mo | $217,000 | $176 | 81 |
| 7801 Raintree Dr | 0.31mi | 2/2.0 | 1,290 (-2%) | 4mo | $235,000 | $182 | 79 |
| 7846 Wallaba Ln | 0.36mi | 3/2.0 (+1) | 1,307 (-1%) | 1mo | $290,000 | $222 | 76 |
| 7730 Cherrytree Ln | 0.36mi | 3/2.0 (+1) | 1,307 (-1%) | 2mo | $260,000 | $199 | 76 |
| 7924 Sancho Ct | 0.38mi | 2/2.0 | 1,251 (-5%) | 3mo | $285,000 | $228 | 72 |
| 7504 Sequoia Dr | 0.56mi | 3/2.0 (+1) | 1,292 (-2%) | 2mo | $245,000 | $190 | 64 |
| 7944 Yucca Dr | 0.43mi | 3/2.0 (+1) | 1,222 (-7%) | 2mo | $279,000 | $228 | 62 |
| 6819 Parkside Dr | 0.54mi | 3/2.0 (+1) | 1,372 (+4%) | 2mo | $258,000 | $188 | 61 |
| 6440 Parkside Dr | 0.71mi | 3/2.0 (+1) | 1,258 (-4%) | 3mo | $365,000 | $290 | 52 |
| 7619 Summertree Ln | 0.47mi | 3/3.0 (+1) | 1,481 (+12%) | 2mo | $202,000 | $136 | 46 |
| 6633 Hone St | 0.51mi | 3/2.0 (+1) | 1,505 (+14%) | 1mo | $289,000 | $192 | 46 |
| 7846 Cayuga Dr | 0.63mi | 3/2.0 (+1) | 1,510 (+15%) | 1mo | $270,000 | $179 | 40 |
Match score weights: distance 35% · size 25% · config 20% · recency 20%. Top-matched comps best support the ARV.
Projected returns pro-forma
-3.0% appreciation · 0.0% rent growth · sell at horizon
- IRR
- -10.5%
- Equity multiple
- 0.63×
- Total profit
- $-18,523
- Equity at exit
- $26,525
- IRR
- -5.9%
- Equity multiple
- 0.67×
- Total profit
- $-16,597
- Equity at exit
- $15,382
Cash invested: $49,812 (down + closing). Projections, not guarantees.
Landlord ↔ Tenant lean methodology
- Overall (STATE)
- 87 Strongly Landlord-Friendly
- State Florida
- 87 Strongly Landlord-Friendly · R+3
- County
- — inherits STATE
- City
- — inherits STATE
ZIP-level market 34653
- Home prices YoY
- -18.4%
- Rents YoY
- -2.9%
- Active inventory
- 305
- Price-to-rent
- 8.1×
Monthly cashflow live
- Estimated rent
- $1,821 high interval (Pro) →
- Mortgage (P&I)
- −$933
- Tax from tax record
- −$59 /mo · $702/yr
- Insurance
- −$74
- Flood insurance flood zone
- −$125 /mo · $1,502/yr
- HOA
- −$2
- Vacancy / Maint / Mgmt
- −$382
- Net cashflow
- $245
Break-even live
UW: 25.0% down · 7.5% · 30yr · 1.5% tax · 5.0% vac · 8.0% maint · 8.0% mgmt
Financing live
Cash to close
- Down payment
- $44,475
- Closing costs
- $5,337
- Reserves months
- —
- Total cash needed
- —
Loan-product check · same deal, 3 products live
Conventional
25% down · 7.5% · 30yr
- Down + closing
- —
- Monthly P&I
- —
- Monthly cashflow
- —
- DSCR
- —
- Eligible?
- —
Personal DTI + credit; lowest rate.
DSCR
20% down · 8.5% · 30yr
- Down + closing
- —
- Monthly P&I
- —
- Monthly cashflow
- —
- DSCR
- —
- Eligible?
- —
No personal income docs; deal must DSCR.
Hard money
10% down · 12.0% · 12mo
- Down + closing
- —
- Monthly P&I
- —
- Monthly cashflow
- —
- DSCR
- —
- Eligible?
- —
Short-term bridge; refi at stabilization.
Rent comps 28 comps
| Address | Beds | Baths | Sqft | Rent | $/sqft | DOM | Units | Dist |
|---|---|---|---|---|---|---|---|---|
| 7212 Carlton Arms Dr New Port Richey, FL | 2.0 | 1.0–2.0 | 877 | $1,609 | $1.83 | 24d | 1 | 0.57mi |
| 7810 Cayuga Dr New Port Richey, FL | 2.0 | 2.0 | 1838 | $1,973 | $1.07 | 5d | 1 | 0.58mi |
| 7039 Lenox Dr New Port Richey, FL | 3.0 | 2.0 | 1300 | $1,795 | $1.38 | 13d | 1 | 0.68mi |
| 7911 Foxwood Dr New Port Richey, FL | 3.0 | 2.0 | 1529 | $1,749 | $1.14 | 13d | 1 | 0.69mi |
| 7829 Glencoe Dr New Port Richey, FL | 3.0 | 2.0 | 1658 | $2,295 | $1.38 | 20d | 1 | 0.83mi |
| 7544 Red Mill Cir New Port Richey, FL | 3.0 | 2.5 | 1513 | $2,200 | $1.45 | 18d | 1 | 0.88mi |
| 6635 Crossbow Ln New Port Richey, FL | 2.0 | 2.0 | 1082 | $1,695 | $1.57 | 18d | 1 | 0.89mi |
| 7542 Red Mill Cir New Port Richey, FL | 3.0 | 2.5 | 1662 | $2,100 | $1.26 | 24d | 1 | 0.90mi |
| 6474 Taylor Ct New Port Richey, FL | 3.0 | 2.0 | 1620 | $2,400 | $1.48 | 11d | 1 | 0.95mi |
| 8102 Chickasaw Ln Port Richey, FL | 3.0 | 2.0 | 1688 | $1,969 | $1.17 | 5d | 1 | 0.95mi |
| 8427 Blue Rock Dr New Port Richey, FL | 3.0 | 2.5 | 1513 | $2,250 | $1.49 | 3d | 1 | 0.97mi |
| 6548 Batea Ter New Port Richey, FL | 3.0 | 2.0 | 1120 | $1,800 | $1.61 | 24d | 1 | 0.97mi |
| 6692 Homebound Way New Port Richey, FL | 2.0 | 2.0 | 1630 | $2,600 | $1.60 | 24d | 1 | 1.00mi |
| 8228 Chasco Woods Blvd Port Richey, FL | 1.0–3.0 | 1.0–2.0 | 966 | $1,388 | $1.44 | 2d | 22 | 1.11mi |
| 6447 Eric Dr New Port Richey, FL | 2.0 | 2.0 | 1133 | $1,400 | $1.24 | 24d | 1 | 1.13mi |
| 8030 Gabriel Dr Port Richey, FL | 3.0 | 2.0 | 1501 | $2,025 | $1.35 | 5d | 1 | 1.16mi |
| 6405 Eric Dr New Port Richey, FL | 2.0 | 2.0 | 1133 | $1,400 | $1.24 | 24d | 1 | 1.19mi |
| 6430 Lomand Ave New Port Richey, FL | 2.0 | 1.5 | 952 | $1,550 | $1.63 | 24d | 1 | 1.25mi |
| 6250 Kentfield Ave New Port Richey, FL | 3.0 | 2.0 | 1578 | $2,500 | $1.58 | 5d | 1 | 1.28mi |
| 6338 Aberdeen Ave New Port Richey, FL | 3.0 | 2.0 | 1000 | $2,300 | $2.30 | 17d | 1 | 1.28mi |
| 6430 Polk St New Port Richey, FL | 3.0 | 2.0 | 1270 | $1,800 | $1.42 | 22d | 1 | 1.29mi |
| 6300 Limerick Ave New Port Richey, FL | 3.0 | 2.0 | 953 | $1,650 | $1.73 | 24d | 1 | 1.33mi |
| 6332 Pennsylvania Ave New Port Richey, FL | 2.0 | 1.0 | 920 | $1,250 | $1.36 | 24d | 1 | 1.34mi |
| 6332 Pennsylvania Ave New Port Richey, FL | 2.0 | 1.0 | 962 | $1,250 | $1.30 | 20d | 1 | 1.34mi |
| 8356 Journet Blvd Port Richey, FL | 1.0–2.0 | 1.0 | 843 | $1,315 | $1.56 | 24d | 1 | 1.36mi |
| 7713 Heather St New Port Richey, FL | 3.0 | 2.0 | 1344 | $1,800 | $1.34 | 24d | 1 | 1.42mi |
| 7741 Forest Trl #3 Port Richey, FL | 2.0 | 2.0 | 1010 | $1,500 | $1.49 | 24d | 1 | 1.47mi |
| 6073 Vermont Ave New Port Richey, FL | 3.0 | 2.0 | 1562 | $2,250 | $1.44 | 24d | 1 | 1.49mi |
HOA detail
- Monthly dues
- $2 · $24/yr
Listing history 11 events
-
2026-06-13statusdays on market $177,900 Pending 57 DOM
-
2026-06-09days on market $177,900 Active 55 DOM
-
2026-06-08days on market $177,900 Active 54 DOM
-
2026-06-07pricedays on market $177,900 Active 53 DOM
-
2026-06-04days on market $199,900 Active 50 DOM
-
2026-06-03days on market $199,900 Active 49 DOM
-
2026-06-02days on market $199,900 Active 48 DOM
-
2026-06-01days on market $199,900 Active 47 DOM
-
2026-05-31days on market $199,900 Active 46 DOM
-
2026-05-14price $199,900
-
2026-04-15$209,966 Active
ⓘ Source: listings_history table (triggers on properties + properties_extension) + one-shot
backfill from property_details.listing_events for pre-trigger history.
Tax reassessment forecast FL · Resets to sale price
- Current annual tax
- $702 · $59/mo
- Projected year-2 tax
- $1,477 · $123/mo
- Expected delta
- +$774/yr (+$65/mo · 110.3%)
ⓘ Screening estimate from a state-policy table — verify with the county assessor before closing.
Climate risk First Street
- Flood 3/10 Moderate FEMA zone A · 10% chance over 30 yrs
- Wildfire 4/10 Moderate
- Heat 10/10 Extreme 7 d/yr ≥108°F today · 27 d/yr by 30 yrs out
- Wind 10/10 Extreme 99% chance of damaging wind over 30 yrs
- Air quality 2/10 Low 1 unhealthy d/yr today · 3 by 30 yrs out
Nearby sold comps map
Loading sold comps map…
Walkable amenities ~0.75 mi
Loading nearby amenities…
Taxation est. · year 1
- Rental income
- $21,847
- − Mortgage interest
- −$9,965
- − Property taxes
- −$702
- − Insurance
- −$2,392
- − Repairs & maintenance
- −$1,748
- − Management
- −$1,748
- − HOA
- −$24
- − Depreciation
- −$5,175
- Taxable income
- $93
- Est. tax owed @ 24.0%
- −$22
- After-tax cash flow
- $2,923/yr
For passive investors: Depreciation is non-cash, so a rental often shows a tax loss while cash-flowing — sheltering income. Rental losses are passive: they offset passive income freely, and up to $25,000/yr can offset ordinary (W-2) income if you actively participate and your MAGI is under $100k (phasing out to $0 by $150k); unused losses carry forward. On sale, claimed depreciation is recaptured at up to 25%, and gains may owe capital-gains tax (a 1031 exchange can defer both). Figures are a year-1 estimate at your 24.0% rate — not tax advice; consult a CPA.
Schools (NCES district)
- District
- Pasco
- NCES district ID
- 1201530
- Math proficiency
- 50% ▼ -10.00%
- Reading proficiency
- 52% ▼ -5.00%
- Median HH income
- $45,039
- Composite
- 43.14/100
- National rank
- #3074
- State rank
- #32 of 73 in FL
Livability — New Port Richey East
- Score
- 68/100
- State rank
- #499
- US rank
- #9203
Category grades
Schools grade is shown separately in the Schools card above.
Census & demographics
- Census place
- New Port Richey East, FL
- County
- Pasco County · 524,098 people
- City population
- 36,086
- Metro
- Tampa-St. Petersburg-Clearwater, FL
- Population (ZIP)
- 35,945
- Household income
- $49,563
- Rent vs Own
- Severe rent burden
- 1439.0
Population outlook (Pasco County) Hauer SSP2
- Today (2025)
- 570,045 people
- By 2030
- 605,844 · +6.3%
- By 2040
- 674,806 · +18.4%
- By 2050
- 736,022 · +29.1%
- By 2075
- 862,900 · +51.4%
- By 2100
- 906,364 · +59.0%
Race, ethnicity, and origin ACS 2023
- Neighborhood character
- Predominantly White (74%)
- Race & ethnicity
- White 74% Hispanic / Latino 14% Two or more races 9% Black 6% Asian 2%
- Hispanic origin (detail)
- Mexican 3% Puerto Rican 4% Cuban 2%
- Common ancestry
- Romanian 3% Lithuanian 2% Slovak 2%
- Foreign-born
- 11% · Canada, Jamaica, China
- Languages at home
- 84% English-only · Spanish 9% Other Indo-European 2% Russian/Polish/Slavic 2%
Political lean MEDSL · Pasco
- 2024 margin
- Strong R (+25.2) · D 36.9% · R 62.1% · Other 1.0%
- 2008→2024 swing
- -21.6pp toward R · 2008: -3.6pp · 2024: -25.2pp
- All cycles
- 2024: R+25.2 2020: R+20.1 2016: R+21.6 2012: R+6.7 2008: R+3.6
Not yet ingested
- Civics
- —
Market trends
- HPI YoY
- ▼ -73.10%
- Current HPI
- 324.6519
- Rent YoY
- ▼ -2.92%
- Metro
- Tampa-St. Petersburg-Clearwater, FL
- State GDP YoY
- ▲ 3.28%
- F500 in state
- 36
Industry mix (Fortune 500 HQ in FL)
| Industry | F500 HQs | Revenue |
|---|---|---|
| Industrial Technology | 2 | $29B |
|
||
| Insurance | 2 | $17B |
|
||
| Retail | 1 | $60B |
|
||
| Technology Distribution | 1 | $58B |
|
||
| Homebuilding | 1 | $35B |
|
||
| Technology Manufacturing | 1 | $35B |
|
||
Price history
-4.8% since first listed2 events — show timeline
- 2026-05-14 Price Changed $199,900 HCAR
- 2026-04-15 Listed $209,966 HCAR
Property tax history
+4.4%/yrLatest (2025): $702 · +1.9% YoY. Source: county tax records.
Cash-flow waterfall
monthlySold comps — $/sqft
last 12 mo · ≤1 miLoading sold comps…