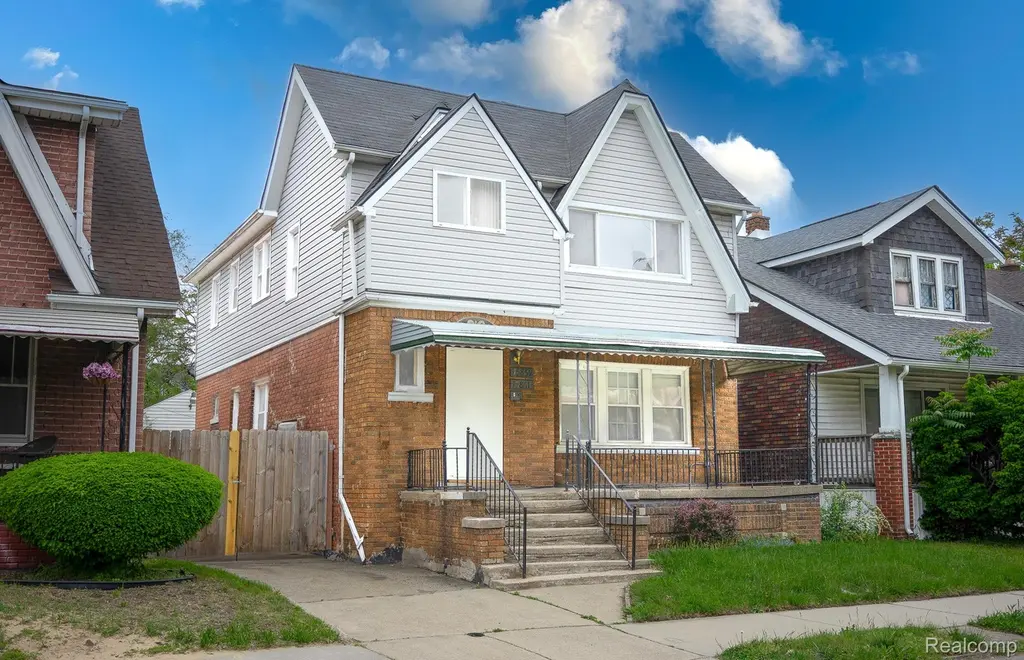
15859 Cloverlawn St · Detroit, MI
Flood risk 1/10 · Minimal
- FEMA flood zone
- X (unshaded)
- Chance of flooding over 30 yrs
- 0.0%
- Est. flood insurance / yr
- $473 – $860
Fire risk 1/10 · Minimal
- Est. fire insurance / yr
- $784 – $1,456
Heat risk 3/10 · Minor
- Hot days now (above 97°F)
- 7 days/yr
- Hot days in 30 yrs
- 15 days/yr
Wind risk 2/10 · Minimal
- Chance of severe wind over 30 yrs
- —
Air-quality risk 3/10 · Minor
- Unhealthy air days now
- 2 days/yr
- Unhealthy air days in 30 yrs
- 5 days/yr
Risk factors via First Street. Map © Google.
Why this score? — see what drove the C+ grade
The composite is a weighted blend of 9 inputs, each scored 0–100. Each bar is that input's sub-score; the figure is the points it added to the 100-point composite (weight × sub-score).
- Cash flow +30.0/30.0
- 1% rule +10.0/10.0
- DSCR +10.0/10.0
- Rent growth +4.0/5.0
- Livability +3.7/5.0
- Condition / age +2.5/5.0
- Schools +1.3/10.0
- ARV discount +0.0/15.0
- Appreciation +0.0/10.0
$99,900
🖨 Deal sheet 📄 Offer letter ✓ Due diligence
Listing remarks MLS
Unlock the possibilities at 15859 Cloverlawn in Detroit! This classic brick duplex is brimming with opportunity for both investors and hands-on buyers ready to add value. Whether your goal is house hacking or expanding your rental portfolio, each spacious unit provides a flexible layout and a clean slate to bring your vision to life. Located on Detroit’s west side, the property sits close to schools, parks, major roadways, and shopping, offering quick connections to every corner of the city. Take advantage of this chance to turn Cloverlawn into your next income-producing property or customized home. Schedule your private tour today and see the potential for yourself! Purchaser to pay 395 processing fee. As-is sale. SELLER FINANCING / LAND CONTRACT TERMS AVAILABLE AT 110,000 PURCHASE PRICE, 30,000 DOWN PAYMENT, 8% INTEREST, 120 MONTH TERM. 971 / MONTH. seller financing/land contract terms are negotiable.
Key facts
- Close to parks
- Close to schools
- Classic brick duplex
Tags
Neighborhood map
What this means for you Summary
Snapshot
- This is a 4-bed/1.5-bath townhouse listed at $100k.
Deal economics
- At list price, monthly cash flow is $535 ($6k/yr) — positive.
- The deal already cash-flows at list — no discount required.
- Meets the 1% rule at list price ($2k rent vs $100k).
- Recommended offer: $88k (12.0% below list) — sets the bar for market timing.
- Cap rate 12.7% vs local median 10.2% in Detroit — meaningfully above typical; check what's discounted (condition, days-on-market, listing class) to confirm the premium yield is real.
Location & tenants
- Location reads 73/100 on livability (#218 in MI) — a middle-class / working-renter tenant base. Strengths: amenities A+, commute A+, cost of living A+; Watch: schools F, crime F, employment F.
- Detroit Public Schools Community District (urban): math 10% / reading 24% proficiency, ranked #499 of 540 in MI (top 92%) — low school quality limits family demand, transient renter base, plan for 1-2y turnover; 90% free/reduced lunch — lower-income household profile, screen leases tightly.
- Market conditions: Rents rising fast (+6.1%/yr); 346 active listings in the ZIP; 21 comparable units currently listed for rent nearby; rentals at typical pace (median 20d on market — plan ~3-4 weeks tenant-placement turnaround); lower-income renter base — watch delinquency; 2,639 units permitted in Wayne County in 2024 (1,216 in 5+ unit buildings).
- At $1,535/mo this rent would consume 55% of the median local household income ($33k/yr) (locally 2172% of renters already pay >50% of income on rent) — very limited rent-growth headroom before tenants either downsize or default.
Forward outlook
- Local home prices are declining (-3.0%/yr); year-one equity from $691 of loan paydown is wiped out by about $3k of value loss. Plan a longer hold.
- Wayne County population projected at -17% by 2050 — secular population decline; favor cash flow + early exit over multi-decade hold.
- At projected returns (-3.0% appreciation + 6.1% rent growth), your $28k cash investment doubles in ~5 years — after that, you're playing with house money.
Negotiation context
- It's been on market 164 days — a 12% lower offer ($88k) is reasonable based on typical stale-listing flexibility.
- 6 sale attempts with the ask held roughly flat each time — persistent listings suggest the price (not the market) is what's stuck; bring a comps-based counter.
Risks & watch-outs
- Watch-outs: built in 1928 — expect roof / HVAC / electrical / plumbing capex.
Questions for the listing agent
- It's been on market 164 days. Have you received any prior offers? Is the seller open to a 12% concession, seller financing, or rate buy-down credit?
- Built in 1928 — when were the roof, HVAC, electrical panel, plumbing, and water heater last replaced?
- Why hasn't it sold? Are there any deal-killer items the seller is aware of (foundation, flood, title, zoning, code violations)?
- Is there a deadline driving the sale (1031 exchange, divorce, estate, relocation)? That informs how much negotiation room exists.
- Schools are F-rated, which usually means shorter tenancies and higher turnover. Who's the typical renter profile here, and what's been the actual vacancy rate?
- Crime grade is F in this area — have there been break-ins, vandalism, or insurance claims at this property in the last 3 years? What carrier currently insures it and at what premium?
- What's the average days-on-market for RENTAL listings here right now (not sales)? A rising rental-DOM trend means longer vacancies and softer asking-rent achievability than the comps imply.
- What's the recent tenant-quality profile in this submarket — average credit score on applications, eviction rate, late-payment / NSF rate, and stable-employment percentage? A property-management company in the area should have these aggregated.
- How much new for-sale + rental construction is in the pipeline within 1–3 miles? Heavy new supply typically softens prices + rents 12–24 months out; constrained supply supports both.
Investment metrics
- 1% rule
- 1.54% ✓
- Cap rate
- 12.73%
- Cash-on-cash
- 22.97%
- DSCR
- 2.02
- GRM
- 5.4
CMA / ARV
- ARV (median comp)
- $68,015
- List price
- $99,900
- Delta
- 46.88%
- Verdict
- OVERPRICED
- Comps
- 20 within 1.0 mi
Projected returns pro-forma
-3.0% appreciation · 6.14% rent growth · sell at horizon
- IRR
- 19.4%
- Equity multiple
- 1.82×
- Total profit
- $22,934
- Equity at exit
- $14,895
- IRR
- 29.8%
- Equity multiple
- 4.07×
- Total profit
- $85,842
- Equity at exit
- $8,638
Cash invested: $27,972 (down + closing). Projections, not guarantees.
Landlord ↔ Tenant lean methodology
- Overall (STATE)
- 62 Landlord-Friendly
- State Michigan
- 62 Landlord-Friendly · EVEN
- County
- — inherits STATE
- City
- — inherits STATE
ZIP-level market 48238
- Home prices YoY
- -14.4%
- Rents YoY
- 6.1%
- Active inventory
- 346
- Price-to-rent
- 5.4×
Monthly cashflow live
- Estimated rent
- $1,535 high interval (Pro) →
- Mortgage (P&I)
- −$524
- Tax from tax record
- −$112 /mo · $1,340/yr
- Insurance
- −$42
- HOA
- −$0
- Vacancy / Maint / Mgmt
- −$322
- Net cashflow
- $535
Break-even live
UW: 25.0% down · 7.5% · 30yr · 1.5% tax · 5.0% vac · 8.0% maint · 8.0% mgmt
Financing live
Cash to close
- Down payment
- $24,975
- Closing costs
- $2,997
- Reserves months
- —
- Total cash needed
- —
Loan-product check · same deal, 3 products live
Conventional
25% down · 7.5% · 30yr
- Down + closing
- —
- Monthly P&I
- —
- Monthly cashflow
- —
- DSCR
- —
- Eligible?
- —
Personal DTI + credit; lowest rate.
DSCR
20% down · 8.5% · 30yr
- Down + closing
- —
- Monthly P&I
- —
- Monthly cashflow
- —
- DSCR
- —
- Eligible?
- —
No personal income docs; deal must DSCR.
Hard money
10% down · 12.0% · 12mo
- Down + closing
- —
- Monthly P&I
- —
- Monthly cashflow
- —
- DSCR
- —
- Eligible?
- —
Short-term bridge; refi at stabilization.
Rent comps 21 comps
| Address | Beds | Baths | Sqft | Rent | $/sqft | DOM | Units | Dist |
|---|---|---|---|---|---|---|---|---|
| 15756 Ohio St Detroit, MI | 5.0 | 2.0 | 1934 | $1,700 | $0.88 | 24d | 1 | 0.18mi |
| 16183 Wisconsin St Detroit, MI | 3.0 | 1.5 | 1370 | $1,400 | $1.02 | 43d | 1 | 0.25mi |
| 15457 Cloverlawn St Detroit, MI | 3.0 | 2.0 | 1500 | $1,275 | $0.85 | 24d | 1 | 0.26mi |
| 16546 Wisconsin St Detroit, MI | 3.0 | 1.0 | 1577 | $1,500 | $0.95 | 43d | 1 | 0.33mi |
| 16211 Kentucky St Detroit, MI | 4.0 | 2.0 | 2168 | $1,995 | $0.92 | 17d | 1 | 0.36mi |
| 16255 Lilac St Detroit, MI | 3.0 | 1.0 | 1312 | $1,394 | $1.06 | 17d | 1 | 0.36mi |
| 15708 Birwood St Detroit, MI | 3.0 | 1.0 | 1255 | $1,100 | $0.88 | 4d | 1 | 0.59mi |
| 16582 Santa Rosa Dr Detroit, MI | 3.0 | 1.0 | 1314 | $1,399 | $1.06 | 17d | 1 | 0.62mi |
| 16889 Washburn St Detroit, MI | 3.0 | 1.5 | 1300 | $1,100 | $0.85 | 17d | 1 | 0.64mi |
| 16934 Ilene St Detroit, MI | 3.0 | 1.5 | 1516 | $1,400 | $0.92 | 20d | 1 | 0.70mi |
| 17163 Prairie St Unit 1B Detroit, MI | 3.0 | 1.5 | 1317 | $1,350 | $1.03 | 43d | 1 | 0.74mi |
| 17530 Roselawn St Unit 1 Detroit, MI | 3.0 | 2.0 | 1600 | $2,000 | $1.25 | 24d | 1 | 0.84mi |
| Ohio St Unit 4 Detroit, MI | 4.0 | 1.5 | 1400 | $750 | $0.54 | 43d | 1 | 0.95mi |
| 16230 Cheyenne St Detroit, MI | 3.0 | 1.0 | 1653 | $1,450 | $0.88 | 43d | 1 | 1.14mi |
| 14242 Ohio St Detroit, MI | 4.0 | 1.0 | 1400 | $1,000 | $0.71 | 43d | 1 | 1.15mi |
| 16503 Linwood St Detroit, MI | 4.0 | 2.0 | 2415 | $1,800 | $0.75 | 3d | 1 | 1.29mi |
| 14011 Roselawn St Detroit, MI | 4.0 | 1.5 | 1300 | $1,450 | $1.12 | 17d | 1 | 1.30mi |
| 14011 Roselawn St Detroit, MI | 4.0 | 1.5 | 1300 | $1,450 | $1.12 | 1d | 1 | 1.30mi |
| 13979 Cherrylawn St Detroit, MI | 3.0 | 1.0 | 1296 | $1,334 | $1.03 | 20d | 1 | 1.33mi |
| 13620 Kentucky St Detroit, MI | 3.0 | 1.0 | 1248 | $1,200 | $0.96 | 4d | 1 | 1.48mi |
| 18935 Indiana St Detroit, MI | 3.0 | 1.0 | 1248 | $1,523 | $1.22 | 4d | 1 | 1.49mi |
Listing history 22 events
-
2026-06-18days on market $99,900 Active 164 DOM
-
2026-06-17days on market $99,900 Active 163 DOM
-
2026-06-15days on market $99,900 Active 161 DOM
-
2026-06-13days on market $99,900 Active 159 DOM
-
2026-06-13days on market $99,900 Active 158 DOM
-
2026-06-09days on market $99,900 Active 155 DOM
-
2026-06-08days on market $99,900 Active 154 DOM
-
2026-06-07days on market $99,900 Active 153 DOM
-
2026-06-04days on market $99,900 Active 150 DOM
-
2026-06-03days on market $99,900 Active 149 DOM
-
2026-06-01days on market $99,900 Active 147 DOM
-
2026-05-31days on market $99,900 Active 146 DOM
-
2026-01-05$99,900 Active 923-char remark
Show marketing remark (916 chars)
Unlock the possibilities at 15859 Cloverlawn in Detroit! This classic brick duplex is brimming with opportunity for both investors and hands-on buyers ready to add value. Whether your goal is house hacking or expanding your rental portfolio, each spacious unit provides a flexible layout and a clean slate to bring your vision to life. Located on Detroit's west side, the property sits close to schools, parks, major roadways, and shopping, offering quick connections to every corner of the city. Take advantage of this chance to turn Cloverlawn into your next income-producing property or customized home. Schedule your private tour today and see the potential for yourself! Purchaser to pay 395 processing fee. As-is sale. SELLER FINANCING / LAND CONTRACT TERMS AVAILABLE AT 110,000 PURCHASE PRICE, 30,000 DOWN PAYMENT, 8% INTEREST, 120 MONTH TERM. 971 / MONTH. seller financing/land contract terms are negotiable.
-
2026-01-05$99,900 Active 916-char remark
Show marketing remark (916 chars)
Unlock the possibilities at 15859 Cloverlawn in Detroit! This classic brick duplex is brimming with opportunity for both investors and hands-on buyers ready to add value. Whether your goal is house hacking or expanding your rental portfolio, each spacious unit provides a flexible layout and a clean slate to bring your vision to life. Located on Detroit's west side, the property sits close to schools, parks, major roadways, and shopping, offering quick connections to every corner of the city. Take advantage of this chance to turn Cloverlawn into your next income-producing property or customized home. Schedule your private tour today and see the potential for yourself! Purchaser to pay 395 processing fee. As-is sale. SELLER FINANCING / LAND CONTRACT TERMS AVAILABLE AT 110,000 PURCHASE PRICE, 30,000 DOWN PAYMENT, 8% INTEREST, 120 MONTH TERM. 971 / MONTH. seller financing/land contract terms are negotiable.
-
2026-01-01historical
-
2026-01-01historical
-
2025-09-26$99,900 Active
-
2025-09-26$99,900 Active
-
2025-09-02historical
-
2025-09-02historical
-
2025-06-19$99,900 Active
-
2025-06-19$99,900 Active
ⓘ Source: listings_history table (triggers on properties + properties_extension) + one-shot
backfill from property_details.listing_events for pre-trigger history.
Tax reassessment forecast MI · Partial reset (capped growth)
- Current annual tax
- $1,340 · $112/mo
- Projected year-2 tax
- $1,439 · $120/mo
- Expected delta
- +$99/yr (+$8/mo · 7.4%)
ⓘ Screening estimate from a state-policy table — verify with the county assessor before closing.
Climate risk First Street
- Flood 1/10 Low FEMA zone X (unshaded) · 0% chance over 30 yrs
- Wildfire 1/10 Low
- Heat 3/10 Moderate 7 d/yr ≥97°F today · 15 d/yr by 30 yrs out
- Wind 2/10 Low
- Air quality 3/10 Moderate 2 unhealthy d/yr today · 5 by 30 yrs out
Nearby sold comps map
Loading sold comps map…
Walkable amenities ~0.75 mi
Loading nearby amenities…
Taxation est. · year 1
- Rental income
- $18,420
- − Mortgage interest
- −$5,596
- − Property taxes
- −$1,340
- − Insurance
- −$500
- − Repairs & maintenance
- −$1,474
- − Management
- −$1,474
- − Depreciation
- −$2,906
- Taxable income
- $5,131
- Est. tax owed @ 24.0%
- −$1,231
- After-tax cash flow
- $5,194/yr
For passive investors: Depreciation is non-cash, so a rental often shows a tax loss while cash-flowing — sheltering income. Rental losses are passive: they offset passive income freely, and up to $25,000/yr can offset ordinary (W-2) income if you actively participate and your MAGI is under $100k (phasing out to $0 by $150k); unused losses carry forward. On sale, claimed depreciation is recaptured at up to 25%, and gains may owe capital-gains tax (a 1031 exchange can defer both). Figures are a year-1 estimate at your 24.0% rate — not tax advice; consult a CPA.
Schools (NCES district)
- District
- Detroit Public Schools Community District
- NCES district ID
- 2601103
- Math proficiency
- 10% ▼ -2.00%
- Reading proficiency
- 24% ▲ 6.00%
- Median HH income
- $25,815
- Composite
- 13.06/100
- National rank
- #9564
- State rank
- #499 of 540 in MI
Livability — Detroit
- Score
- 73/100
- State rank
- #218
- US rank
- #5427
Category grades
Schools grade is shown separately in the Schools card above.
Census & demographics
- Census place
- Detroit, MI
- County
- Wayne County · 1,562,939 people
- City population
- 572,865
- Metro
- Detroit-Warren-Dearborn, MI
- Population (ZIP)
- 24,731
- Household income
- $33,315
- Rent vs Own
- Severe rent burden
- 2172.0
Population outlook (Wayne County) Hauer SSP2
- Today (2025)
- 1,675,273 people
- By 2030
- 1,620,300 · -3.3%
- By 2040
- 1,502,341 · -10.3%
- By 2050
- 1,384,039 · -17.4%
- By 2075
- 1,124,592 · -32.9%
- By 2100
- 881,193 · -47.4%
Race, ethnicity, and origin ACS 2023
- Neighborhood character
- Predominantly Black (94%)
- Race & ethnicity
- Black 94% Two or more races 3% White 1%
- Foreign-born
- 1%
Political lean MEDSL · Wayne
- 2024 margin
- Strong D (+29.0) · D 62.7% · R 33.7% · Other 3.6%
- 2008→2024 swing
- -20.5pp toward R · 2008: 49.5pp · 2024: 29.0pp
- All cycles
- 2024: D+29.0 2020: D+38.1 2016: D+37.3 2012: D+46.9 2008: D+49.5
Not yet ingested
- Civics
- —
Market trends
- HPI YoY
- ▼ -31.96%
- Current HPI
- 189.6227
- Rent YoY
- ▲ 6.14%
- Metro
- Detroit-Warren-Dearborn, MI
- State GDP YoY
- ▲ 1.37%
- F500 in state
- 28
Industry mix (Fortune 500 HQ in MI)
| Industry | F500 HQs | Revenue |
|---|---|---|
| Automotive Parts | 3 | $48B |
|
||
| Automotive | 2 | $372B |
|
||
| Chemicals | 1 | $45B |
|
||
| Automotive Retail | 1 | $29B |
|
||
| Healthcare / Medical Devices | 1 | $23B |
|
||
| Automotive Technology | 1 | $20B |
|
||
Price history
+0.0% since first listed10 events — show timeline
- 2026-01-05 Listed $99,900 REALCOMP
- 2026-01-05 Listed $99,900 MiRealSource-MiMLS
- 2026-01-01 Listing Removed — MiRealSource-MiMLS
- 2026-01-01 Listing Removed — REALCOMP
- 2025-09-26 Listed $99,900 REALCOMP
- 2025-09-26 Listed $99,900 MiRealSource-MiMLS
- 2025-09-02 Listing Removed — MiRealSource-MiMLS
- 2025-09-02 Listing Removed — REALCOMP
- 2025-06-19 Listed $99,900 MiRealSource-MiMLS
- 2025-06-19 Listed $99,900 REALCOMP
Property tax history
-1.2%/yrLatest (2025): $1,340 · -8.3% YoY. Source: county tax records.
Cash-flow waterfall
monthlySold comps — $/sqft
last 12 mo · ≤1 miLoading sold comps…