3965 N Melody St · Kingman, AZ
Flood risk 1/10 · Minimal
- FEMA flood zone
- X (unshaded)
- Chance of flooding over 30 yrs
- 0.0%
- Est. flood insurance / yr
- $507 – $1,088
Fire risk 7/10 · Major
- Est. fire insurance / yr
- $610 – $1,132
Heat risk 6/10 · Moderate
- Hot days now (above 100°F)
- 7 days/yr
- Hot days in 30 yrs
- 18 days/yr
Wind risk 1/10 · Minimal
- Chance of severe wind over 30 yrs
- —
Air-quality risk 1/10 · Minimal
- Unhealthy air days now
- 0 days/yr
- Unhealthy air days in 30 yrs
- 0 days/yr
Risk factors via First Street. Map © Google.
Why this score? — see what drove the B+ grade
The composite is a weighted blend of 9 inputs, each scored 0–100. Each bar is that input's sub-score; the figure is the points it added to the 100-point composite (weight × sub-score).
- Cash flow +30.0/30.0
- ARV discount +15.0/15.0
- DSCR +10.0/10.0
- 1% rule +9.3/10.0
- Livability +4.0/5.0
- Rent growth +2.6/5.0
- Condition / age +2.5/5.0
- Schools +1.8/10.0
- Appreciation +0.0/10.0
$120,000
🖨 Deal sheet (PDF) 📄 Offer letter ✓ Due diligence
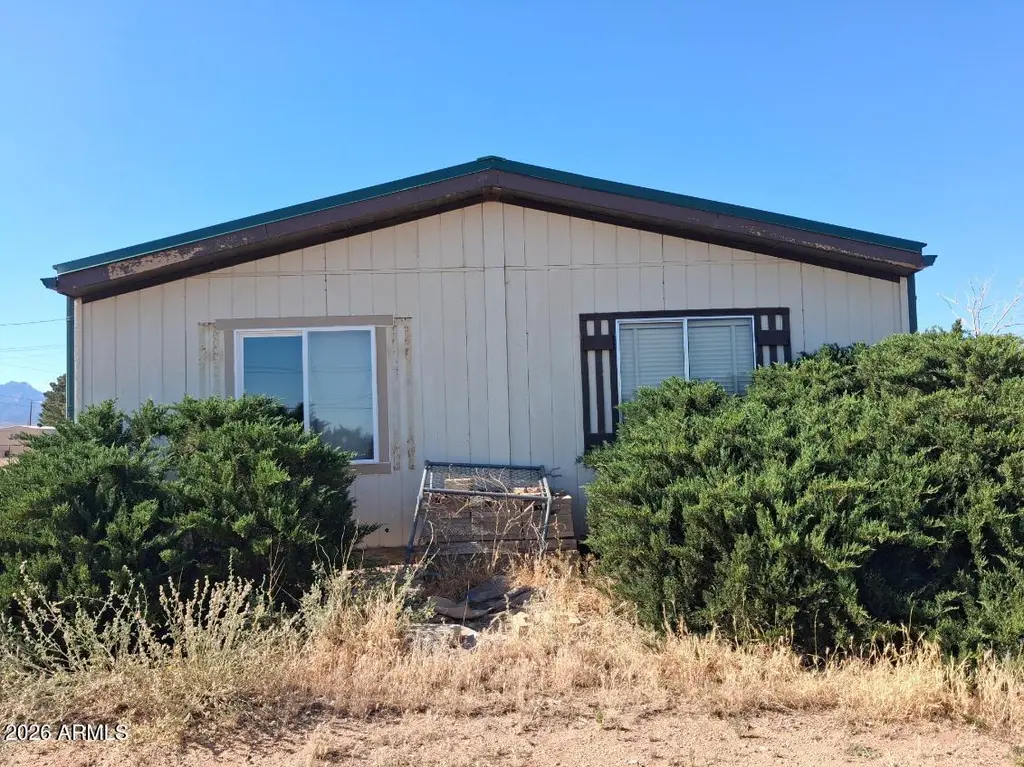
Listing remarks
Investor opportunity in Kingman, Arizona. This manufactured home sits on a full 1-acre lot with all utilities already in place. The property requires a full renovation and is best suited for investors, flippers, or experienced buyers looking for a value-add project. With existing infrastructure, usable land, and upside at the right price point, this is a strong opportunity to unlock potential.
Key facts
- Value-add project
- Full 1-acre lot
- Usable land
Tags
Property features AI
Finance
- HOA & community: No association fees
Exterior
- Utilities: City water; Septic tank
- Home design: Manufactured/mobile home; Fee simple ownership
- Construction: Wood siding with wood frame construction; Composition roof
- Exterior features: Chain link fencing; Dirt front and dirt back yard
Interior
- Bedrooms: Up to 3 bedrooms
- Bathrooms: 2 full bathrooms
- Heating & cooling: Central air conditioning; Has heating
- Interior features: 3/4 bath in the primary bedroom; Indoor laundry
- Laundry & utility: Laundry located inside the home
Neighborhood map
What this means for you Summary
Snapshot
- This is a 3-bed/2.0-bath land listed at $120k.
Deal economics
- At list price, monthly cash flow is $653 ($8k/yr) — positive.
- The deal already cash-flows at list — no discount required.
- Meets the 1% rule at list price ($2k rent vs $120k).
- Recommended offer: $116k (3.0% below list) — sets the bar for market timing.
- Cap rate 12.8% vs local median 3.5% in Kingman — top-decile yield for the area; either an underpriced asset or a hidden risk that comps aren't pricing in. Stress-test before assuming the spread holds.
Location & tenants
- Location reads 79/100 on livability (#5 in AZ, #2,014 nationally) — a middle-class / working-renter tenant base. Strengths: commute A+, cost of living A+, housing A+; Watch: crime C-, employment C-, amenities F.
- Kingman Unified School District (79598) (town): math 19% / reading 24% proficiency, ranked #179 of 249 in AZ (top 72%) — low school quality limits family demand, transient renter base, plan for 1-2y turnover.
- Zoned schools: Cerbat Elementary (math 9% / reading 15%, grade F, #963 of 1,109 statewide, top 87%, 700 students, 78% FRL); Kingman Middle School (math 10% / reading 13%, grade F, #180 of 218 statewide, top 83%, 737 students, 74% FRL); Kingman High School (math 4% / reading 6%, grade F, #364 of 381 statewide, top 100%, 905 students, 50% FRL).
- Zoned-school proficiency averages 10% at this address vs 22% district-wide (-12 pts) — the specific schools serving this property underperform the Kingman Unified School District (79598) average; the district grade overstates school quality for this exact location.
- Market conditions: Rents flat; 647 active listings in the ZIP; 18 comparable units currently listed for rent nearby; rentals lingering (median 46d on market — plan ~5-8 weeks vacancy on turnover, expect pricing pressure); 50% of comp listings sitting > 30 days — soft ceiling on asking rent; 2,543 units permitted in Mohave County in 2024 (33 in 5+ unit buildings).
- This rent runs 41% of the median local income ($51k/yr) — at the standard rent-burdened threshold; future hikes will face affordability resistance.
Forward outlook
- Local home prices are declining (-3.0%/yr); year-one equity from $830 of loan paydown is wiped out by about $4k of value loss. Plan a longer hold.
- Mohave County population projected to shrink 6% by 2050 — rents likely to lag national; underwrite the cash flow, not the appreciation.
- At projected returns (-3.0% appreciation + 0.3% rent growth), your $34k cash investment doubles in ~7 years — after that, you're playing with house money.
Negotiation context
- It's been on market 38 days — a 3% lower offer ($116k) is reasonable based on typical stale-listing flexibility.
- Current owner paid $58k; list at $120k implies a 109% gain — meaningful room to come down on a strong offer.
Risks & watch-outs
- Climate carrying-cost: major wildfire risk; extreme-heat days projected 7→18/yr by 2055 (HVAC capex compounding) — expect insurance premiums to compound above CPI over the hold.
Questions for the listing agent
- It's been on market 38 days. Have you received any prior offers? Is the seller open to a 3% concession, seller financing, or rate buy-down credit?
- Is there a deadline driving the sale (1031 exchange, divorce, estate, relocation)? That informs how much negotiation room exists.
- Schools are D-rated, which usually means shorter tenancies and higher turnover. Who's the typical renter profile here, and what's been the actual vacancy rate?
- What's the average days-on-market for RENTAL listings here right now (not sales)? A rising rental-DOM trend means longer vacancies and softer asking-rent achievability than the comps imply.
- What's the recent tenant-quality profile in this submarket — average credit score on applications, eviction rate, late-payment / NSF rate, and stable-employment percentage? A property-management company in the area should have these aggregated.
- How much new for-sale + rental construction is in the pipeline within 1–3 miles? Heavy new supply typically softens prices + rents 12–24 months out; constrained supply supports both.
Investment metrics
- 1% rule
- 1.43% ✓
- Cap rate
- 12.82%
- Cash-on-cash
- 23.33%
- DSCR
- 2.04
- GRM
- 5.8
CMA / ARV
- ARV (median comp)
- $179,783
- List price
- $120,000
- Delta
- -33.25%
- Verdict
- UNDERPRICED
- Comps
- 4 within 1.0 mi
Projected returns pro-forma
-3.0% appreciation · 0.33% rent growth · sell at horizon
- IRR
- 13.5%
- Equity multiple
- 1.52×
- Total profit
- $17,598
- Equity at exit
- $17,892
- IRR
- 20.4%
- Equity multiple
- 2.52×
- Total profit
- $51,163
- Equity at exit
- $10,375
Cash invested: $33,600 (down + closing). Projections, not guarantees.
Landlord ↔ Tenant lean methodology
- Overall (STATE)
- 87 Strongly Landlord-Friendly
- State Arizona
- 87 Strongly Landlord-Friendly · R+3
- County
- — inherits STATE
- City
- — inherits STATE
ZIP-level market 86409
- Rents YoY
- 0.3%
- Active inventory
- 647
- Price-to-rent
- 5.8×
Monthly cashflow live
- Estimated rent
- $1,722 high interval (Pro) →
- Mortgage (P&I)
- −$629
- Tax from tax record
- −$28 /mo · $333/yr
- Insurance
- −$50
- HOA
- −$0
- Vacancy / Maint / Mgmt
- −$362
- Net cashflow
- $653
Break-even live
Sensitivity live
| Price | -10% $721 | -5% $687 | +0% $653 | +5% $619 | +10% $585 |
|---|---|---|---|---|---|
| Rent | -10% $517 | -5% $585 | +0% $653 | +5% $721 | +10% $789 |
| Rate | -1.0pp $714 | -0.5pp $684 | base $653 | +0.5pp $622 | +1.0pp $590 |
UW: 25.0% down · 7.5% · 30yr · 1.5% tax · 5.0% vac · 8.0% maint · 8.0% mgmt
Financing live
Cash to close
- Down payment
- $30,000
- Closing costs
- $3,600
- Reserves months
- —
- Total cash needed
- —
Loan-product check · same deal, 3 products live
Conventional
25% down · 7.5% · 30yr
- Down + closing
- —
- Monthly P&I
- —
- Monthly cashflow
- —
- DSCR
- —
- Eligible?
- —
Personal DTI + credit; lowest rate.
DSCR
20% down · 8.5% · 30yr
- Down + closing
- —
- Monthly P&I
- —
- Monthly cashflow
- —
- DSCR
- —
- Eligible?
- —
No personal income docs; deal must DSCR.
Hard money
10% down · 12.0% · 12mo
- Down + closing
- —
- Monthly P&I
- —
- Monthly cashflow
- —
- DSCR
- —
- Eligible?
- —
Short-term bridge; refi at stabilization.
Rent comps 18 comps
| Address | Beds | Baths | Sqft | Rent | $/sqft | DOM | Units | Dist |
|---|---|---|---|---|---|---|---|---|
| 3736 N Roosevelt St Kingman, AZ | 3.0 | 2.0 | 1093 | $1,425 | $1.30 | 45d | 1 | 0.75mi |
| 3838 Meadowbrook Ln Kingman, AZ | 3.0 | 2.0 | 1602 | $1,800 | $1.12 | 23d | 1 | 0.78mi |
| 3838 Heritage Ln Kingman, AZ | 2.0 | 2.0 | 1285 | $1,650 | $1.28 | 45d | 1 | 0.97mi |
| 3695 N Adams St Kingman, AZ | 3.0 | 2.0 | 1331 | $1,600 | $1.20 | 45d | 1 | 0.98mi |
| 3631 N Miller St Kingman, AZ | 3.0 | 2.0 | 1593 | $2,450 | $1.54 | 23d | 1 | 1.02mi |
| 3953 Rex Allen Ct Kingman, AZ | 3.0 | 2.0 | 1440 | $1,750 | $1.22 | 15d | 1 | 1.04mi |
| 3644 N Lomita St Kingman, AZ | 4.0 | 2.0 | 1717 | $1,700 | $0.99 | 45d | 1 | 1.09mi |
| 2244 Dollarhide Dr Kingman, AZ | 3.0 | 2.0 | 1628 | $1,948 | $1.20 | 15d | 1 | 1.09mi |
| 2118 Gene Autry Dr Kingman, AZ | 3.0 | 2.0 | 1494 | $1,850 | $1.24 | 45d | 1 | 1.11mi |
| 3481 Cypress St Kingman, AZ | 3.0 | 2.0 | 1241 | $1,478 | $1.19 | 45d | 1 | 1.24mi |
| 3530 N Lomita St Unit C Kingman, AZ | 2.0 | 2.0 | 920 | $1,400 | $1.52 | 23d | 1 | 1.25mi |
| 3445 N Sage St Kingman, AZ | 3.0 | 2.0 | 1384 | $1,400 | $1.01 | 15d | 1 | 1.32mi |
| 3386 N Jewel St Kingman, AZ | 3.0 | 2.0 | 1128 | $1,500 | $1.33 | 23d | 1 | 1.32mi |
| 2381 E Butler Ave Kingman, AZ | 2.0 | 2.0 | 1152 | $1,200 | $1.04 | 45d | 1 | 1.36mi |
| 3279 N Eagle Rock Rd Kingman, AZ | 3.0 | 2.0 | 1164 | $1,225 | $1.05 | 23d | 1 | 1.38mi |
| 3571 N Moore St Kingman, AZ | 3.0 | 2.0 | 1288 | $2,450 | $1.90 | 45d | 1 | 1.39mi |
| 3595 N Skylark Rd Kingman, AZ | 3.0 | 2.0 | 1138 | $1,475 | $1.30 | 45d | 1 | 1.40mi |
| 3686 Richie Dr Kingman, AZ | 3.0 | 2.0 | 1560 | $1,950 | $1.25 | 15d | 1 | 1.46mi |
Listing history 19 events
-
2026-06-21days on market $120,000 Active 38 DOM
-
2026-06-18days on market $120,000 Active 35 DOM
-
2026-06-17days on market $120,000 Active 34 DOM
-
2026-06-16days on market $120,000 Active 33 DOM
-
2026-06-15days on market $120,000 Active 32 DOM
-
2026-06-14days on market $120,000 Active 30 DOM
-
2026-06-13days on market $120,000 Active 29 DOM
-
2026-06-10days on market $120,000 Active 27 DOM
-
2026-06-09days on market $120,000 Active 26 DOM
-
2026-06-08days on market $120,000 Active 25 DOM
-
2026-06-07days on market $120,000 Active 24 DOM
-
2026-06-05days on market $120,000 Active 21 DOM
-
2026-06-03days on market $120,000 Active 20 DOM
-
2026-06-02days on market $120,000 Active 19 DOM
-
2026-06-01days on market $120,000 Active 18 DOM
-
2026-05-31days on market $120,000 Active 17 DOM
-
2026-05-30days on market $120,000 Active 16 DOM
-
2026-05-14$120,000 Active 396-char remark
-
1992-06-02soldstatus $57,500
ⓘ Source: listings_history table (triggers on properties + properties_extension) + one-shot
backfill from property_details.listing_events for pre-trigger history.
Tax reassessment forecast AZ · Resets to sale price
- Current annual tax
- $333 · $28/mo
- Projected year-2 tax
- $792 · $66/mo
- Expected delta
- +$459/yr (+$38/mo · 137.6%)
ⓘ Screening estimate from a state-policy table — verify with the county assessor before closing.
Climate risk First Street
- Flood 1/10 Low FEMA zone X (unshaded) · 0% chance over 30 yrs
- Wildfire 7/10 Severe
- Heat 6/10 Major 7 d/yr ≥100°F today · 18 d/yr by 30 yrs out
- Wind 1/10 Low
- Air quality 1/10 Low 0 unhealthy d/yr today · 0 by 30 yrs out
Nearby sold comps map
Loading sold comps map…
Walkable amenities ~0.75 mi
Loading nearby amenities…
Taxation est. · year 1
- Rental income
- $20,661
- − Mortgage interest
- −$6,722
- − Property taxes
- −$333
- − Insurance
- −$600
- − Repairs & maintenance
- −$1,653
- − Management
- −$1,653
- − Depreciation
- −$3,491
- Taxable income
- $6,209
- Est. tax owed @ 24.0%
- −$1,490
- After-tax cash flow
- $6,347/yr
For passive investors: Depreciation is non-cash, so a rental often shows a tax loss while cash-flowing — sheltering income. Rental losses are passive: they offset passive income freely, and up to $25,000/yr can offset ordinary (W-2) income if you actively participate and your MAGI is under $100k (phasing out to $0 by $150k); unused losses carry forward. On sale, claimed depreciation is recaptured at up to 25%, and gains may owe capital-gains tax (a 1031 exchange can defer both). Figures are a year-1 estimate at your 24.0% rate — not tax advice; consult a CPA.
Schools (NCES district)
- District
- Kingman Unified School District (79598)
- NCES district ID
- 0400295
- Math proficiency
- 19% ▼ -11.00%
- Reading proficiency
- 24% ▼ -9.00%
- Median HH income
- $36,760
- Composite
- 17.87/100
- National rank
- #9002
- State rank
- #179 of 249 in AZ
Livability — Kingman
- Score
- 79/100
- State rank
- #5
- US rank
- #2014
Category grades
Schools grade is shown separately in the Schools card above.
Census & demographics
- Census place
- Kingman, AZ
- County
- Mohave County · 181,906 people
- City population
- 60,489
- Metro
- Lake Havasu City-Kingman, AZ
- Population (ZIP)
- 30,365
- Household income
- $50,852
- Rent vs Own
- Severe rent burden
- 688.0
Population outlook (Mohave County) Hauer SSP2
- Today (2025)
- 209,184 people
- By 2030
- 209,674 · +0.2%
- By 2040
- 205,897 · -1.6%
- By 2050
- 196,810 · -5.9%
- By 2075
- 169,454 · -19.0%
- By 2100
- 136,630 · -34.7%
Race, ethnicity, and origin ACS 2023
- Neighborhood character
- Predominantly White (76%)
- Race & ethnicity
- White 76% Hispanic / Latino 16% Two or more races 10% Native American 1%
- Hispanic origin (detail)
- Mexican 12%
- Common ancestry
- Lithuanian 3% Slovak 2% Portuguese 2%
- Foreign-born
- 6% · Canada
- Languages at home
- 92% English-only · Spanish 7%
Political lean MEDSL · Mohave
- 2024 margin
- Solid R (+55.8) · D 21.8% · R 77.6%
- 2008→2024 swing
- -22.9pp toward R · 2008: -32.9pp · 2024: -55.8pp
- All cycles
- 2024: R+55.8 2020: R+51.3 2016: R+51.5 2012: R+42.6 2008: R+32.9
Not yet ingested
- Civics
- —
Market trends
- HPI YoY
- ▼ -158.90%
- Current HPI
- 280.1884
- Rent YoY
- ▲ 0.33%
- Metro
- Lake Havasu City-Kingman, AZ
- State GDP YoY
- ▲ 4.54%
- F500 in state
- 20
Industry mix (Fortune 500 HQ in AZ)
| Industry | F500 HQs | Revenue |
|---|---|---|
| Technology | 2 | $13B |
|
||
| Mining / Metals | 1 | $23B |
|
||
| Environmental Services | 1 | $16B |
|
||
| Metals / Steel | 1 | $14B |
|
||
| Technology Distribution | 1 | $9B |
|
||
| Homebuilding | 1 | $8B |
|
||
Price history
+108.7% since first listed2 events — show timeline
- 2026-05-14 Listed $120,000 ARMLS
- 1992-06-02 Sold (Public Records) $57,500 Public Records
Property tax history
-1.3%/yrLatest (2025): $333 · -0.2% YoY. Source: county tax records.
Cash-flow waterfall
monthlySold comps — $/sqft
last 12 mo · ≤1 miLoading sold comps…