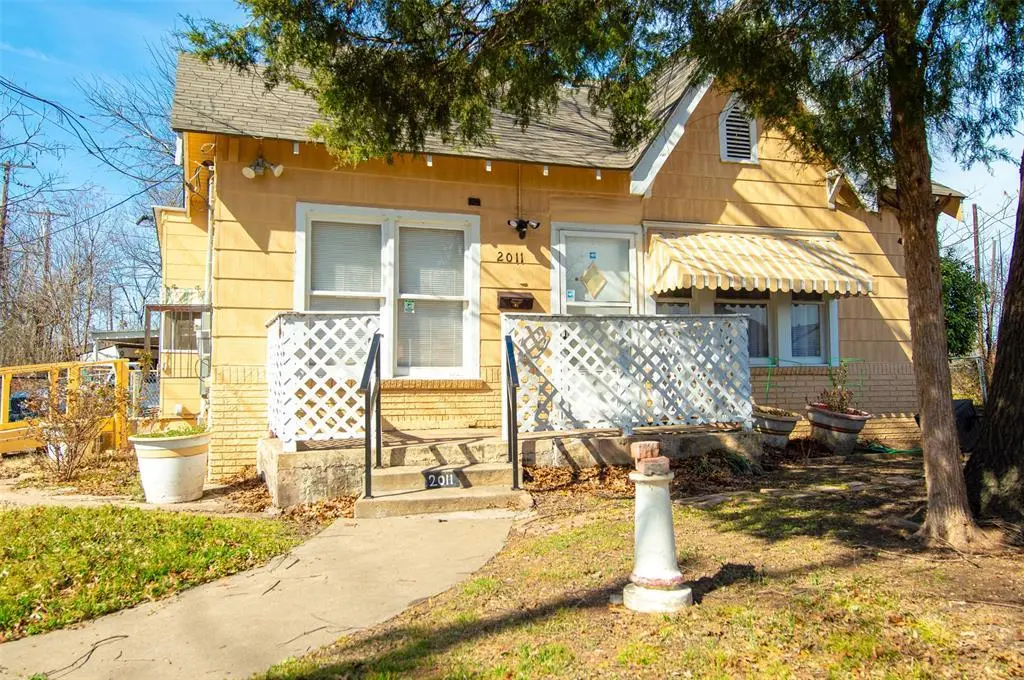
2011 Ramsey Ave · Dallas, TX
Flood risk 1/10 · Minimal
- FEMA flood zone
- X (unshaded)
- Chance of flooding over 30 yrs
- 0.0%
- Est. flood insurance / yr
- $507 – $1,088
Fire risk 1/10 · Minimal
- Est. fire insurance / yr
- $1,222 – $2,270
Heat risk 7/10 · Major
- Hot days now (above 110°F)
- 7 days/yr
- Hot days in 30 yrs
- 24 days/yr
Wind risk 6/10 · Moderate
- Chance of severe wind over 30 yrs
- 27.0%
Air-quality risk 2/10 · Minimal
- Unhealthy air days now
- 1 days/yr
- Unhealthy air days in 30 yrs
- 2 days/yr
Risk factors via First Street. Map © Google.
Why this score? — see what drove the C- grade
The composite is a weighted blend of 9 inputs, each scored 0–100. Each bar is that input's sub-score; the figure is the points it added to the 100-point composite (weight × sub-score).
- ARV discount +15.0/15.0
- Cash flow +14.5/30.0
- 1% rule +6.2/10.0
- DSCR +4.4/10.0
- Livability +4.0/5.0
- Rent growth +3.6/5.0
- Schools +2.8/10.0
- Condition / age +2.5/5.0
- Appreciation +0.0/10.0
$170,000
🖨 Deal sheet 📄 Offer letter ✓ Due diligence
Listing remarks MLS
HUGE GATED LOT .38+ ACRES. HOME FEATURES WOOD LAMINATE FLOORING IN ALL ROOMS EXCEPT 2 BEDROOMS WHICH ARE CARPETED. EAT IN KITCHEN W-PANTRY. NICE WALK-IN SHOWER, BLINDS. CITY ADDED A RAMP FOR EASY ACCESS. 3RD BDRM CURRENTLY USED AS OFFICE. COVERED PORCH ADDED ON SIDE OF HOME, 2 STORAGE UNITS ON PROPERTY. HOME SOLD AS-IS, WHERE IS ONLY! NO SURVEY AVAILABLE UPDATES: FURNACE 2025, GAS HOT WATER HEATER 2025, BREAKER BOX 2024, NEW TOILET 2025, CITY OF DALLAS REPLACED ROOF & ELECTRICAL WIRING 2017 AND SEWER LINE FROM KITCHEN TO STREET 2018.
Key facts
- Gated lot
- Covered porch
- Eat in kitchen
Tags
Neighborhood map
What this means for you Summary
Snapshot
- This is a 3-bed/1.0-bath single-family listed at $170k.
Deal economics
- At list price, monthly cash flow is $36 ($433/yr) — positive.
- The deal already cash-flows at list — no discount required.
- Meets the 1% rule at list price ($2k rent vs $170k).
- Recommended offer: $165k (3.0% below list) — sets the bar for market timing.
- Cap rate 6.5% vs local median 2.3% in Dallas — top-decile yield for the area; either an underpriced asset or a hidden risk that comps aren't pricing in. Stress-test before assuming the spread holds.
Location & tenants
- Location reads 81/100 on livability (#24 in TX, #1,380 nationally) — a professional / high-income tenant draw. Strengths: amenities A+, commute A+, housing A+; Watch: schools C-, crime F.
- Dallas ISD (urban): math 31% / reading 36% proficiency, ranked #559 of 826 in TX (top 68%) — families likely to look elsewhere, expect single-tenant / working-renter base with shorter leases; 83% free/reduced lunch — lower-income household profile, screen leases tightly.
- Market conditions: Rents rising fast (+4.2%/yr); 249 active listings in the ZIP; 15 comparable units currently listed for rent nearby; rentals at typical pace (median 24d on market — plan ~3-4 weeks tenant-placement turnaround); 47% of comp listings sitting > 30 days — soft ceiling on asking rent; lower-income renter base — watch delinquency; 12,577 units permitted in Dallas County in 2024 (6,829 in 5+ unit buildings).
- At $1,898/mo this rent would consume 55% of the median local household income ($41k/yr) (locally 2465% of renters already pay >50% of income on rent) — very limited rent-growth headroom before tenants either downsize or default.
Forward outlook
- Local home prices are declining (-3.0%/yr); year-one equity from $1k of loan paydown is wiped out by about $5k of value loss. Plan a longer hold.
- Dallas County population projected at +35% by 2050 — long-run rental-demand tailwind backs the buy-and-hold thesis.
Negotiation context
- It's been on market 41 days — a 3% lower offer ($165k) is reasonable based on typical stale-listing flexibility.
- 3 sale attempts with the ask held roughly flat each time — persistent listings suggest the price (not the market) is what's stuck; bring a comps-based counter.
Risks & watch-outs
- Watch-outs: property tax is 3.5% of price; built in 1931 — expect roof / HVAC / electrical / plumbing capex.
- Climate carrying-cost: major wind risk, 27% chance of damaging wind over 30y; extreme-heat days projected 7→24/yr by 2055 (HVAC capex compounding) — expect insurance premiums to compound above CPI over the hold.
Questions for the listing agent
- It's been on market 41 days. Have you received any prior offers? Is the seller open to a 3% concession, seller financing, or rate buy-down credit?
- Built in 1931 — when were the roof, HVAC, electrical panel, plumbing, and water heater last replaced?
- Property tax is high relative to price — has the assessment been appealed recently, and will the sale trigger a re-assessment?
- Is there a deadline driving the sale (1031 exchange, divorce, estate, relocation)? That informs how much negotiation room exists.
- Crime grade is F in this area — have there been break-ins, vandalism, or insurance claims at this property in the last 3 years? What carrier currently insures it and at what premium?
- What's the average days-on-market for RENTAL listings here right now (not sales)? A rising rental-DOM trend means longer vacancies and softer asking-rent achievability than the comps imply.
- What's the recent tenant-quality profile in this submarket — average credit score on applications, eviction rate, late-payment / NSF rate, and stable-employment percentage? A property-management company in the area should have these aggregated.
- How much new for-sale + rental construction is in the pipeline within 1–3 miles? Heavy new supply typically softens prices + rents 12–24 months out; constrained supply supports both.
Investment metrics
- 1% rule
- 1.12% ✓
- Cap rate
- 6.55%
- Cash-on-cash
- 0.91%
- DSCR
- 1.04
- GRM
- 7.5
CMA / ARV
- ARV (median comp)
- $230,750
- List price
- $170,000
- Delta
- -26.33%
- Verdict
- UNDERPRICED
- Comps
- 20 within 1.0 mi
Show comp detail 12 sales within ~0.75 mi
| Address | Dist | Beds/Ba | Sqft | Sold | Price | $/sf | Match |
|---|---|---|---|---|---|---|---|
| 1822 S Marsalis Ave | 0.41mi | 2/1.0 (-1) | 960 (-2%) | 3mo | $99,000 | $103 | 71 |
| 2519 Michigan Ave | 0.48mi | 3/2.0 | 978 (+0%) | 12mo | $169,990 | $174 | 63 |
| 1427 Arborvitae Ave | 0.46mi | 2/1.0 (-1) | 988 (+1%) | 12mo | $231,000 | $234 | 62 |
| 139 W Grover C Washington Ave | 0.45mi | 2/1.0 (-1) | 1,028 (+5%) | 7mo | $150,000 | $146 | 59 |
| 322 Beckleywood Blvd | 0.42mi | 2/2.0 (-1) | 1,040 (+7%) | 4mo | $300,000 | $288 | 57 |
| 2420 Seevers Ave | 0.36mi | 3/2.0 | 1,118 (+14%) | 1mo | $240,000 | $215 | 54 |
| 611 E Woodin Blvd | 0.32mi | 2/1.0 (-1) | 1,072 (+10%) | 15mo | $232,500 | $217 | 51 |
| 2634 Seevers Ave | 0.55mi | 3/2.0 | 1,000 (+2%) | 19mo | $225,000 | $225 | 50 |
| 206 Beckleywood Blvd | 0.31mi | 2/1.0 (-1) | 1,111 (+14%) | 12mo | $195,000 | $176 | 48 |
| 2601 Ramsey Ave | 0.47mi | 2/1.0 (-1) | 864 (-12%) | 9mo | $115,000 | $133 | 46 |
| 133 W Hobson Ave | 0.61mi | 2/1.0 (-1) | 834 (-14%) | 3mo | $184,000 | $221 | 40 |
| 2423 Maryland Ave | 0.55mi | 2/2.0 (-1) | 1,102 (+13%) | 16mo | $249,000 | $226 | 30 |
Match score weights: distance 35% · size 25% · config 20% · recency 20%. Top-matched comps best support the ARV.
Projected returns pro-forma
-3.0% appreciation · 4.2% rent growth · sell at horizon
- IRR
- -13.1%
- Equity multiple
- 0.52×
- Total profit
- $-22,725
- Equity at exit
- $25,348
- IRR
- -1.8%
- Equity multiple
- 0.87×
- Total profit
- $-6,245
- Equity at exit
- $14,698
Cash invested: $47,600 (down + closing). Projections, not guarantees.
Landlord ↔ Tenant lean methodology
- Overall (STATE)
- 87 Strongly Landlord-Friendly
- State Texas
- 87 Strongly Landlord-Friendly · R+5
- County
- — inherits STATE
- City
- — inherits STATE
ZIP-level market 75216
- Home prices YoY
- -29.7%
- Rents YoY
- 4.2%
- Active inventory
- 249
- Price-to-rent
- 7.5×
Monthly cashflow live
- Estimated rent
- $1,898 high interval (Pro) →
- Mortgage (P&I)
- −$891
- Tax from tax record
- −$501 /mo · $6,008/yr
- Insurance
- −$71
- HOA
- −$0
- Vacancy / Maint / Mgmt
- −$398
- Net cashflow
- $36
Break-even live
UW: 25.0% down · 7.5% · 30yr · 1.5% tax · 5.0% vac · 8.0% maint · 8.0% mgmt
Financing live
Cash to close
- Down payment
- $42,500
- Closing costs
- $5,100
- Reserves months
- —
- Total cash needed
- —
Loan-product check · same deal, 3 products live
Conventional
25% down · 7.5% · 30yr
- Down + closing
- —
- Monthly P&I
- —
- Monthly cashflow
- —
- DSCR
- —
- Eligible?
- —
Personal DTI + credit; lowest rate.
DSCR
20% down · 8.5% · 30yr
- Down + closing
- —
- Monthly P&I
- —
- Monthly cashflow
- —
- DSCR
- —
- Eligible?
- —
No personal income docs; deal must DSCR.
Hard money
10% down · 12.0% · 12mo
- Down + closing
- —
- Monthly P&I
- —
- Monthly cashflow
- —
- DSCR
- —
- Eligible?
- —
Short-term bridge; refi at stabilization.
Rent comps 15 comps
| Address | Beds | Baths | Sqft | Rent | $/sqft | DOM | Units | Dist |
|---|---|---|---|---|---|---|---|---|
| 1715 Ramsey Ave Dallas, TX | 2.0 | 1.0 | 1092 | $1,750 | $1.60 | 24d | 1 | 0.22mi |
| 2406 S Marsalis Ave Dallas, TX | 2.0 | 1.0 | 956 | $1,700 | $1.78 | 43d | 1 | 0.53mi |
| 1805 S Zang Blvd Dallas, TX | 1.0–3.0 | 1.0–2.0 | 940 | $1,701 | $1.81 | 7d | 1 | 0.58mi |
| 2634 Seevers Ave Dallas, TX | 3.0 | 2.0 | 1000 | $1,800 | $1.80 | 24d | 1 | 0.58mi |
| 2423 Maryland Ave Dallas, TX | 2.0 | 2.0 | 1102 | $2,350 | $2.13 | 43d | 1 | 0.59mi |
| 1310 Michigan Ave Dallas, TX | 3.0 | 2.0 | 972 | $1,900 | $1.95 | 24d | 1 | 0.65mi |
| 2454 S Zang Blvd Dallas, TX | 1.0–2.0 | 1.0 | 750 | $1,400 | $1.87 | 3d | 14 | 0.66mi |
| 2311 Anzio Dr Dallas, TX | 2.0 | 1.0 | 814 | $1,350 | $1.66 | 3d | 22 | 0.67mi |
| 1018 E Waco Ave Dallas, TX | 3.0 | 1.0 | 1112 | $1,395 | $1.25 | 44d | 1 | 1.06mi |
| 850 S Ewing Ave Dallas, TX | 1.0–2.0 | 1.0–2.5 | 1086 | $2,450 | $2.25 | 3d | 2 | 1.21mi |
| 1028 Claude St Dallas, TX | 2.0 | 1.0 | 988 | $1,800 | $1.82 | 24d | 1 | 1.32mi |
| 3212 S Llewellyn Ave Dallas, TX | 2.0 | 2.0 | 1040 | $1,750 | $1.68 | 43d | 1 | 1.38mi |
| 517 S Vernon Ave Dallas, TX | 2.0 | 1.0 | 896 | $1,750 | $1.95 | 43d | 1 | 1.44mi |
| 405 S Ewing Ave Unit 406 Dallas, TX | 2.0 | 2.0 | 1102 | $2,550 | $2.31 | 43d | 1 | 1.45mi |
| 2012 Tennessee Ave Dallas, TX | 2.0 | 2.0 | 1033 | $2,050 | $1.98 | 43d | 1 | 1.48mi |
Listing history 11 events
-
2026-05-13historical Active Option Contract 544-char remark
Show marketing remark (544 chars)
HUGE GATED LOT .38+ ACRES. HOME FEATURES WOOD LAMINATE FLOORING IN ALL ROOMS EXCEPT 2 BEDROOMS WHICH ARE CARPETED. EAT IN KITCHEN W-PANTRY. NICE WALK-IN SHOWER, BLINDS. CITY ADDED A RAMP FOR EASY ACCESS. 3RD BDRM CURRENTLY USED AS OFFICE. COVERED PORCH ADDED ON SIDE OF HOME, 2 STORAGE UNITS ON PROPERTY. HOME SOLD AS-IS, WHERE IS ONLY! NO SURVEY AVAILABLE UPDATES: FURNACE 2025, GAS HOT WATER HEATER 2025, BREAKER BOX 2024, NEW TOILET 2025, CITY OF DALLAS REPLACED ROOF & ELECTRICAL WIRING 2017 AND SEWER LINE FROM KITCHEN TO STREET 2018.
-
2026-04-13$170,000 Active 544-char remark
Show marketing remark (544 chars)
HUGE GATED LOT .38+ ACRES. HOME FEATURES WOOD LAMINATE FLOORING IN ALL ROOMS EXCEPT 2 BEDROOMS WHICH ARE CARPETED. EAT IN KITCHEN W-PANTRY. NICE WALK-IN SHOWER, BLINDS. CITY ADDED A RAMP FOR EASY ACCESS. 3RD BDRM CURRENTLY USED AS OFFICE. COVERED PORCH ADDED ON SIDE OF HOME, 2 STORAGE UNITS ON PROPERTY. HOME SOLD AS-IS, WHERE IS ONLY! NO SURVEY AVAILABLE UPDATES: FURNACE 2025, GAS HOT WATER HEATER 2025, BREAKER BOX 2024, NEW TOILET 2025, CITY OF DALLAS REPLACED ROOF & ELECTRICAL WIRING 2017 AND SEWER LINE FROM KITCHEN TO STREET 2018.
-
2026-03-31historical
-
2026-02-11price $187,000
-
2025-12-05status Active
-
2025-11-06status Pending
-
2025-10-23$189,000 Active
-
2003-09-22soldstatus
-
2003-09-22soldstatus
-
1999-09-20soldstatus
-
1999-09-20soldstatus
ⓘ Source: listings_history table (triggers on properties + properties_extension) + one-shot
backfill from property_details.listing_events for pre-trigger history.
Tax reassessment forecast TX · Resets to sale price
- Current annual tax
- $6,008 · $501/mo
- Projected year-2 tax
- $6,008 · $501/mo
- Expected delta
- $0/yr ($0/mo · 0.0%)
ⓘ Screening estimate from a state-policy table — verify with the county assessor before closing.
Climate risk First Street
- Flood 1/10 Low FEMA zone X (unshaded) · 0% chance over 30 yrs
- Wildfire 1/10 Low
- Heat 7/10 Severe 7 d/yr ≥110°F today · 24 d/yr by 30 yrs out
- Wind 6/10 Major 27% chance of damaging wind over 30 yrs
- Air quality 2/10 Low 1 unhealthy d/yr today · 2 by 30 yrs out
Nearby sold comps map
Loading sold comps map…
Walkable amenities ~0.75 mi
Loading nearby amenities…
Taxation est. · year 1
- Rental income
- $22,771
- − Mortgage interest
- −$9,523
- − Property taxes
- −$6,008
- − Insurance
- −$850
- − Repairs & maintenance
- −$1,822
- − Management
- −$1,822
- − Depreciation
- −$4,945
- Taxable loss
- −$2,199
- Est. tax savings @ 24.0%
- +$528
- After-tax cash flow
- $961/yr
For passive investors: Depreciation is non-cash, so a rental often shows a tax loss while cash-flowing — sheltering income. Rental losses are passive: they offset passive income freely, and up to $25,000/yr can offset ordinary (W-2) income if you actively participate and your MAGI is under $100k (phasing out to $0 by $150k); unused losses carry forward. On sale, claimed depreciation is recaptured at up to 25%, and gains may owe capital-gains tax (a 1031 exchange can defer both). Figures are a year-1 estimate at your 24.0% rate — not tax advice; consult a CPA.
Schools (NCES district)
- District
- Dallas ISD
- NCES district ID
- 4816230
- Math proficiency
- 31% ▼ -16.00%
- Reading proficiency
- 36% ▼ -4.00%
- Median HH income
- $42,881
- Composite
- 28.41/100
- National rank
- #6763
- State rank
- #559 of 826 in TX
Livability — Dallas
- Score
- 81/100
- State rank
- #24
- US rank
- #1380
Category grades
Schools grade is shown separately in the Schools card above.
Census & demographics
- Census place
- Dallas, TX
- County
- Dallas County · 2,612,404 people
- City population
- 1,168,437
- Metro
- Dallas-Fort Worth-Arlington, TX
- Population (ZIP)
- 55,894
- Household income
- $41,386
- Rent vs Own
- Severe rent burden
- 2465.0
Population outlook (Dallas County) Hauer SSP2
- Today (2025)
- 2,979,839 people
- By 2030
- 3,191,823 · +7.1%
- By 2040
- 3,619,611 · +21.5%
- By 2050
- 4,026,915 · +35.1%
- By 2075
- 4,957,073 · +66.4%
- By 2100
- 5,508,725 · +84.9%
Race, ethnicity, and origin ACS 2023
- Neighborhood character
- Majority Black (51%)
- Race & ethnicity
- Black 51% Hispanic / Latino 44% Two or more races 14% White 3%
- Hispanic origin (detail)
- Mexican 40%
- Common ancestry
- Hispanic 1%
- Foreign-born
- 17% · Canada
- Languages at home
- 62% English-only · Spanish 37%
Political lean MEDSL · Dallas
- 2024 margin
- Strong D (+22.2) · D 60.2% · R 38.0% · Other 1.8%
- 2008→2024 swing
- +6.9pp toward D · 2008: 15.3pp · 2024: 22.2pp
- All cycles
- 2024: D+22.2 2020: D+31.6 2016: D+26.2 2012: D+15.4 2008: D+15.3
Not yet ingested
- Civics
- —
Market trends
- HPI YoY
- ▼ -126.35%
- Current HPI
- 299.1825
- Rent YoY
- ▲ 4.20%
- Metro
- Dallas-Fort Worth-Arlington, TX
- State GDP YoY
- ▲ 3.95%
- F500 in state
- 110
Industry mix (Fortune 500 HQ in TX)
| Industry | F500 HQs | Revenue |
|---|---|---|
| Energy | 16 | $1,198B |
|
||
| Technology | 5 | $198B |
|
||
| Engineering / Construction | 4 | $72B |
|
||
| Energy Services | 3 | $60B |
|
||
| Utilities | 3 | $41B |
|
||
| Healthcare | 2 | $330B |
|
||
Price history
-10.1% since first listed11 events — show timeline
- 2026-05-13 Contingent — NTREIS
- 2026-04-13 Listed $170,000 NTREIS
- 2026-03-31 Listing Removed — NTREIS
- 2026-02-11 Price Changed $187,000 NTREIS
- 2025-12-05 Relisted — NTREIS
- 2025-11-06 Pending — NTREIS
- 2025-10-23 Listed $189,000 NTREIS
- 2003-09-22 Sold (Public Records) — Public Records
- 2003-09-22 Sold (Public Records) — Public Records
- 1999-09-20 Sold (Public Records) — Public Records
- 1999-09-20 Sold (Public Records) — Public Records
Property tax history
+10.9%/yrLatest (2025): $6,008 · +12.4% YoY. Source: county tax records.
Cash-flow waterfall
monthlySold comps — $/sqft
last 12 mo · ≤1 miLoading sold comps…