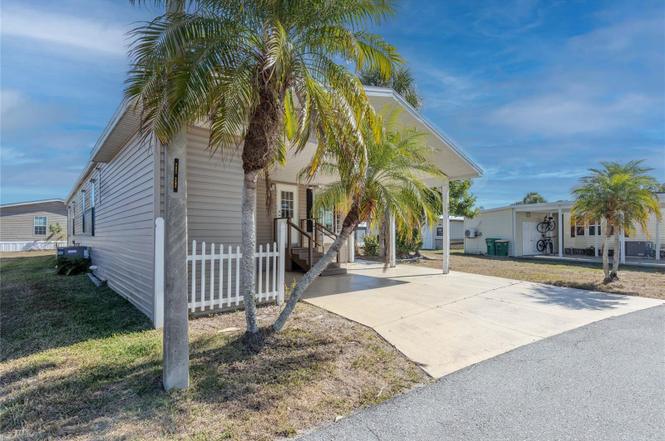
2100 Kings Highway Ln #1064 · Port Charlotte, FL
Flood risk 4/10 · Minor
- FEMA flood zone
- X (unshaded)
- Chance of flooding over 30 yrs
- 0.22%
- Est. flood insurance / yr
- $507 – $1,088
Fire risk 2/10 · Minimal
- Est. fire insurance / yr
- $947 – $1,759
Heat risk 10/10 · Severe
- Hot days now (above 107°F)
- 7 days/yr
- Hot days in 30 yrs
- 28 days/yr
Wind risk 10/10 · Severe
- Chance of severe wind over 30 yrs
- 99.0%
Air-quality risk 3/10 · Minor
- Unhealthy air days now
- 2 days/yr
- Unhealthy air days in 30 yrs
- 2 days/yr
Risk factors via First Street. Map © Google.
Why this score? — see what drove the C+ grade
The composite is a weighted blend of 9 inputs, each scored 0–100. Each bar is that input's sub-score; the figure is the points it added to the 100-point composite (weight × sub-score).
- Cash flow +21.5/30.0
- ARV discount +15.0/15.0
- 1% rule +9.0/10.0
- DSCR +6.9/10.0
- Schools +4.6/10.0
- Livability +3.2/5.0
- Condition / age +2.5/5.0
- Rent growth +1.5/5.0
- Appreciation +0.0/10.0
$147,500
🖨 Deal sheet (PDF) 📄 Offer letter ✓ Due diligence
Listing remarks
Seller is motivated and will consider reasonable offers. Welcome to Maple Leaf Golf & Country Club, where the lifestyle truly is second to none. This inviting home offers 2 bedrooms and 2 bathrooms, featuring a spacious kitchen with a large dining area, a comfortable family room, and an oversized living room ideal for relaxing or entertaining. Owners had the roof replaced in late 2025. The kitchen is designed for modern convenience with newer soft-close doors and drawers, along with a large cabinet-style pantry complete with built-in drawers. The primary bedroom is generously sized, offering an ensuite bathroom and two separate closets for ample storage. Enjoy outdoor living from th
Key facts
- Spacious kitchen
- Four swimming pools
- Large covered deck
Tags
Property features AI
Finance
- Other: Buyer approval required for community
- Financial info: Partially furnished; Lease restrictions apply; Total annual fees reported $4,740
- HOA & community: Has HOA (monthly fee $395); Association requires approval; Association amenities include clubhouse, fitness center, pool, spa/hot tub, sauna, tennis courts, pickleball and shuffleboard courts, golf course/recreation, maintenance, security, laundry, and trash; Community features include clubhouse, community mailbox, gated access, irrigation with reclaimed water, and golf; golf carts allowed; no truck/RV/motorcycle parking; senior community; cats allowed
Exterior
- Parking: Carport (1 space)
- Security: Gated community; Community security (included in association)
- Utilities: Public water; Public sewer; Electricity connected; Fiber optics available
- Home design: Manufactured home; Single-story; Faces west; Residential property in MHP zoning
- Construction: Vinyl siding; Shingle roof; Crawlspace foundation; Built area approximately 1458 square feet
- Exterior features: Covered porch; Porch; Shed(s); Level lot; Asphalt road
Interior
- Kitchen: Dishwasher; Disposal; Microwave; Range
- Bedrooms: 2 bedrooms
- Flooring: Carpet; Linoleum
- Bathrooms: 2 full bathrooms
- Heating & cooling: Heat pump; Central air
- Interior features: Ceiling fans; Thermostat; Vaulted ceilings; Aluminum-framed windows; Storage
- Laundry & utility: Washer; Dryer; Laundry closet
Neighborhood map
What this means for you Summary
Snapshot
- This is a 2-bed/2.0-bath single-family listed at $148k.
Deal economics
- At list price, monthly cash flow is $222 ($3k/yr) — positive.
- The deal already cash-flows at list — no discount required.
- Meets the 1% rule at list price ($2k rent vs $148k).
- Recommended offer: $130k (12.0% below list) — sets the bar for market timing.
- Cap rate 8.1% vs local median 4.4% in Port Charlotte — top-decile yield for the area; either an underpriced asset or a hidden risk that comps aren't pricing in. Stress-test before assuming the spread holds.
Location & tenants
- Location reads 65/100 on livability (#655 in FL) — a middle-class / working-renter tenant base. Strengths: cost of living A+, housing A+; Watch: schools D+, employment D, amenities F.
- Charlotte (suburban): math 54% / reading 54% proficiency, ranked #22 of 73 in FL (top 30%) — acceptable for families but not a draw, mixed tenant base, ~2y average lease.
- Market conditions: Rents falling (-4.0%/yr); 600 active listings in the ZIP; 21 comparable units currently listed for rent nearby; rentals at typical pace (median 22d on market — plan ~3-4 weeks tenant-placement turnaround); 4,585 units permitted in Charlotte County in 2024 (703 in 5+ unit buildings).
- This rent runs 39% of the median local income ($64k/yr) — at the standard rent-burdened threshold; future hikes will face affordability resistance.
Forward outlook
- Local home prices are declining (-3.0%/yr); year-one equity from $1k of loan paydown is wiped out by about $4k of value loss. Plan a longer hold.
- Charlotte County population projected at +24% by 2050 — long-run rental-demand tailwind backs the buy-and-hold thesis.
Negotiation context
- It's been on market 132 days — a 12% lower offer ($130k) is reasonable based on typical stale-listing flexibility.
Risks & watch-outs
- Climate carrying-cost: severe wind risk, 99% chance of damaging wind over 30y; extreme-heat days projected 7→28/yr by 2055 (HVAC capex compounding) — expect insurance premiums to compound above CPI over the hold.
Questions for the listing agent
- It's been on market 132 days. Have you received any prior offers? Is the seller open to a 12% concession, seller financing, or rate buy-down credit?
- What does the HOA fee cover, when was the last increase, and are there any pending special assessments or reserve-fund shortfalls?
- Why hasn't it sold? Are there any deal-killer items the seller is aware of (foundation, flood, title, zoning, code violations)?
- Is there a deadline driving the sale (1031 exchange, divorce, estate, relocation)? That informs how much negotiation room exists.
- Schools are D-rated, which usually means shorter tenancies and higher turnover. Who's the typical renter profile here, and what's been the actual vacancy rate?
- What's the average days-on-market for RENTAL listings here right now (not sales)? A rising rental-DOM trend means longer vacancies and softer asking-rent achievability than the comps imply.
- What's the recent tenant-quality profile in this submarket — average credit score on applications, eviction rate, late-payment / NSF rate, and stable-employment percentage? A property-management company in the area should have these aggregated.
- How much new for-sale + rental construction is in the pipeline within 1–3 miles? Heavy new supply typically softens prices + rents 12–24 months out; constrained supply supports both.
Investment metrics
- 1% rule
- 1.40% ✓
- Cap rate
- 8.10%
- Cash-on-cash
- 6.45%
- DSCR
- 1.29
- GRM
- 5.9
CMA / ARV
- ARV (on-the-fly)
- $291,600
- Comps found
- 12
Show comp detail 12 sales within ~0.75 mi
| Address | Dist | Beds/Ba | Sqft | Sold | Price | $/sf | Match |
|---|---|---|---|---|---|---|---|
| 1725 Piccadilly Cir | 0.45mi | 2/2.0 | 1,395 (-4%) | 4mo | $285,000 | $204 | 69 |
| 24208 Buckingham Way | 0.38mi | 2/2.0 | 1,382 (-5%) | 8mo | $255,000 | $185 | 66 |
| 1391 Blaisdell St | 0.39mi | 3/2.0 (+1) | 1,540 (+6%) | 1mo | $321,000 | $208 | 66 |
| 1809 Knights Bridge Trl | 0.52mi | 2/2.0 | 1,509 (+4%) | 6mo | $255,000 | $169 | 64 |
| 1880 Knights Bridge Trl | 0.50mi | 2/2.0 | 1,387 (-5%) | 6mo | $275,000 | $198 | 64 |
| 24827 Buckingham Way | 0.58mi | 2/2.0 | 1,443 (-1%) | 10mo | $305,000 | $211 | 63 |
| 1728 Piccadilly Cir | 0.43mi | 2/2.0 | 1,397 (-4%) | 14mo | $280,000 | $200 | 62 |
| 23472 Mcnally Ave | 0.30mi | 3/2.0 (+1) | 1,620 (+11%) | 2mo | $305,000 | $188 | 61 |
| 24779 Buckingham Way | 0.66mi | 2/2.0 | 1,443 (-1%) | 11mo | $314,000 | $218 | 59 |
| 24787 Buckingham Way | 0.64mi | 2/2.0 | 1,395 (-4%) | 6mo | $275,000 | $197 | 58 |
| 23296 Goldcoast Ave | 0.64mi | 3/2.0 (+1) | 1,620 (+11%) | 1mo | $275,000 | $170 | 46 |
| 24304 Westgate Blvd | 0.63mi | 3/2.0 (+1) | 1,540 (+6%) | 15mo | $368,000 | $239 | 44 |
Match score weights: distance 35% · size 25% · config 20% · recency 20%. Top-matched comps best support the ARV.
Projected returns pro-forma
-3.0% appreciation · 0.0% rent growth · sell at horizon
- IRR
- -10.8%
- Equity multiple
- 0.62×
- Total profit
- $-15,558
- Equity at exit
- $21,993
- IRR
- -8.3%
- Equity multiple
- 0.57×
- Total profit
- $-17,687
- Equity at exit
- $12,753
Cash invested: $41,300 (down + closing). Projections, not guarantees.
Landlord ↔ Tenant lean methodology
- Overall (STATE)
- 87 Strongly Landlord-Friendly
- State Florida
- 87 Strongly Landlord-Friendly · R+3
- County
- — inherits STATE
- City
- — inherits STATE
ZIP-level market 33980
- Home prices YoY
- -5.0%
- Rents YoY
- -4.0%
- Active inventory
- 600
- Price-to-rent
- 5.9×
Monthly cashflow live
- Estimated rent
- $2,071 high interval (Pro) →
- Mortgage (P&I)
- −$774
- Tax est. 1.5%
- −$184 /mo · $2,212/yr
- Insurance
- −$61
- HOA
- −$395
- Vacancy / Maint / Mgmt
- −$435
- Net cashflow
- $222
Break-even live
Sensitivity live
| Price | -10% $324 | -5% $273 | +0% $222 | +5% $171 | +10% $120 |
|---|---|---|---|---|---|
| Rent | -10% $58 | -5% $140 | +0% $222 | +5% $304 | +10% $386 |
| Rate | -1.0pp $296 | -0.5pp $260 | base $222 | +0.5pp $184 | +1.0pp $145 |
UW: 25.0% down · 7.5% · 30yr · 1.5% tax · 5.0% vac · 8.0% maint · 8.0% mgmt
Financing live
Cash to close
- Down payment
- $36,875
- Closing costs
- $4,425
- Reserves months
- —
- Total cash needed
- —
Loan-product check · same deal, 3 products live
Conventional
25% down · 7.5% · 30yr
- Down + closing
- —
- Monthly P&I
- —
- Monthly cashflow
- —
- DSCR
- —
- Eligible?
- —
Personal DTI + credit; lowest rate.
DSCR
20% down · 8.5% · 30yr
- Down + closing
- —
- Monthly P&I
- —
- Monthly cashflow
- —
- DSCR
- —
- Eligible?
- —
No personal income docs; deal must DSCR.
Hard money
10% down · 12.0% · 12mo
- Down + closing
- —
- Monthly P&I
- —
- Monthly cashflow
- —
- DSCR
- —
- Eligible?
- —
Short-term bridge; refi at stabilization.
Rent comps 21 comps
| Address | Beds | Baths | Sqft | Rent | $/sqft | DOM | Units | Dist |
|---|---|---|---|---|---|---|---|---|
| 1999 Kings Hwy Port Charlotte, FL | 2.0 | 1.0–2.0 | 906 | $1,800 | $1.99 | 22d | 2 | 0.24mi |
| 1829 Knights Bridge Trl Punta Gorda, FL | 2.0 | 2.0 | 1509 | $2,000 | $1.33 | 22d | 1 | 0.52mi |
| 1200 Loveland Blvd Punta Gorda, FL | 1.0–3.0 | 1.0–2.0 | 1151 | $2,030 | $1.76 | 14d | 276 | 0.60mi |
| 1867 Nottingham Trl Punta Gorda, FL | 3.0 | 2.0 | 1646 | $2,000 | $1.22 | 22d | 1 | 0.63mi |
| 1670 Royal Ct Punta Gorda, FL | 2.0 | 2.0 | 1393 | $2,400 | $1.72 | 22d | 1 | 0.64mi |
| 24401 Manchester Trl Punta Gorda, FL | 2.0 | 2.0 | 1382 | $2,000 | $1.45 | 22d | 1 | 0.67mi |
| 1717 Sunderland Dr Punta Gorda, FL | 2.0 | 2.0 | 1402 | $2,800 | $2.00 | 22d | 1 | 0.78mi |
| 24472 Manchester Trl Punta Gorda, FL | 2.0 | 2.0 | 1373 | $1,900 | $1.38 | 22d | 1 | 0.82mi |
| 1314 Beacon Dr Port Charlotte, FL | 3.0 | 2.0 | 1783 | $2,500 | $1.40 | 22d | 1 | 1.03mi |
| 1471 Capricorn Blvd Unit A Punta Gorda, FL | 3.0 | 2.0 | 1450 | $1,900 | $1.31 | 14d | 1 | 1.07mi |
| 24484 Zephyr Ct Unit 24484 Punta Gorda, FL | 3.0 | 2.0 | 1255 | $1,695 | $1.35 | 22d | 1 | 1.08mi |
| 1499 Capricorn Blvd Port Charlotte, FL | 2.0 | 2.0 | 980 | $1,495 | $1.53 | 22d | 1 | 1.09mi |
| 1516 Abel St Port Charlotte, FL | 3.0 | 2.0 | 1874 | $2,200 | $1.17 | 22d | 1 | 1.10mi |
| 23184 Glory Ave Port Charlotte, FL | 2.0 | 2.0 | 1370 | $2,000 | $1.46 | 22d | 1 | 1.11mi |
| 24151 Beatrix Blvd Port Charlotte, FL | 3.0 | 1.0–2.0 | 990 | $1,955 | $1.97 | 14d | 28 | 1.15mi |
| 25225 Rampart Blvd Punta Gorda, FL | 2.0 | 2.0 | 886 | $1,925 | $2.17 | 22d | 5 | 1.28mi |
| 2421 Ivanhoe St Port Charlotte, FL | 2.0 | 2.0 | 1396 | $3,300 | $2.36 | 14d | 1 | 1.31mi |
| 24145 Green Heron Dr Port Charlotte, FL | 2.0 | 2.0 | 1512 | $1,900 | $1.26 | 22d | 1 | 1.34mi |
| 2451 Aquilos Ct Port Charlotte, FL | 2.0 | 2.0 | 1307 | $2,000 | $1.53 | 14d | 1 | 1.42mi |
| 1636 Hayworth Rd Port Charlotte, FL | 2.0 | 2.0 | 884 | $1,300 | $1.47 | 22d | 1 | 1.47mi |
| 1195 Desmond St Port Charlotte, FL | 3.0 | 2.0 | 1388 | $1,716 | $1.24 | 22d | 1 | 1.48mi |
HOA detail
- Monthly dues
- $395 · $4,740/yr
Listing history 17 events
-
2026-06-18days on market $147,500 Active 132 DOM
-
2026-06-17days on market $147,500 Active 131 DOM
-
2026-06-16days on market $147,500 Active 130 DOM
-
2026-06-15days on market $147,500 Active 129 DOM
-
2026-06-14days on market $147,500 Active 127 DOM
-
2026-06-13days on market $147,500 Active 126 DOM
-
2026-06-10days on market $147,500 Active 124 DOM
-
2026-06-09days on market $147,500 Active 123 DOM
-
2026-06-08days on market $147,500 Active 122 DOM
-
2026-06-07days on market $147,500 Active 121 DOM
-
2026-06-05days on market $147,500 Active 118 DOM
-
2026-06-03days on market $147,500 Active 117 DOM
-
2026-06-02days on market $147,500 Active 116 DOM
-
2026-06-01days on market $147,500 Active 115 DOM
-
2026-05-31days on market $147,500 Active 114 DOM
-
2026-05-30days on market $147,500 Active 113 DOM
-
2026-02-06$147,500 Active
ⓘ Source: listings_history table (triggers on properties + properties_extension) + one-shot
backfill from property_details.listing_events for pre-trigger history.
Climate risk First Street
- Flood 4/10 Moderate FEMA zone X (unshaded) · 22% chance over 30 yrs
- Wildfire 2/10 Low
- Heat 10/10 Extreme 7 d/yr ≥107°F today · 28 d/yr by 30 yrs out
- Wind 10/10 Extreme 99% chance of damaging wind over 30 yrs
- Air quality 3/10 Moderate 2 unhealthy d/yr today · 2 by 30 yrs out
Nearby sold comps map
Loading sold comps map…
Walkable amenities ~0.75 mi
Loading nearby amenities…
Taxation est. · year 1
- Rental income
- $24,856
- − Mortgage interest
- −$8,262
- − Property taxes
- −$2,212
- − Insurance
- −$738
- − Repairs & maintenance
- −$1,988
- − Management
- −$1,988
- − HOA
- −$4,740
- − Depreciation
- −$4,291
- Taxable income
- $636
- Est. tax owed @ 24.0%
- −$153
- After-tax cash flow
- $2,511/yr
For passive investors: Depreciation is non-cash, so a rental often shows a tax loss while cash-flowing — sheltering income. Rental losses are passive: they offset passive income freely, and up to $25,000/yr can offset ordinary (W-2) income if you actively participate and your MAGI is under $100k (phasing out to $0 by $150k); unused losses carry forward. On sale, claimed depreciation is recaptured at up to 25%, and gains may owe capital-gains tax (a 1031 exchange can defer both). Figures are a year-1 estimate at your 24.0% rate — not tax advice; consult a CPA.
Schools (NCES district)
- District
- Charlotte
- NCES district ID
- 1200240
- Math proficiency
- 54% ▼ -6.00%
- Reading proficiency
- 54% ▼ -1.00%
- Median HH income
- $44,864
- Composite
- 45.62/100
- National rank
- #2586
- State rank
- #22 of 73 in FL
Livability — Port Charlotte
- Score
- 65/100
- State rank
- #655
- US rank
- #13081
Category grades
Schools grade is shown separately in the Schools card above.
Census & demographics
- County
- Charlotte County · 196,994 people
- City population
- 102,180
- Metro
- Punta Gorda, FL
- Population (ZIP)
- 13,120
- Household income
- $63,591
- Rent vs Own
- Severe rent burden
- 612.0
Population outlook (Charlotte County) Hauer SSP2
- Today (2025)
- 198,646 people
- By 2030
- 210,507 · +6.0%
- By 2040
- 230,857 · +16.2%
- By 2050
- 247,148 · +24.4%
- By 2075
- 281,777 · +41.8%
- By 2100
- 293,609 · +47.8%
Race, ethnicity, and origin ACS 2023
- Neighborhood character
- Predominantly White (75%)
- Race & ethnicity
- White 75% Hispanic / Latino 10% Two or more races 10% Black 9%
- Hispanic origin (detail)
- Puerto Rican 3% Cuban 2% Dominican 2%
- Common ancestry
- Romanian 5% Hispanic 4% Slovak 3%
- Foreign-born
- 16% · Canada, Jamaica
- Languages at home
- 85% English-only · Spanish 8% French/Haitian/Cajun 5% German/W. Germanic 1%
Political lean MEDSL · Charlotte
- 2024 margin
- Solid R (+34.0) · D 32.7% · R 66.7%
- 2008→2024 swing
- -26.7pp toward R · 2008: -7.2pp · 2024: -34.0pp
- All cycles
- 2024: R+34.0 2020: R+26.6 2016: R+27.8 2012: R+14.3 2008: R+7.2
Not yet ingested
- Civics
- —
Market trends
- HPI YoY
- ▼ -16.02%
- Current HPI
- 306.3331
- Rent YoY
- ▼ -4.04%
- Metro
- Punta Gorda, FL
- State GDP YoY
- ▲ 3.28%
- F500 in state
- 36
Industry mix (Fortune 500 HQ in FL)
| Industry | F500 HQs | Revenue |
|---|---|---|
| Industrial Technology | 2 | $29B |
|
||
| Insurance | 2 | $17B |
|
||
| Retail | 1 | $60B |
|
||
| Technology Distribution | 1 | $58B |
|
||
| Homebuilding | 1 | $35B |
|
||
| Technology Manufacturing | 1 | $35B |
|
||
Price history
1 event — show timeline
- 2026-02-06 Listed $147,500 Stellar MLS as Distributed by MLS Grid
Cash-flow waterfall
monthlySold comps — $/sqft
last 12 mo · ≤1 miLoading sold comps…