1500 Bay Area Blvd #118 · Houston, TX
Flood risk 4/10 · Minor
- FEMA flood zone
- X (unshaded)
- Chance of flooding over 30 yrs
- 0.13%
- Est. flood insurance / yr
- $507 – $1,088
Fire risk 2/10 · Minimal
- Est. fire insurance / yr
- $1,222 – $2,270
Heat risk 10/10 · Severe
- Hot days now (above 107°F)
- 7 days/yr
- Hot days in 30 yrs
- 26 days/yr
Wind risk 9/10 · Severe
- Chance of severe wind over 30 yrs
- 99.0%
Air-quality risk 2/10 · Minimal
- Unhealthy air days now
- 1 days/yr
- Unhealthy air days in 30 yrs
- 1 days/yr
Risk factors via First Street. Map © Google.
Why this score? — see what drove the D grade
The composite is a weighted blend of 9 inputs, each scored 0–100. Each bar is that input's sub-score; the figure is the points it added to the 100-point composite (weight × sub-score).
- ARV discount +10.4/15.0
- 1% rule +7.4/10.0
- Cash flow +6.2/30.0
- Schools +4.6/10.0
- Appreciation +4.4/10.0
- Livability +3.7/5.0
- Rent growth +3.0/5.0
- Condition / age +2.5/5.0
- DSCR +0.6/10.0
$82,500
🖨 Deal sheet (PDF) 📄 Offer letter ✓ Due diligence
Listing remarks MLS
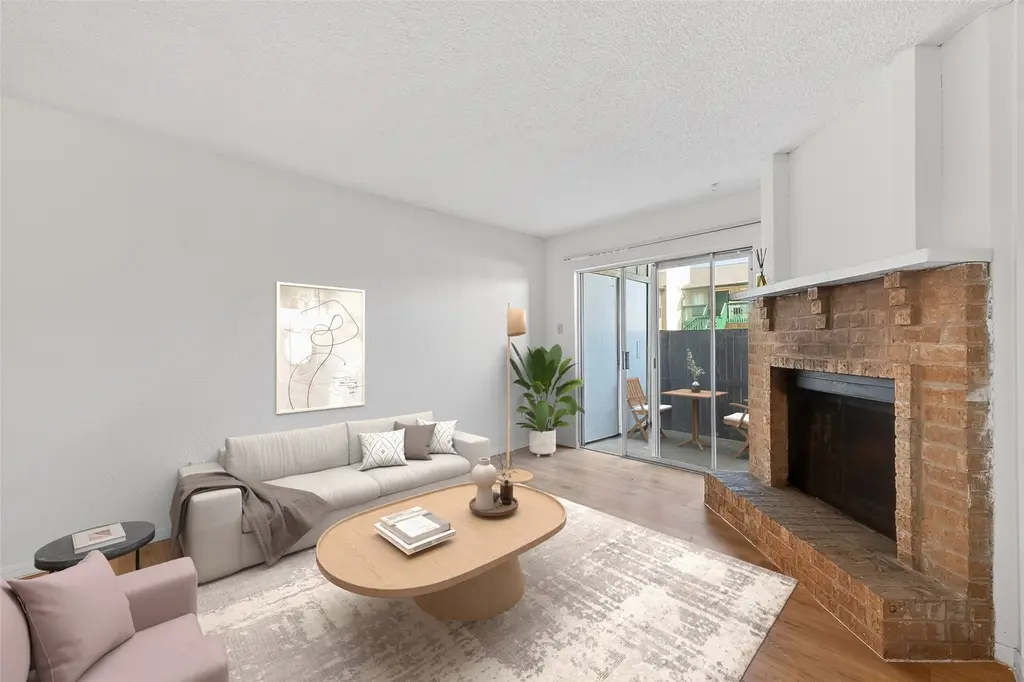
Smart money starts here. This beautifully updated 1BD/1BA ground-floor condo in the heart of the Bay Area corridor puts you 5 minutes from NASA/JSC, UH Clear Lake, I-45, shopping, and dining — with Galveston 40 minutes south and downtown Houston 30 minutes north. At under $85K, owning here costs the same as - or less than - renting. Inside, enjoy 712 sq ft of efficient, move-in ready living with a new stove and range hood, updated flooring, private patio, and a walk-in closet. The community features a sparkling pool and HOA coverage includes insurance, grounds-keeping, water and trash. Ground-floor access, low-maintenance living, unbeatable location. Powerfully guided into the right home. Beautifully sold on the value.
Key facts
- Ground-floor access
- Private patio
- Updated flooring
Tags
Neighborhood map
What this means for you Summary
Snapshot
- This is a 1-bed/1.0-bath condo listed at $82k.
Deal economics
- At list price, monthly cash flow is $-149 ($-2k/yr) — negative.
- To cash-flow at today's rent, offer at most $56k (31.9% below list).
- Meets the 1% rule at list price ($1k rent vs $82k).
- Recommended offer: $56k (31.9% below list) — sets the bar for cash-flow.
- Cap rate 4.1% vs local median 3.2% in Houston — top-decile yield for the area; either an underpriced asset or a hidden risk that comps aren't pricing in. Stress-test before assuming the spread holds.
Location & tenants
- Location reads 74/100 on livability (#184 in TX, #4,771 nationally) — a middle-class / working-renter tenant base. Strengths: amenities A+, cost of living A+, housing A+; Watch: crime F.
- Clear Creek ISD (suburban): math 48% / reading 54% proficiency, ranked #114 of 826 in TX (top 14%) — acceptable for families but not a draw, mixed tenant base, ~2y average lease.
- Zoned schools: Falcon Pass El (math 52% / reading 56%, grade C, #664 of 4,322 statewide, top 16%, 573 students, 41% FRL); Space Center Int (math 31% / reading 44%, grade F, #736 of 1,662 statewide, top 45%, 827 students, 57% FRL); Clear Creek H S (math 51% / reading 54%, grade C-, #444 of 1,632 statewide, top 27%, 2,400 students, 0% FRL).
- Market conditions: Rents rising (+1.9%/yr); 134 active listings in the ZIP; 40 comparable units currently listed for rent nearby; rentals at typical pace (median 15d on market — plan ~3-4 weeks tenant-placement turnaround); 29,883 units permitted in Harris County in 2024 (8,621 in 5+ unit buildings).
- This rent is only 18% of the median local income ($69k/yr) — well below the 30% rent-burden line; pricing power to push rent on renewal without tenant pushback.
Forward outlook
- Local home prices are declining (-1.2%/yr); year-one equity from $570 of loan paydown is wiped out by about $1k of value loss. Plan a longer hold.
- Harris County population projected at +47% by 2050 — long-run rental-demand tailwind backs the buy-and-hold thesis.
Negotiation context
- It's been on market 89 days — a 6% lower offer ($78k) is reasonable based on typical stale-listing flexibility.
- Current owner paid $19k; list at $82k implies a 334% gain — meaningful room to come down on a strong offer.
Risks & watch-outs
- Watch-outs: HOA is 32% of rent.
- Climate carrying-cost: severe wind risk, 99% chance of damaging wind over 30y; extreme-heat days projected 7→26/yr by 2055 (HVAC capex compounding) — expect insurance premiums to compound above CPI over the hold.
Questions for the listing agent
- What do current leases actually rent for vs. the listed asking? Can we see a recent rent roll and the last 12 months of T-12 income?
- It's been on market 89 days. Have you received any prior offers? Is the seller open to a 32% concession, seller financing, or rate buy-down credit?
- Built in 1978 — when were the roof, HVAC, electrical panel, plumbing, and water heater last replaced?
- What does the HOA fee cover, when was the last increase, and are there any pending special assessments or reserve-fund shortfalls?
- Any open or pending special assessments — roof, HVAC, plumbing, elevator, façade? What's the per-unit balance and payoff schedule, and is the seller paying it off at close or rolling it to the buyer?
- Why hasn't it sold? Are there any deal-killer items the seller is aware of (foundation, flood, title, zoning, code violations)?
- Is there a deadline driving the sale (1031 exchange, divorce, estate, relocation)? That informs how much negotiation room exists.
- Schools are D-rated, which usually means shorter tenancies and higher turnover. Who's the typical renter profile here, and what's been the actual vacancy rate?
- Crime grade is F in this area — have there been break-ins, vandalism, or insurance claims at this property in the last 3 years? What carrier currently insures it and at what premium?
- The area grade is low — what's the realistic commute time and amenity access for the typical tenant pool here? Any planned neighborhood developments (good or bad) we should know about?
- What's the average days-on-market for RENTAL listings here right now (not sales)? A rising rental-DOM trend means longer vacancies and softer asking-rent achievability than the comps imply.
- What's the recent tenant-quality profile in this submarket — average credit score on applications, eviction rate, late-payment / NSF rate, and stable-employment percentage? A property-management company in the area should have these aggregated.
- How much new apartment / multifamily construction is in the pipeline within 1–3 miles? Heavy new supply (>2% of stock underway) typically softens rents 12–24 months out; light construction supports rent growth.
Investment metrics
- 1% rule
- 1.24% ✓
- Cap rate
- 4.13%
- Cash-on-cash
- -7.73%
- DSCR
- 0.66
- GRM
- 6.7
CMA / ARV
- ARV (median comp)
- $88,265
- List price
- $82,500
- Delta
- -6.53%
- Verdict
- FAIR
- Comps
- 20 within 1.0 mi
Projected returns pro-forma
-1.22% appreciation · 1.92% rent growth · sell at horizon
- IRR
- -18.3%
- Equity multiple
- 0.25×
- Total profit
- $-17,349
- Equity at exit
- $19,054
- IRR
- -13.3%
- Equity multiple
- -0.07×
- Total profit
- $-24,808
- Equity at exit
- $19,284
Cash invested: $23,100 (down + closing). Projections, not guarantees.
Landlord ↔ Tenant lean methodology
- Overall (STATE)
- 87 Strongly Landlord-Friendly
- State Texas
- 87 Strongly Landlord-Friendly · R+5
- County
- — inherits STATE
- City
- — inherits STATE
ZIP-level market 77058
- Home prices YoY
- -0.5%
- Rents YoY
- 1.9%
- Active inventory
- 134
- Price-to-rent
- 6.7×
Monthly cashflow live
- Estimated rent
- $1,021 high interval (Pro) →
- Mortgage (P&I)
- −$433
- Tax from tax record
- −$166 /mo · $1,989/yr
- Insurance
- −$34
- HOA
- −$323
- Vacancy / Maint / Mgmt
- −$214
- Net cashflow
- $-149
Break-even live
Sensitivity live
| Price | -10% $-102 | -5% $-126 | +0% $-149 | +5% $-172 | +10% $-196 |
|---|---|---|---|---|---|
| Rent | -10% $-230 | -5% $-189 | +0% $-149 | +5% $-109 | +10% $-68 |
| Rate | -1.0pp $-107 | -0.5pp $-128 | base $-149 | +0.5pp $-170 | +1.0pp $-192 |
UW: 25.0% down · 7.5% · 30yr · 1.5% tax · 5.0% vac · 8.0% maint · 8.0% mgmt
Financing live
Cash to close
- Down payment
- $20,625
- Closing costs
- $2,475
- Reserves months
- —
- Total cash needed
- —
Loan-product check · same deal, 3 products live
Conventional
25% down · 7.5% · 30yr
- Down + closing
- —
- Monthly P&I
- —
- Monthly cashflow
- —
- DSCR
- —
- Eligible?
- —
Personal DTI + credit; lowest rate.
DSCR
20% down · 8.5% · 30yr
- Down + closing
- —
- Monthly P&I
- —
- Monthly cashflow
- —
- DSCR
- —
- Eligible?
- —
No personal income docs; deal must DSCR.
Hard money
10% down · 12.0% · 12mo
- Down + closing
- —
- Monthly P&I
- —
- Monthly cashflow
- —
- DSCR
- —
- Eligible?
- —
Short-term bridge; refi at stabilization.
Rent comps 40 comps
| Address | Beds | Baths | Sqft | Rent | $/sqft | DOM | Units | Dist |
|---|---|---|---|---|---|---|---|---|
| 1424 Gemini St Houston, TX | 1.0 | 1.0 | 730 | $1,254 | $1.72 | 20d | 1 | 0.13mi |
| 1245 Bay Area Blvd Houston, TX | 1.0 | 1.0 | 508 | $845 | $1.66 | 45d | 1 | 0.14mi |
| 1245 Bay Area Blvd Houston, TX | 1.0 | 1.0 | 508 | $845 | $1.66 | 23d | 1 | 0.14mi |
| 1620 Bay Area Blvd Houston, TX | 2.0 | 1.0–2.0 | 685 | $1,137 | $1.66 | 0d | 23 | 0.21mi |
| 1306 Gemini St Houston, TX | 1.0 | 1.0 | 660 | $1,180 | $1.79 | 45d | 1 | 0.22mi |
| 1707 Gemini St Houston, TX | 1.0 | 1.0 | 652 | $940 | $1.44 | 22d | 1 | 0.25mi |
| 1707 Gemini St Houston, TX | 1.0 | 1.0 | 652 | $940 | $1.44 | 20d | 1 | 0.25mi |
| 1239 Bay Area Blvd Houston, TX | 1.0 | 1.0 | 670 | $955 | $1.43 | 14d | 1 | 0.25mi |
| 1239 Bay Area Blvd Houston, TX | 1.0 | 1.0 | 670 | $955 | $1.43 | 26d | 1 | 0.25mi |
| 1300 Gemini St Houston, TX | 1.0–2.0 | 1.0–2.0 | 956 | $1,028 | $1.07 | 0d | 30 | 0.28mi |
| 2000 Bay Area Blvd Houston, TX | 2.0 | 1.0–2.0 | 841 | $1,250 | $1.48 | 0d | 18 | 0.52mi |
| 47 Buccaneer Ln Houston, TX | 1.0 | 1.0 | 730 | $935 | $1.28 | 45d | 1 | 0.53mi |
| 47 Buccaneer Ln Houston, TX | 1.0 | 1.0 | 730 | $935 | $1.28 | 18d | 1 | 0.53mi |
| 16457 El Camino Real Houston, TX | 1.0–2.0 | 1.0–2.0 | 813 | $859 | $1.06 | 0d | 27 | 0.57mi |
| 16202 El Camino Real Houston, TX | 1.0 | 1.0 | 700 | $916 | $1.31 | 17d | 1 | 0.75mi |
| 1400 El Camino Village Dr Houston, TX | 1.0–2.0 | 1.0–2.0 | 1060 | $1,279 | $1.21 | 0d | 33 | 0.77mi |
| 16200 Center Blvd Spc Center Houston, TX | 1.0 | 1.0 | 517 | $826 | $1.60 | 14d | 1 | 0.81mi |
| 16200 Center Blvd Unit 16221 Houston, TX | 1.0 | 1.0 | 682 | $838 | $1.23 | 14d | 1 | 0.82mi |
| 16200 Center Blvd Unit 16242 Houston, TX | 1.0 | 1.0 | 517 | $783 | $1.51 | 0d | 1 | 0.82mi |
| 16200 Center Blvd Unit 16274 Houston, TX | 1.0 | 1.0 | 517 | $826 | $1.60 | 0d | 1 | 0.82mi |
| 16200 Center Blvd Unit 1162 Houston, TX | 1.0 | 1.0 | 517 | $837 | $1.62 | 7d | 1 | 0.82mi |
| 16200 Center Blvd Unit 16251 Houston, TX | 1.0 | 1.0 | 682 | $833 | $1.22 | 45d | 1 | 0.82mi |
| 16200 Center Blvd Unit 1047 Houston, TX | 1.0 | 1.0 | 517 | $867 | $1.68 | 0d | 1 | 0.82mi |
| 16200 Center Blvd Unit 324 Houston, TX | 1.0 | 1.0 | 517 | $837 | $1.62 | 9d | 1 | 0.82mi |
| 16200 Center Blvd Unit 147 Houston, TX | 1.0 | 1.0 | 517 | $783 | $1.51 | 13d | 1 | 0.82mi |
| 16202 El Camino Real Unit 16253 Houston, TX | 1.0 | 1.0 | 700 | $832 | $1.19 | 45d | 1 | 0.83mi |
| 16100 Center Blvd Unit 16151 Houston, TX | 1.0 | 1.0 | 678 | $925 | $1.36 | 45d | 1 | 0.83mi |
| 16100 Center Blvd Spc Center Houston, TX | 1.0–2.0 | 1.0–2.0 | 812 | $763 | $0.94 | 3d | 12 | 0.84mi |
| 16106 Center Blvd Spc Center Houston, TX | 1.0 | 1.0 | 687 | $920 | $1.34 | 45d | 1 | 0.84mi |
| 17632 El Camino Real Houston, TX | 1.0 | 1.0 | 649 | $925 | $1.43 | 20d | 1 | 0.88mi |
| 17632 El Camino Real Houston, TX | 1.0 | 1.0 | 649 | $925 | $1.43 | 45d | 1 | 0.88mi |
| 17700 El Camino Real Houston, TX | 3.0 | 1.0–2.0 | 827 | $1,149 | $1.39 | 21d | 17 | 0.89mi |
| 17700 El Camino Real Unit 1162 Houston, TX | 1.0 | 1.0 | 649 | $884 | $1.36 | 7d | 1 | 0.90mi |
| 17700 El Camino Real Unit 17721 Houston, TX | 1.0 | 1.0 | 649 | $919 | $1.42 | 14d | 1 | 0.90mi |
| 17700 El Camino Real Unit 324 Houston, TX | 1.0 | 1.0 | 649 | $884 | $1.36 | 9d | 1 | 0.90mi |
| 17700 El Camino Real Unit 17751 Houston, TX | 1.0 | 1.0 | 649 | $873 | $1.35 | 14d | 1 | 0.90mi |
| 17700 El Camino Real Unit 17721 Houston, TX | 1.0 | 1.0 | 649 | $873 | $1.35 | 0d | 1 | 0.90mi |
| 17700 El Camino Real Unit 17742 Houston, TX | 1.0 | 1.0 | 419 | $899 | $2.15 | 0d | 1 | 0.90mi |
| 2323 Fairwind Dr #105 Houston, TX | 1.0 | 1.0 | 704 | $1,400 | $1.99 | 23d | 1 | 0.92mi |
| 525 Bay Area Blvd Unit 567 Houston, TX | 1.0 | 1.0 | 400 | $933 | $2.33 | 0d | 1 | 0.94mi |
HOA detail condo
- Monthly dues
- $323 · $3,876/yr
- Likely covers
- watertrashlandscapingpool
- Assessments
- None detected in remarks — confirm with the listing agent.
Listing history 18 events
-
2026-06-21days on market $82,500 Active 89 DOM
-
2026-06-18days on market $82,500 Active 86 DOM
-
2026-06-17days on market $82,500 Active 85 DOM
-
2026-06-16days on market $82,500 Active 84 DOM
-
2026-06-15days on market $82,500 Active 83 DOM
-
2026-06-13days on market $82,500 Active 81 DOM
-
2026-06-13days on market $82,500 Active 80 DOM
-
2026-06-09days on market $82,500 Active 77 DOM
-
2026-06-08days on market $82,500 Active 76 DOM
-
2026-06-07days on market $82,500 Active 75 DOM
-
2026-06-04days on market $82,500 Active 72 DOM
-
2026-06-03days on market $82,500 Active 71 DOM
-
2026-06-02days on market $82,500 Active 70 DOM
-
2026-06-01days on market $82,500 Active 69 DOM
-
2026-05-31days on market $82,500 Active 68 DOM
-
2026-05-07price $82,500 734-char remark
Show marketing remark (734 chars)
Smart money starts here. This beautifully updated 1BD/1BA ground-floor condo in the heart of the Bay Area corridor puts you 5 minutes from NASA/JSC, UH Clear Lake, I-45, shopping, and dining — with Galveston 40 minutes south and downtown Houston 30 minutes north. At under $85K, owning here costs the same as - or less than - renting. Inside, enjoy 712 sq ft of efficient, move-in ready living with a new stove and range hood, updated flooring, private patio, and a walk-in closet. The community features a sparkling pool and HOA coverage includes insurance, grounds-keeping, water and trash. Ground-floor access, low-maintenance living, unbeatable location. Powerfully guided into the right home. Beautifully sold on the value.
-
2026-03-25$84,900 Active 734-char remark
Show marketing remark (734 chars)
Smart money starts here. This beautifully updated 1BD/1BA ground-floor condo in the heart of the Bay Area corridor puts you 5 minutes from NASA/JSC, UH Clear Lake, I-45, shopping, and dining — with Galveston 40 minutes south and downtown Houston 30 minutes north. At under $85K, owning here costs the same as - or less than - renting. Inside, enjoy 712 sq ft of efficient, move-in ready living with a new stove and range hood, updated flooring, private patio, and a walk-in closet. The community features a sparkling pool and HOA coverage includes insurance, grounds-keeping, water and trash. Ground-floor access, low-maintenance living, unbeatable location. Powerfully guided into the right home. Beautifully sold on the value.
-
1997-12-15soldstatus $19,000
ⓘ Source: listings_history table (triggers on properties + properties_extension) + one-shot
backfill from property_details.listing_events for pre-trigger history.
Tax reassessment forecast TX · Resets to sale price
- Current annual tax
- $1,989 · $166/mo
- Projected year-2 tax
- $1,989 · $166/mo
- Expected delta
- $0/yr ($0/mo · 0.0%)
ⓘ Screening estimate from a state-policy table — verify with the county assessor before closing.
Climate risk First Street
- Flood 4/10 Moderate FEMA zone X (unshaded) · 13% chance over 30 yrs
- Wildfire 2/10 Low
- Heat 10/10 Extreme 7 d/yr ≥107°F today · 26 d/yr by 30 yrs out
- Wind 9/10 Extreme 99% chance of damaging wind over 30 yrs
- Air quality 2/10 Low 1 unhealthy d/yr today · 1 by 30 yrs out
Nearby sold comps map
Loading sold comps map…
Walkable amenities ~0.75 mi
Loading nearby amenities…
Taxation est. · year 1
- Rental income
- $12,257
- − Mortgage interest
- −$4,621
- − Property taxes
- −$1,989
- − Insurance
- −$412
- − Repairs & maintenance
- −$981
- − Management
- −$981
- − HOA
- −$3,876
- − Depreciation
- −$2,400
- Taxable loss
- −$3,003
- Est. tax savings @ 24.0%
- +$721
- After-tax cash flow
- $-1,066/yr
For passive investors: Depreciation is non-cash, so a rental often shows a tax loss while cash-flowing — sheltering income. Rental losses are passive: they offset passive income freely, and up to $25,000/yr can offset ordinary (W-2) income if you actively participate and your MAGI is under $100k (phasing out to $0 by $150k); unused losses carry forward. On sale, claimed depreciation is recaptured at up to 25%, and gains may owe capital-gains tax (a 1031 exchange can defer both). Figures are a year-1 estimate at your 24.0% rate — not tax advice; consult a CPA.
Schools (NCES district)
- District
- Clear Creek ISD
- NCES district ID
- 4814280
- Math proficiency
- 48% ▼ -10.00%
- Reading proficiency
- 54% ▼ -4.00%
- Median HH income
- $80,240
- Composite
- 46.49/100
- National rank
- #2431
- State rank
- #114 of 826 in TX
Livability — Houston
- Score
- 74/100
- State rank
- #184
- US rank
- #4771
Category grades
Schools grade is shown separately in the Schools card above.
Census & demographics
- Census place
- Houston, TX
- County
- Harris County · 4,702,590 people
- City population
- 3,226,434
- Metro
- Houston-The Woodlands-Sugar Land, TX
- Population (ZIP)
- 17,850
- Household income
- $68,722
- Rent vs Own
- Severe rent burden
- 1147.0
Population outlook (Harris County) Hauer SSP2
- Today (2025)
- 5,571,493 people
- By 2030
- 6,089,821 · +9.3%
- By 2040
- 7,142,806 · +28.2%
- By 2050
- 8,185,864 · +46.9%
- By 2075
- 10,574,329 · +89.8%
- By 2100
- 12,109,958 · +117.4%
Race, ethnicity, and origin ACS 2023
- Neighborhood character
- Diverse neighborhood (Simpson 0.64)
- Race & ethnicity
- White 55% Hispanic / Latino 21% Two or more races 15% Asian 10% Black 5%
- Hispanic origin (detail)
- Mexican 14% Puerto Rican 1%
- Common ancestry
- Italian 6% Lithuanian 3% Portuguese 2%
- Foreign-born
- 21% · Canada, Vietnam, China
- Languages at home
- 70% English-only · Spanish 15% Other Indo-European 5% Vietnamese 2%
Political lean MEDSL · Harris
- 2024 margin
- Lean D (+5.5) · D 52.0% · R 46.4% · Other 1.6%
- 2008→2024 swing
- +3.9pp toward D · 2008: 1.6pp · 2024: 5.5pp
- All cycles
- 2024: D+5.5 2020: D+13.3 2016: D+12.4 2012: D+0.1 2008: D+1.6
Not yet ingested
- Civics
- —
Market trends
- HPI YoY
- ▼ -1.22%
- Current HPI
- 225.0251
- Rent YoY
- ▲ 1.92%
- Metro
- Houston-The Woodlands-Sugar Land, TX
- State GDP YoY
- ▲ 3.95%
- F500 in state
- 110
Industry mix (Fortune 500 HQ in TX)
| Industry | F500 HQs | Revenue |
|---|---|---|
| Energy | 16 | $1,198B |
|
||
| Technology | 5 | $198B |
|
||
| Engineering / Construction | 4 | $72B |
|
||
| Energy Services | 3 | $60B |
|
||
| Utilities | 3 | $41B |
|
||
| Healthcare | 2 | $330B |
|
||
Price history
+334.2% since first listed3 events — show timeline
- 2026-05-07 Price Changed $82,500 HARMLS
- 2026-03-25 Listed $84,900 HARMLS
- 1997-12-15 Sold (Public Records) $19,000 Public Records
Property tax history
+8.9%/yrLatest (2025): $1,989 · +10.5% YoY. Source: county tax records.
Cash-flow waterfall
monthlySold comps — $/sqft
last 12 mo · ≤1 miLoading sold comps…