20 Norfolk Dr · Springs, NY
Flood risk 1/10 · Minimal
- FEMA flood zone
- X (unshaded)
- Chance of flooding over 30 yrs
- 0.0%
- Est. flood insurance / yr
- $473 – $860
Fire risk 1/10 · Minimal
- Est. fire insurance / yr
- $691 – $1,283
Heat risk 4/10 · Minor
- Hot days now (above 90°F)
- 7 days/yr
- Hot days in 30 yrs
- 19 days/yr
Wind risk 8/10 · Major
- Chance of severe wind over 30 yrs
- 80.0%
Air-quality risk 3/10 · Minor
- Unhealthy air days now
- 2 days/yr
- Unhealthy air days in 30 yrs
- 3 days/yr
Risk factors via First Street. Map © Google.
Why this score? — see what drove the B+ grade
The composite is a weighted blend of 9 inputs, each scored 0–100. Each bar is that input's sub-score; the figure is the points it added to the 100-point composite (weight × sub-score).
- Cash flow +30.0/30.0
- ARV discount +12.6/15.0
- DSCR +10.0/10.0
- 1% rule +8.8/10.0
- Schools +5.1/10.0
- Rent growth +5.0/5.0
- Livability +3.2/5.0
- Condition / age +2.5/5.0
- Appreciation +0.0/10.0
$1,479,000
🖨 Deal sheet 📄 Offer letter ✓ Due diligence
Listing remarks
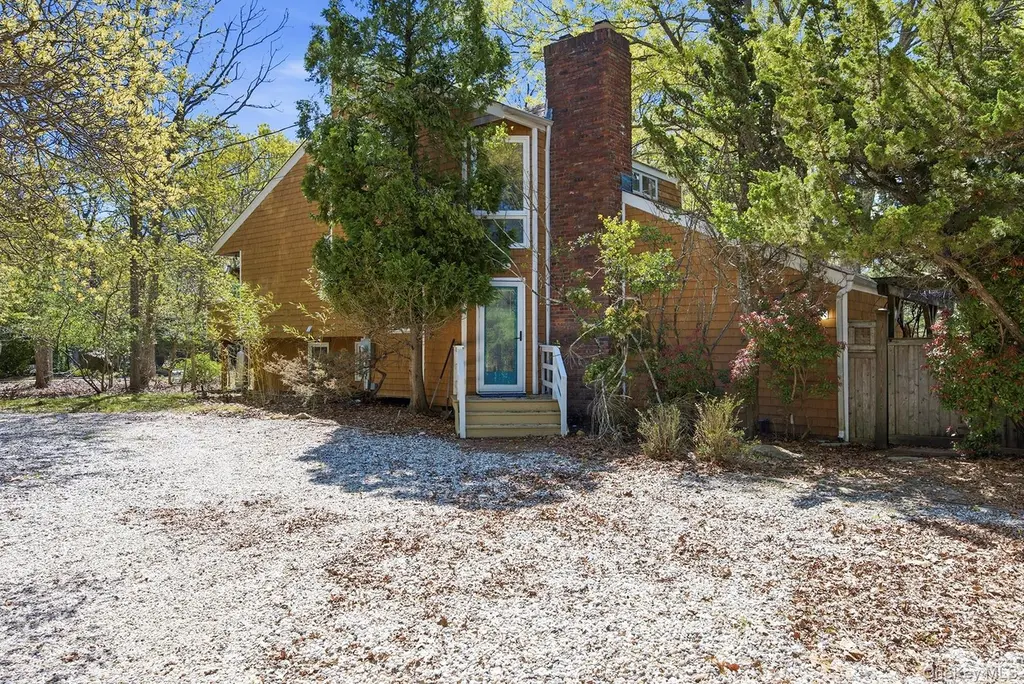
Tucked away on a quiet street in the heart of East Hampton, 20 Norfolk presents an opportunity to own a character-rich Hamptons retreat with pool and coveted private beach access. This distinctive home unfolds across five thoughtfully designed levels, offering a unique blend of space, charm, and versatility. Each floor reveals its own ambiance-ideal for both relaxed everyday living and effortless entertaining. At the top, a private primary suite serves as a true sanctuary, complete with a comfortable sitting area, generous closet space, and a well-appointed en-suite bath. The main living level is bright and inviting, with oversized windows that flood the home with natural light while highli
Key facts
- Private beach access
- Oversized windows
- 0.4 acre lot
Tags
Property features AI
Finance
- HOA & community: Has association (Clearwater); Annual association fee of $380; Association offers recreation facilities
Exterior
- Parking: Driveway (no carport)
- Utilities: Cesspool sewer; No utilities listed
- Home design: Single family residence; Living area reported from plans
- Construction: Frame construction
- Exterior features: In-ground vinyl pool; Not waterfront
Interior
- Kitchen: Oven; Range; Refrigerator
- Bedrooms: Total of 5 rooms (bedrooms included in room count)
- Flooring: Hardwood
- Bathrooms: 2 full bathrooms
- Heating & cooling: Forced air heating (oil); Central air conditioning; 2 fireplaces
- Interior features: Galley-style kitchen; Natural woodwork
- Laundry & utility: Unfinished basement
Neighborhood map
What this means for you Summary
Snapshot
- This is a 3-bed/2.0-bath single-family listed at $1.48M.
Deal economics
- At list price, monthly cash flow is $7k ($82k/yr) — positive.
- The deal already cash-flows at list — no discount required.
- Meets the 1% rule at list price ($20k rent vs $1.48M).
- Recommended offer: $1.43M (3.0% below list) — sets the bar for market timing.
Location & tenants
- Location reads 63/100 on livability (#809 in NY) — a middle-class / working-renter tenant base. Strengths: crime A+, employment A+; Watch: housing C-, amenities F, commute F.
- Springs Union Free School District (town): math 55% / reading 60% proficiency, ranked #239 of 590 in NY (top 40%) — acceptable for families but not a draw, mixed tenant base, ~2y average lease; only 9% free/reduced lunch — higher-income household profile.
- Zoned schools: Springs School (math 55% / reading 60%, grade C+, #839 of 2,108 statewide, top 40%, 689 students, 0% FRL).
- Market conditions: Rents rising fast (+12.3%/yr); 135 active listings in the ZIP; 7 comparable units currently listed for rent nearby; rentals lingering (median 44d on market — plan ~5-8 weeks vacancy on turnover, expect pricing pressure); 57% of comp listings sitting > 30 days — soft ceiling on asking rent; high-income renter base; 1,366 units permitted in Suffolk County in 2024 (216 in 5+ unit buildings).
- At $20,339/mo this rent would consume 188% of the median local household income ($130k/yr) (locally 896% of renters already pay >50% of income on rent) — very limited rent-growth headroom before tenants either downsize or default.
Forward outlook
- Local home prices are declining (-3.0%/yr); year-one equity from $10k of loan paydown is wiped out by about $44k of value loss. Plan a longer hold.
- Suffolk County population projected to shrink 5% by 2050 — rents likely to lag national; underwrite the cash flow, not the appreciation.
- At projected returns (-3.0% appreciation + 8.0% rent growth), your $414k cash investment doubles in ~5 years — after that, you're playing with house money.
Negotiation context
- It's been on market 34 days — a 3% lower offer ($1.43M) is reasonable based on typical stale-listing flexibility.
- 4 sale attempts since 2y ago with the ask held roughly flat each time — persistent listings suggest the price (not the market) is what's stuck; bring a comps-based counter.
- Current owner paid $765k; list at $1.48M implies a 93% gain — meaningful room to come down on a strong offer.
Risks & watch-outs
- Climate carrying-cost: severe wind risk, 80% chance of damaging wind over 30y — expect insurance premiums to compound above CPI over the hold.
Questions for the listing agent
- It's been on market 34 days. Have you received any prior offers? Is the seller open to a 3% concession, seller financing, or rate buy-down credit?
- Built in 1975 — when were the roof, HVAC, electrical panel, plumbing, and water heater last replaced?
- What does the HOA fee cover, when was the last increase, and are there any pending special assessments or reserve-fund shortfalls?
- Is there a deadline driving the sale (1031 exchange, divorce, estate, relocation)? That informs how much negotiation room exists.
- Schools are D-rated, which usually means shorter tenancies and higher turnover. Who's the typical renter profile here, and what's been the actual vacancy rate?
- What's the average days-on-market for RENTAL listings here right now (not sales)? A rising rental-DOM trend means longer vacancies and softer asking-rent achievability than the comps imply.
- What's the recent tenant-quality profile in this submarket — average credit score on applications, eviction rate, late-payment / NSF rate, and stable-employment percentage? A property-management company in the area should have these aggregated.
- How much new for-sale + rental construction is in the pipeline within 1–3 miles? Heavy new supply typically softens prices + rents 12–24 months out; constrained supply supports both.
Investment metrics
- 1% rule
- 1.38% ✓
- Cap rate
- 11.85%
- Cash-on-cash
- 19.83%
- DSCR
- 1.88
- GRM
- 6.1
CMA / ARV
- ARV (median comp)
- $1,669,065
- List price
- $1,479,000
- Delta
- -11.39%
- Verdict
- UNDERPRICED
- Comps
- 9 within 1.0 mi
Show comp detail 3 sales within ~0.75 mi
| Address | Dist | Beds/Ba | Sqft | Sold | Price | $/sf | Match |
|---|---|---|---|---|---|---|---|
| 18 Norfolk Dr | 0.02mi | 3/2.0 | 1,500 (0%) | 0mo | $1,180,000 | $787 | 99 |
| 16 Lion Head Rock Rd | 0.25mi | 4/3.0 (+1) | 1,600 (+7%) | 10mo | $1,850,000 | $1,156 | 60 |
| 104 Pembroke Dr | 0.26mi | 3/3.0 | 1,697 (+13%) | 14mo | $1,525,000 | $899 | 50 |
Match score weights: distance 35% · size 25% · config 20% · recency 20%. Top-matched comps best support the ARV.
Projected returns pro-forma
-3.0% appreciation · 8.0% rent growth · sell at horizon
- IRR
- 17.2%
- Equity multiple
- 1.73×
- Total profit
- $303,456
- Equity at exit
- $220,524
- IRR
- 28.9%
- Equity multiple
- 4.17×
- Total profit
- $1,313,559
- Equity at exit
- $127,877
Cash invested: $414,120 (down + closing). Projections, not guarantees.
Landlord ↔ Tenant lean methodology
- Overall (STATE)
- 15 Strongly Tenant-Friendly
- State New York
- 15 Strongly Tenant-Friendly · D+10
- County
- — inherits STATE
- City
- — inherits STATE
ZIP-level market 11937
- Rents YoY
- 12.3%
- Active inventory
- 135
- Price-to-rent
- 6.1×
Monthly cashflow live
- Estimated rent
- $20,339 medium interval (Pro) →
- Mortgage (P&I)
- −$7,756
- Tax from tax record
- −$819 /mo · $9,828/yr
- Insurance
- −$616
- HOA
- −$32
- Vacancy / Maint / Mgmt
- −$4,271
- Net cashflow
- $6,845
Break-even live
UW: 25.0% down · 7.5% · 30yr · 1.5% tax · 5.0% vac · 8.0% maint · 8.0% mgmt
Financing live
Cash to close
- Down payment
- $369,750
- Closing costs
- $44,370
- Reserves months
- —
- Total cash needed
- —
Loan-product check · same deal, 3 products live
Conventional
25% down · 7.5% · 30yr
- Down + closing
- —
- Monthly P&I
- —
- Monthly cashflow
- —
- DSCR
- —
- Eligible?
- —
Personal DTI + credit; lowest rate.
DSCR
20% down · 8.5% · 30yr
- Down + closing
- —
- Monthly P&I
- —
- Monthly cashflow
- —
- DSCR
- —
- Eligible?
- —
No personal income docs; deal must DSCR.
Hard money
10% down · 12.0% · 12mo
- Down + closing
- —
- Monthly P&I
- —
- Monthly cashflow
- —
- DSCR
- —
- Eligible?
- —
Short-term bridge; refi at stabilization.
Rent comps 7 comps
| Address | Beds | Baths | Sqft | Rent | $/sqft | DOM | Units | Dist |
|---|---|---|---|---|---|---|---|---|
| 135 Pembroke Dr East Hampton, NY | 4.0 | 2.0 | 2000 | $30,000 | $15.00 | 24d | 1 | 0.15mi |
| 19 Pond Ln East Hampton, NY | 3.0 | 2.0 | 1500 | $85,000 | $56.67 | 43d | 1 | 0.56mi |
| 1181 Springs Fireplace Rd East Hampton, NY | 3.0 | 2.0 | 1600 | $75,000 | $46.88 | 43d | 1 | 0.74mi |
| 85 Camberly Rd East Hampton, NY | 4.0 | 3.5 | 1700 | $40,000 | $23.53 | 24d | 1 | 0.85mi |
| 12 Maidstone Park Rd East Hampton, NY | 3.0 | 3.5 | 1800 | $75,000 | $41.67 | 43d | 1 | 1.13mi |
| 12 Underwood Dr East Hampton, NY | 3.0 | 2.0 | 1600 | $30,000 | $18.75 | 18d | 1 | 1.20mi |
| 197 Hog Creek Rd East Hampton, NY | 3.0 | 2.0 | 1700 | $20,000 | $11.76 | 43d | 1 | 1.30mi |
HOA detail
- Monthly dues
- $32 · $384/yr
- Likely covers
- pool
Listing history 31 events
-
2026-06-18days on market $1,479,000 Active 34 DOM
-
2026-06-17days on market $1,479,000 Active 33 DOM
-
2026-06-16days on market $1,479,000 Active 32 DOM
-
2026-06-15days on market $1,479,000 Active 31 DOM
-
2026-06-13days on market $1,479,000 Active 29 DOM
-
2026-06-13days on market $1,479,000 Active 28 DOM
-
2026-06-09days on market $1,479,000 Active 25 DOM
-
2026-06-08days on market $1,479,000 Active 24 DOM
-
2026-06-07days on market $1,479,000 Active 23 DOM
-
2026-06-04days on market $1,479,000 Active 20 DOM
-
2026-06-03days on market $1,479,000 Active 19 DOM
-
2026-06-02days on market $1,479,000 Active 18 DOM
-
2026-06-01days on market $1,479,000 Active 17 DOM
-
2026-05-31days on market $1,479,000 Active 16 DOM
-
2026-05-15$1,479,000 Active 1360-char remark
-
2026-04-26historical
-
2026-01-17price $1,524,000
-
2025-11-12price $1,599,000
-
2025-10-02price $1,625,000
-
2025-09-02price $1,675,000
-
2025-07-07price $1,750,000
-
2025-05-03$1,825,000 Active
-
2025-04-26historical
-
2025-04-19historical $65,000
-
2025-03-21price $65,000
-
2024-11-26$85,000
-
2024-11-26historical $85,000
-
2024-10-24$85,000
-
2006-08-11soldstatus $765,000
-
2003-04-04soldstatus $500,000
-
2000-06-22soldstatus $320,000
ⓘ Source: listings_history table (triggers on properties + properties_extension) + one-shot
backfill from property_details.listing_events for pre-trigger history.
Tax reassessment forecast NY · Partial reset (capped growth)
- Current annual tax
- $9,828 · $819/mo
- Projected year-2 tax
- $17,412 · $1,451/mo
- Expected delta
- +$7,583/yr (+$632/mo · 77.2%)
ⓘ Screening estimate from a state-policy table — verify with the county assessor before closing.
Climate risk First Street
- Flood 1/10 Low FEMA zone X (unshaded) · 0% chance over 30 yrs
- Wildfire 1/10 Low
- Heat 4/10 Moderate 7 d/yr ≥90°F today · 19 d/yr by 30 yrs out
- Wind 8/10 Severe 80% chance of damaging wind over 30 yrs
- Air quality 3/10 Moderate 2 unhealthy d/yr today · 3 by 30 yrs out
Nearby sold comps map
Loading sold comps map…
Walkable amenities ~0.75 mi
Loading nearby amenities…
Taxation est. · year 1
- Rental income
- $244,070
- − Mortgage interest
- −$82,847
- − Property taxes
- −$9,828
- − Insurance
- −$7,395
- − Repairs & maintenance
- −$19,526
- − Management
- −$19,526
- − HOA
- −$384
- − Depreciation
- −$43,025
- Taxable income
- $61,539
- Est. tax owed @ 24.0%
- −$14,769
- After-tax cash flow
- $67,366/yr
For passive investors: Depreciation is non-cash, so a rental often shows a tax loss while cash-flowing — sheltering income. Rental losses are passive: they offset passive income freely, and up to $25,000/yr can offset ordinary (W-2) income if you actively participate and your MAGI is under $100k (phasing out to $0 by $150k); unused losses carry forward. On sale, claimed depreciation is recaptured at up to 25%, and gains may owe capital-gains tax (a 1031 exchange can defer both). Figures are a year-1 estimate at your 24.0% rate — not tax advice; consult a CPA.
Schools (NCES district)
- District
- Springs Union Free School District
- NCES district ID
- 3627900
- Math proficiency
- 55% ▲ 6.00%
- Reading proficiency
- 60% ▲ 10.00%
- Median HH income
- $75,413
- Composite
- 51.42/100
- National rank
- #1728
- State rank
- #239 of 590 in NY
Livability — Springs
- Score
- 63/100
- State rank
- #809
- US rank
- #15666
Category grades
Schools grade is shown separately in the Schools card above.
Census & demographics
- Census place
- Springs, NY
- County
- Suffolk County · 679,920 people
- Metro
- New York-Newark-Jersey City, NY-NJ-PA
- Population (ZIP)
- 21,882
- Household income
- $129,883
- Rent vs Own
- Severe rent burden
- 896.0
Population outlook (Suffolk County) Hauer SSP2
- Today (2025)
- 1,505,262 people
- By 2030
- 1,498,318 · -0.5%
- By 2040
- 1,471,101 · -2.3%
- By 2050
- 1,424,848 · -5.3%
- By 2075
- 1,337,157 · -11.2%
- By 2100
- 1,217,720 · -19.1%
Race, ethnicity, and origin ACS 2023
- Neighborhood character
- Majority White (61%)
- Race & ethnicity
- White 61% Hispanic / Latino 32% Two or more races 23% Black 2% Asian 2%
- Hispanic origin (detail)
- Mexican 2% Puerto Rican 1%
- Common ancestry
- Romanian 5% Scotch-Irish 4% Italian 2%
- Foreign-born
- 25% · Canada, Guatemala, Jamaica
- Languages at home
- 68% English-only · Spanish 28% Other Indo-European 1% Russian/Polish/Slavic 1%
Political lean MEDSL · Suffolk
- 2024 margin
- Lean R (+10.0) · D 45.0% · R 55.0%
- 2008→2024 swing
- -16.0pp toward R · 2008: 6.0pp · 2024: -10.0pp
- All cycles
- 2024: R+10.0 2020: R+0.0 2016: R+8.2 2012: D+2.9 2008: D+6.0
Not yet ingested
- Civics
- —
Market trends
- HPI YoY
- ▼ -285.21%
- Current HPI
- 444.1499
- Rent YoY
- ▲ 12.28%
- Metro
- New York-Newark-Jersey City, NY-NJ-PA
- State GDP YoY
- ▲ 2.60%
- F500 in state
- 92
Industry mix (Fortune 500 HQ in NY)
| Industry | F500 HQs | Revenue |
|---|---|---|
| Financial Services | 10 | $950B |
|
||
| Consumer Goods | 9 | $162B |
|
||
| Insurance | 4 | $225B |
|
||
| Telecommunications | 2 | $144B |
|
||
| Pharmaceuticals | 2 | $112B |
|
||
| Media / Entertainment | 2 | $69B |
|
||
Price history
+362.2% since first listed17 events — show timeline
- 2026-05-15 Listed $1,479,000 OneKey® MLS as Distributed by MLS Grid
- 2026-04-26 Listing Removed — OneKey® MLS as Distributed by MLS Grid
- 2026-01-17 Price Changed $1,524,000 OneKey® MLS as Distributed by MLS Grid
- 2025-11-12 Price Changed $1,599,000 OneKey® MLS as Distributed by MLS Grid
- 2025-10-02 Price Changed $1,625,000 OneKey® MLS as Distributed by MLS Grid
- 2025-09-02 Price Changed $1,675,000 OneKey® MLS as Distributed by MLS Grid
- 2025-07-07 Price Changed $1,750,000 OneKey® MLS as Distributed by MLS Grid
- 2025-05-03 Listed $1,825,000 OneKey® MLS as Distributed by MLS Grid
- 2025-04-26 Coming Soon — OneKey® MLS as Distributed by MLS Grid
- 2025-04-19 Rental Removed $65,000 ONEKEY
- 2025-03-21 Price Changed $65,000 ONEKEY
- 2024-11-26 Listed for Rent $85,000 ONEKEY
- 2024-11-26 Rental Removed $85,000 ONEKEY
- 2024-10-24 Listed for Rent $85,000 ONEKEY
- 2006-08-11 Sold (Public Records) $765,000 Public Records
- 2003-04-04 Sold (Public Records) $500,000 Public Records
- 2000-06-22 Sold (Public Records) $320,000 Public Records
Property tax history
+3.5%/yrLatest (2025): $9,828 · +0.0% YoY. Source: county tax records.
Cash-flow waterfall
monthlySold comps — $/sqft
last 12 mo · ≤1 miLoading sold comps…