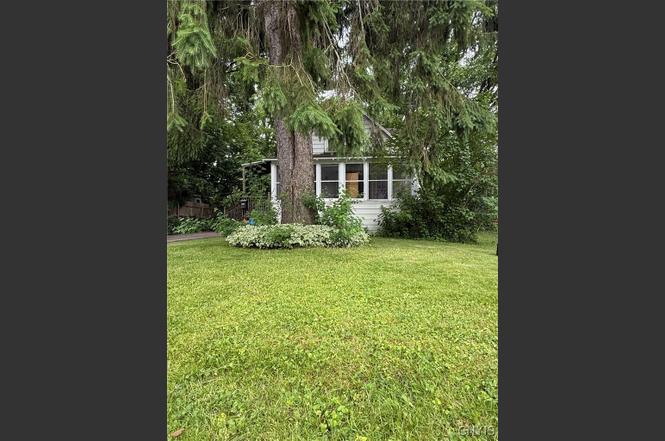
222 Beley Ave · Mattydale, NY
Flood risk 1/10 · Minimal
- FEMA flood zone
- X (unshaded)
- Chance of flooding over 30 yrs
- 0.0%
- Est. flood insurance / yr
- $473 – $860
Fire risk 1/10 · Minimal
- Est. fire insurance / yr
- $691 – $1,283
Heat risk 3/10 · Minor
- Hot days now (above 95°F)
- 7 days/yr
- Hot days in 30 yrs
- 16 days/yr
Wind risk 1/10 · Minimal
- Chance of severe wind over 30 yrs
- 0.0%
Air-quality risk 2/10 · Minimal
- Unhealthy air days now
- 0 days/yr
- Unhealthy air days in 30 yrs
- 1 days/yr
Risk factors via First Street. Map © Google.
Why this score? — see what drove the A- grade
The composite is a weighted blend of 9 inputs, each scored 0–100. Each bar is that input's sub-score; the figure is the points it added to the 100-point composite (weight × sub-score).
- Cash flow +27.3/30.0
- ARV discount +15.0/15.0
- Appreciation +10.0/10.0
- DSCR +9.5/10.0
- 1% rule +9.2/10.0
- Schools +4.2/10.0
- Livability +3.6/5.0
- Rent growth +2.5/5.0
- Condition / age +2.5/5.0
$119,900
🖨 Deal sheet (PDF) 📄 Offer letter ✓ Due diligence
Listing remarks
Opportunity, affordability, and potential come together in this three-bedroom, one-bath home located in the North Syracuse Central School District. If you’ve been searching for a property where your vision and sweat equity can create lasting value, this is it. Why rent when you can own? Situated on a large, level lot, the property features a private, park-like backyard framed by mature trees—perfect for relaxing, gardening, or entertaining. An enclosed front porch provides additional living space, while the long driveway offers ample off-street parking. Inside, you’ll find solid bones and endless possibilities for updates and personalization. Important mechanical improv
Key facts
- Long driveway
- Enclosed front porch
- 9,537 sq ft lot
Tags
Property features AI
Exterior
- Parking: No garage
- Utilities: Electricity connected with circuit breakers; Public water connected; Sewer connected; High-speed internet available
- Home design: Single-story property; Existing construction
- Construction: Aluminum siding; Asphalt shingle roof; Block foundation
- Exterior features: Blacktop driveway; Rectangular residential lot (51 x 187)
Interior
- Kitchen: Gas oven; Gas range; Refrigerator
- Bedrooms: One bedroom on the main level
- Flooring: Carpet; Hardwood; Laminate; Varies
- Bathrooms: One full bathroom on the main level
- Heating & cooling: Gas forced air heating
- Interior features: Ceiling fan(s); Galley kitchen; Sliding glass door(s); Sliding doors
- Laundry & utility: Gas water heater
Neighborhood map
What this means for you Summary
Snapshot
- This is a 3-bed/1.0-bath single-family listed at $120k.
Deal economics
- At list price, monthly cash flow is $347 ($4k/yr) — positive.
- The deal already cash-flows at list — no discount required.
- Meets the 1% rule at list price ($2k rent vs $120k).
- Cap rate 9.8% vs local median 5.5% in Mattydale — top-decile yield for the area; either an underpriced asset or a hidden risk that comps aren't pricing in. Stress-test before assuming the spread holds.
Location & tenants
- Location reads 72/100 on livability (#360 in NY) — a middle-class / working-renter tenant base. Strengths: cost of living A+, housing A+, health & safety A+; Watch: schools D, crime D, amenities F.
- North Syracuse Central School District (suburban): math 45% / reading 50% proficiency, ranked #402 of 590 in NY (top 68%) — families likely to look elsewhere, expect single-tenant / working-renter base with shorter leases.
- Market conditions: 20 active listings in the ZIP; 1 comparable units currently listed for rent nearby; 616 units permitted in Onondaga County in 2024 (256 in 5+ unit buildings).
Forward outlook
- In year one you build about $13k of equity ($829 loan paydown + $12k appreciation (10.0% local appreciation)).
- Onondaga County population projected to shrink 9% by 2050 — rents likely to lag national; underwrite the cash flow, not the appreciation.
- At projected returns (10.0% appreciation + 3.0% rent growth), your $34k cash investment doubles in ~2 years — after that, you're playing with house money.
- By year 3, paydown + projected appreciation supports a ~$32k cash-out refi (75% LTV) — recoverable capital for the next deal without selling this one.
Negotiation context
- Only 5 days on market — expect competitive offers; lowballing is unlikely to land.
- Current owner paid $50k; list at $120k implies a 140% gain — meaningful room to come down on a strong offer.
Risks & watch-outs
- Watch-outs: property tax is 3.2% of price; built in 1930 — expect roof / HVAC / electrical / plumbing capex.
Questions for the listing agent
- Built in 1930 — when were the roof, HVAC, electrical panel, plumbing, and water heater last replaced?
- Property tax is high relative to price — has the assessment been appealed recently, and will the sale trigger a re-assessment?
- Is there a deadline driving the sale (1031 exchange, divorce, estate, relocation)? That informs how much negotiation room exists.
- Schools are D-rated, which usually means shorter tenancies and higher turnover. Who's the typical renter profile here, and what's been the actual vacancy rate?
- Crime grade is D in this area — have there been break-ins, vandalism, or insurance claims at this property in the last 3 years? What carrier currently insures it and at what premium?
- What's the average days-on-market for RENTAL listings here right now (not sales)? A rising rental-DOM trend means longer vacancies and softer asking-rent achievability than the comps imply.
- What's the recent tenant-quality profile in this submarket — average credit score on applications, eviction rate, late-payment / NSF rate, and stable-employment percentage? A property-management company in the area should have these aggregated.
- How much new for-sale + rental construction is in the pipeline within 1–3 miles? Heavy new supply typically softens prices + rents 12–24 months out; constrained supply supports both.
Investment metrics
- 1% rule
- 1.42% ✓
- Cap rate
- 9.77%
- Cash-on-cash
- 12.42%
- DSCR
- 1.55
- GRM
- 5.9
CMA / ARV
- ARV (on-the-fly)
- $210,870
- Comps found
- 12
Show comp detail 12 sales within ~0.75 mi
| Address | Dist | Beds/Ba | Sqft | Sold | Price | $/sf | Match |
|---|---|---|---|---|---|---|---|
| 367 Matty Ave | 0.19mi | 3/1.5 | 1,013 (+2%) | 5mo | $249,200 | $246 | 81 |
| 201 Hill Ave | 0.32mi | 3/1.0 | 1,040 (+5%) | 7mo | $170,000 | $163 | 71 |
| 155 Malden Rd | 0.31mi | 3/2.0 | 1,080 (+9%) | 2mo | $210,000 | $194 | 65 |
| 718 Matty Ave | 0.56mi | 2/1.0 (-1) | 952 (-4%) | 2mo | $210,000 | $221 | 61 |
| 193 Medford Rd | 0.50mi | 2/1.0 (-1) | 936 (-6%) | 5mo | $175,000 | $187 | 59 |
| 108 Harrington St | 0.62mi | 3/1.0 | 1,056 (+7%) | 2mo | $225,000 | $213 | 58 |
| 624 Wright Ave | 0.44mi | 2/2.0 (-1) | 900 (-9%) | 0mo | $233,000 | $259 | 55 |
| 105 Florida Rd S | 0.42mi | 3/2.0 | 1,118 (+13%) | 3mo | $242,500 | $217 | 52 |
| 110 Edgemere Rd | 0.74mi | 3/1.5 | 910 (-8%) | 1mo | $223,000 | $245 | 49 |
| 200 Leonard St | 0.53mi | 3/1.5 | 1,125 (+14%) | 5mo | $172,500 | $153 | 47 |
| 209 Northwood Dr | 0.59mi | 4/2.0 (+1) | 1,107 (+12%) | 1mo | $235,000 | $212 | 43 |
| 203 Brookline Rd | 0.74mi | 3/1.0 | 1,126 (+14%) | 2mo | $190,000 | $169 | 41 |
Match score weights: distance 35% · size 25% · config 20% · recency 20%. Top-matched comps best support the ARV.
Projected returns pro-forma
10.0% appreciation · 3.0% rent growth · sell at horizon
- IRR
- 33.4%
- Equity multiple
- 3.61×
- Total profit
- $87,560
- Equity at exit
- $108,015
- IRR
- 28.9%
- Equity multiple
- 8.17×
- Total profit
- $240,700
- Equity at exit
- $232,939
Cash invested: $33,572 (down + closing). Projections, not guarantees.
Landlord ↔ Tenant lean methodology
- Overall (STATE)
- 15 Strongly Tenant-Friendly
- State New York
- 15 Strongly Tenant-Friendly · D+10
- County
- — inherits STATE
- City
- — inherits STATE
ZIP-level market 13211
- Home prices YoY
- 10.7%
- Active inventory
- 20
- Price-to-rent
- 5.9×
Monthly cashflow live
- Estimated rent
- $1,700 medium interval (Pro) →
- Mortgage (P&I)
- −$629
- Tax from tax record
- −$317 /mo · $3,802/yr
- Insurance
- −$50
- HOA
- −$0
- Vacancy / Maint / Mgmt
- −$357
- Net cashflow
- $347
Break-even live
Sensitivity live
| Price | -10% $415 | -5% $381 | +0% $347 | +5% $314 | +10% $280 |
|---|---|---|---|---|---|
| Rent | -10% $213 | -5% $280 | +0% $347 | +5% $415 | +10% $482 |
| Rate | -1.0pp $408 | -0.5pp $378 | base $347 | +0.5pp $316 | +1.0pp $285 |
UW: 25.0% down · 7.5% · 30yr · 1.5% tax · 5.0% vac · 8.0% maint · 8.0% mgmt
Financing live
Cash to close
- Down payment
- $29,975
- Closing costs
- $3,597
- Reserves months
- —
- Total cash needed
- —
Loan-product check · same deal, 3 products live
Conventional
25% down · 7.5% · 30yr
- Down + closing
- —
- Monthly P&I
- —
- Monthly cashflow
- —
- DSCR
- —
- Eligible?
- —
Personal DTI + credit; lowest rate.
DSCR
20% down · 8.5% · 30yr
- Down + closing
- —
- Monthly P&I
- —
- Monthly cashflow
- —
- DSCR
- —
- Eligible?
- —
No personal income docs; deal must DSCR.
Hard money
10% down · 12.0% · 12mo
- Down + closing
- —
- Monthly P&I
- —
- Monthly cashflow
- —
- DSCR
- —
- Eligible?
- —
Short-term bridge; refi at stabilization.
Rent comps 1 comps
| Address | Beds | Baths | Sqft | Rent | $/sqft | DOM | Units | Dist |
|---|---|---|---|---|---|---|---|---|
| 2802 Lemoyne Ave Unit 1 Syracuse, NY | 3.0 | 1.0 | 988 | $1,700 | $1.72 | 15d | 1 | 0.36mi |
Listing history 4 events
-
2026-06-21days on market $119,900 Active 5 DOM
-
2026-06-18days on market $119,900 Active 2 DOM
-
2026-06-16remarks 681-char remark
-
2026-06-16$119,900 Active 1 DOM
ⓘ Source: listings_history table (triggers on properties + properties_extension) + one-shot
backfill from property_details.listing_events for pre-trigger history.
Tax reassessment forecast NY · Partial reset (capped growth)
- Current annual tax
- $3,802 · $317/mo
- Projected year-2 tax
- $3,802 · $317/mo
- Expected delta
- $0/yr ($0/mo · 0.0%)
ⓘ Screening estimate from a state-policy table — verify with the county assessor before closing.
Climate risk First Street
- Flood 1/10 Low FEMA zone X (unshaded) · 0% chance over 30 yrs
- Wildfire 1/10 Low
- Heat 3/10 Moderate 7 d/yr ≥95°F today · 16 d/yr by 30 yrs out
- Wind 1/10 Low 0% chance of damaging wind over 30 yrs
- Air quality 2/10 Low 0 unhealthy d/yr today · 1 by 30 yrs out
Nearby sold comps map
Loading sold comps map…
Walkable amenities ~0.75 mi
Loading nearby amenities…
Taxation est. · year 1
- Rental income
- $20,400
- − Mortgage interest
- −$6,716
- − Property taxes
- −$3,802
- − Insurance
- −$600
- − Repairs & maintenance
- −$1,632
- − Management
- −$1,632
- − Depreciation
- −$3,488
- Taxable income
- $2,531
- Est. tax owed @ 24.0%
- −$607
- After-tax cash flow
- $3,562/yr
For passive investors: Depreciation is non-cash, so a rental often shows a tax loss while cash-flowing — sheltering income. Rental losses are passive: they offset passive income freely, and up to $25,000/yr can offset ordinary (W-2) income if you actively participate and your MAGI is under $100k (phasing out to $0 by $150k); unused losses carry forward. On sale, claimed depreciation is recaptured at up to 25%, and gains may owe capital-gains tax (a 1031 exchange can defer both). Figures are a year-1 estimate at your 24.0% rate — not tax advice; consult a CPA.
Schools (NCES district)
- District
- North Syracuse Central School District
- NCES district ID
- 3621210
- Math proficiency
- 45% ▼ -9.00%
- Reading proficiency
- 50% ▲ 1.00%
- Median HH income
- $62,904
- Composite
- 41.93/100
- National rank
- #3356
- State rank
- #402 of 590 in NY
Livability — Mattydale
- Score
- 72/100
- State rank
- #360
- US rank
- #6130
Category grades
Schools grade is shown separately in the Schools card above.
Census & demographics
- Census place
- Mattydale, NY
- City population
- 6,155
- Population (ZIP)
- 6,155
Population outlook (Onondaga County) Hauer SSP2
- Today (2025)
- 467,894 people
- By 2030
- 463,381 · -1.0%
- By 2040
- 447,697 · -4.3%
- By 2050
- 426,399 · -8.9%
- By 2075
- 373,661 · -20.1%
- By 2100
- 307,967 · -34.2%
Race, ethnicity, and origin ACS 2023
- Neighborhood character
- Predominantly White (78%)
- Race & ethnicity
- White 78% Two or more races 7% Asian 5% Hispanic / Latino 5% Black 4%
- Common ancestry
- Romanian 7% Lithuanian 5% Iranian 2%
- Foreign-born
- 5% · Philippines, India, Vietnam
- Languages at home
- 93% English-only · Other Indo-European 2% Other Asian/Pacific 2% Russian/Polish/Slavic 1%
Political lean MEDSL · Onondaga
- 2024 margin
- D (+17.3) · D 58.6% · R 41.4%
- 2008→2024 swing
- -3.0pp toward R · 2008: 20.3pp · 2024: 17.3pp
- All cycles
- 2024: D+17.3 2020: D+20.6 2016: D+12.8 2012: D+21.1 2008: D+20.3
Not yet ingested
- Civics
- —
Market trends
- HPI YoY
- ▲ 31.87%
- Current HPI
- 330.266
- Rent YoY
- —
- Metro
- —
- State GDP YoY
- ▲ 2.60%
- F500 in state
- 92
Industry mix (Fortune 500 HQ in NY)
| Industry | F500 HQs | Revenue |
|---|---|---|
| Financial Services | 10 | $950B |
|
||
| Consumer Goods | 9 | $162B |
|
||
| Insurance | 4 | $225B |
|
||
| Telecommunications | 2 | $144B |
|
||
| Pharmaceuticals | 2 | $112B |
|
||
| Media / Entertainment | 2 | $69B |
|
||
Price history
+139.8% since first listed2 events — show timeline
- 2026-06-16 Listed $119,900 CNYIS
- 1993-06-25 Sold (Public Records) $50,000 Public Records
Property tax history
+3.2%/yrLatest (2025): $3,802 · +0.4% YoY. Source: county tax records.
Cash-flow waterfall
monthlySold comps — $/sqft
last 12 mo · ≤1 miLoading sold comps…