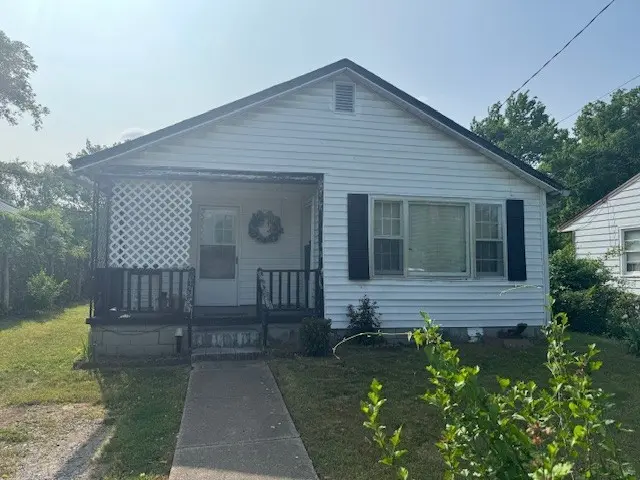
120 S Maple Ave · Gallatin, TN
Flood risk 1/10 · Minimal
- FEMA flood zone
- X (unshaded)
- Chance of flooding over 30 yrs
- 0.0%
- Est. flood insurance / yr
- $507 – $1,088
Fire risk 2/10 · Minimal
- Est. fire insurance / yr
- $949 – $1,763
Heat risk 6/10 · Moderate
- Hot days now (above 106°F)
- 7 days/yr
- Hot days in 30 yrs
- 21 days/yr
Wind risk 4/10 · Minor
- Chance of severe wind over 30 yrs
- 8.0%
Air-quality risk 2/10 · Minimal
- Unhealthy air days now
- 1 days/yr
- Unhealthy air days in 30 yrs
- 3 days/yr
Risk factors via First Street. Map © Google.
Why this score? — see what drove the C- grade
The composite is a weighted blend of 9 inputs, each scored 0–100. Each bar is that input's sub-score; the figure is the points it added to the 100-point composite (weight × sub-score).
- Cash flow +16.1/30.0
- ARV discount +15.0/15.0
- DSCR +5.0/10.0
- Schools +3.6/10.0
- Livability +3.4/5.0
- 1% rule +3.0/10.0
- Rent growth +2.6/5.0
- Condition / age +2.5/5.0
- Appreciation +0.0/10.0
$169,900
🖨 Deal sheet (PDF) 📄 Offer letter ✓ Due diligence
Listing remarks
Affordable home in the heart of Gallatin - Great location near schools, shopping, and churches - 2-bedroom with den or possible 3rd bedroom - 1-bath - Sidewalk - Front porch - Detached storage building - Selling to settle an estate - Convenient to bypass for easy access to Nashville
Key facts
- Near schools
- Convenient to bypass
- Near shopping
Tags
Property features AI
Finance
- Financial info: Annual tax amount listed (tax amount excluded per instructions)
Exterior
- Parking: No covered spaces noted; No off-street parking total listed
- Utilities: Public water; Private sewer; Electricity available
- Home design: Single-family residence; One story; Living area about 986 square feet; Approximate year built
- Construction: Vinyl siding
- Exterior features: Porch (covered); Partial fencing; Level lot; Storage structure on property
Interior
- Kitchen: No appliances included
- Bedrooms: 2 bedrooms (both on the main level); Bedroom sizes approximately 13 x 11 and 12 x 11; Den approximately 13 x 11
- Flooring: Carpet; Vinyl
- Bathrooms: 1 full bathroom
- Heating & cooling: Electric heating; Electric cooling with wall/window unit(s)
- Interior features: Ceiling fan(s); Crawl space basement
Neighborhood map
What this means for you Summary
Snapshot
- This is a 2-bed/1.0-bath single-family listed at $170k.
Deal economics
- At list price, monthly cash flow is $86 ($1k/yr) — positive.
- The deal already cash-flows at list — no discount required.
- To meet the 1% rule (rent ≥ 1% of price), the offer needs to be $137k (19.5% below list).
- Recommended offer: $137k (19.5% below list) — sets the bar for 1% rule.
- Cap rate 6.9% vs local median 2.8% in Gallatin — top-decile yield for the area; either an underpriced asset or a hidden risk that comps aren't pricing in. Stress-test before assuming the spread holds.
Location & tenants
- Location reads 67/100 on livability (#108 in TN) — a middle-class / working-renter tenant base. Strengths: housing A+, cost of living A, crime A-; Watch: amenities F, commute F, health & safety F.
- Sumner County (suburban): math 44% / reading 39% proficiency, ranked #12 of 139 in TN (top 9%) — families likely to look elsewhere, expect single-tenant / working-renter base with shorter leases.
- Zoned schools: Howard Elementary (math 29% / reading 31%, grade F, #415 of 952 statewide, top 44%, 554 students, 0% FRL); Gallatin Senior High School (math 15% / reading 28%, grade F, #172 of 332 statewide, top 52%, 1,659 students, 0% FRL) — zoned schools average 0% FRL vs 34% district-wide (34 pts lower); this property's tenant base skews higher-income than the district average.
- Zoned-school proficiency averages 26% at this address vs 42% district-wide (-16 pts) — the specific schools serving this property underperform the Sumner County average; the district grade overstates school quality for this exact location.
- Market conditions: Rents flat; 1006 active listings in the ZIP; 36 comparable units currently listed for rent nearby; rentals at typical pace (median 24d on market — plan ~3-4 weeks tenant-placement turnaround); 44% of comp listings sitting > 30 days — soft ceiling on asking rent; solid renter incomes; 1,748 units permitted in Sumner County in 2024 (124 in 5+ unit buildings).
Forward outlook
- Local home prices are declining (-3.0%/yr); year-one equity from $1k of loan paydown is wiped out by about $5k of value loss. Plan a longer hold.
- Sumner County population projected at +35% by 2050 — long-run rental-demand tailwind backs the buy-and-hold thesis.
Negotiation context
- It's been on market 51 days — a 3% lower offer ($165k) is reasonable based on typical stale-listing flexibility.
Risks & watch-outs
- Watch-outs: built in 1950 — expect roof / HVAC / electrical / plumbing capex.
- Climate carrying-cost: extreme-heat days projected 7→21/yr by 2055 (HVAC capex compounding) — expect insurance premiums to compound above CPI over the hold.
Questions for the listing agent
- It's been on market 51 days. Have you received any prior offers? Is the seller open to a 20% concession, seller financing, or rate buy-down credit?
- Built in 1950 — when were the roof, HVAC, electrical panel, plumbing, and water heater last replaced?
- Is there a deadline driving the sale (1031 exchange, divorce, estate, relocation)? That informs how much negotiation room exists.
- Schools are D-rated, which usually means shorter tenancies and higher turnover. Who's the typical renter profile here, and what's been the actual vacancy rate?
- What's the average days-on-market for RENTAL listings here right now (not sales)? A rising rental-DOM trend means longer vacancies and softer asking-rent achievability than the comps imply.
- What's the recent tenant-quality profile in this submarket — average credit score on applications, eviction rate, late-payment / NSF rate, and stable-employment percentage? A property-management company in the area should have these aggregated.
- How much new for-sale + rental construction is in the pipeline within 1–3 miles? Heavy new supply typically softens prices + rents 12–24 months out; constrained supply supports both.
Investment metrics
- 1% rule
- 0.80% ✗
- Cap rate
- 6.90%
- Cash-on-cash
- 2.17%
- DSCR
- 1.10
- GRM
- 10.4
CMA / ARV
- ARV (median comp)
- $268,353
- List price
- $169,900
- Delta
- -36.69%
- Verdict
- UNDERPRICED
- Comps
- 20 within 1.0 mi
Show comp detail 11 sales within ~0.75 mi
| Address | Dist | Beds/Ba | Sqft | Sold | Price | $/sf | Match |
|---|---|---|---|---|---|---|---|
| 739 W Eastland St | 0.38mi | 2/1.0 | 1,075 (+9%) | 2mo | $178,000 | $166 | 66 |
| 624 W Eastland St | 0.34mi | 2/2.0 | 1,029 (+4%) | 12mo | $234,500 | $228 | 63 |
| 340 N Maple Ave | 0.40mi | 2/1.0 | 981 (-0%) | 22mo | $235,000 | $240 | 62 |
| 235 Trousdale Ave | 0.33mi | 3/1.0 (+1) | 979 (-1%) | 23mo | $265,000 | $271 | 59 |
| 328 N Blakemore Ave | 0.41mi | 3/1.0 (+1) | 936 (-5%) | 13mo | $270,000 | $288 | 57 |
| 382 S Magnolia St | 0.50mi | 3/1.0 (+1) | 990 (+0%) | 22mo | $240,000 | $242 | 52 |
| 623 W Eastland St | 0.30mi | 3/2.0 (+1) | 1,096 (+11%) | 18mo | $285,000 | $260 | 43 |
| 649 W Eastland St | 0.31mi | 3/2.0 (+1) | 1,131 (+15%) | 11mo | $300,000 | $265 | 43 |
| 326 S Hickory Ave | 0.66mi | 2/1.0 | 892 (-10%) | 20mo | $197,000 | $221 | 37 |
| 338 N Blakemore Ave N | 0.43mi | 3/2.0 (+1) | 1,104 (+12%) | 22mo | $275,000 | $249 | 33 |
| 312 S Hickory Ave | 0.64mi | 3/2.0 (+1) | 1,104 (+12%) | 15mo | $289,900 | $263 | 29 |
Match score weights: distance 35% · size 25% · config 20% · recency 20%. Top-matched comps best support the ARV.
Projected returns pro-forma
-3.0% appreciation · 0.39% rent growth · sell at horizon
- IRR
- -15.5%
- Equity multiple
- 0.46×
- Total profit
- $-25,629
- Equity at exit
- $25,333
- IRR
- -11.4%
- Equity multiple
- 0.39×
- Total profit
- $-29,240
- Equity at exit
- $14,690
Cash invested: $47,572 (down + closing). Projections, not guarantees.
Landlord ↔ Tenant lean methodology
- Overall (STATE)
- 87 Strongly Landlord-Friendly
- State Tennessee
- 87 Strongly Landlord-Friendly · R+13
- County
- — inherits STATE
- City
- — inherits STATE
ZIP-level market 37066
- Home prices YoY
- -32.9%
- Rents YoY
- 0.4%
- Active inventory
- 1006
- Price-to-rent
- 10.4×
Monthly cashflow live
- Estimated rent
- $1,367 high interval (Pro) →
- Mortgage (P&I)
- −$891
- Tax from tax record
- −$32 /mo · $385/yr
- Insurance
- −$71
- HOA
- −$0
- Vacancy / Maint / Mgmt
- −$287
- Net cashflow
- $86
Break-even live
Sensitivity live
| Price | -10% $182 | -5% $134 | +0% $86 | +5% $38 | +10% $-10 |
|---|---|---|---|---|---|
| Rent | -10% $-22 | -5% $32 | +0% $86 | +5% $140 | +10% $194 |
| Rate | -1.0pp $172 | -0.5pp $129 | base $86 | +0.5pp $42 | +1.0pp $-3 |
UW: 25.0% down · 7.5% · 30yr · 1.5% tax · 5.0% vac · 8.0% maint · 8.0% mgmt
Financing live
Cash to close
- Down payment
- $42,475
- Closing costs
- $5,097
- Reserves months
- —
- Total cash needed
- —
Loan-product check · same deal, 3 products live
Conventional
25% down · 7.5% · 30yr
- Down + closing
- —
- Monthly P&I
- —
- Monthly cashflow
- —
- DSCR
- —
- Eligible?
- —
Personal DTI + credit; lowest rate.
DSCR
20% down · 8.5% · 30yr
- Down + closing
- —
- Monthly P&I
- —
- Monthly cashflow
- —
- DSCR
- —
- Eligible?
- —
No personal income docs; deal must DSCR.
Hard money
10% down · 12.0% · 12mo
- Down + closing
- —
- Monthly P&I
- —
- Monthly cashflow
- —
- DSCR
- —
- Eligible?
- —
Short-term bridge; refi at stabilization.
Rent comps 36 comps
| Address | Beds | Baths | Sqft | Rent | $/sqft | DOM | Units | Dist |
|---|---|---|---|---|---|---|---|---|
| 122 S Ford St Gallatin, TN | 2.0 | 1.0 | 750 | $1,099 | $1.47 | 44d | 1 | 0.05mi |
| 665-681 W Eastland Ave Unit 681 Gallatin, TN | 2.0 | 1.0 | 1008 | $1,400 | $1.39 | 8d | 1 | 0.34mi |
| 711 W Eastland Ave Unit C Gallatin, TN | 2.0 | 1.0 | 900 | $1,300 | $1.44 | 44d | 1 | 0.37mi |
| 711 W Eastland St Gallatin, TN | 2.0 | 1.0 | 1100 | $1,455 | $1.32 | 24d | 1 | 0.37mi |
| 203 N Electra St Gallatin, TN | 2.0 | 1.5 | 1020 | $1,199 | $1.18 | 44d | 1 | 0.48mi |
| 257 W Smith St Gallatin, TN | 2.0 | 1.5 | 1000 | $1,375 | $1.38 | 24d | 1 | 0.53mi |
| 202 Cemetery Ave Gallatin, TN | 2.0 | 1.5 | 1000 | $1,375 | $1.38 | 12d | 1 | 0.53mi |
| 243 W Smith St Gallatin, TN | 2.0 | 1.5 | 1000 | $1,375 | $1.38 | 44d | 1 | 0.54mi |
| 735 Trail Dr Gallatin, TN | 2.0 | 1.0 | 820 | $1,295 | $1.58 | 44d | 1 | 0.56mi |
| 217 Greenleaf Cir Gallatin, TN | 2.0 | 1.0 | 800 | $1,199 | $1.50 | 44d | 1 | 0.58mi |
| 745 Trail Dr Gallatin, TN | 2.0 | 1.0 | 820 | $1,295 | $1.58 | 44d | 1 | 0.59mi |
| 317 Cemetery Ave Unit B Gallatin, TN | 1.0 | 1.0 | 650 | $1,000 | $1.54 | 44d | 1 | 0.61mi |
| 234 W Winchester St Unit 234 Gallatin, TN | 1.0 | 1.0 | 850 | $1,200 | $1.41 | 44d | 1 | 0.63mi |
| 501 Small St Gallatin, TN | 2.0 | 2.0 | 1050 | $1,495 | $1.42 | 24d | 1 | 0.63mi |
| 199 Albright Farms Dr Gallatin, TN | 1.0–3.0 | 1.0–2.0 | 1107 | $1,440 | $1.30 | 44d | 1 | 0.64mi |
| 209 W Bledsoe St Gallatin, TN | 3.0 | 1.0 | 912 | $1,725 | $1.89 | 44d | 1 | 0.64mi |
| 128 N Water Ave Gallatin, TN | 1.0–2.0 | 1.0–2.0 | 766 | $2,400 | $3.13 | 24d | 2 | 0.73mi |
| 429 Demoss St Gallatin, TN | 2.0 | 1.0 | 702 | $1,475 | $2.10 | 15d | 1 | 0.86mi |
| 194 W Morningside Dr Gallatin, TN | 2.0 | 1.0 | 875 | $1,250 | $1.43 | 24d | 1 | 0.97mi |
| 143 Morrison St #1 Gallatin, TN | 2.0 | 1.0 | 840 | $1,295 | $1.54 | 44d | 1 | 0.98mi |
| 143 Morrison St Unit 2 Gallatin, TN | 2.0 | 2.0 | 840 | $1,395 | $1.66 | 44d | 1 | 0.98mi |
| 614 N Water Ave Gallatin, TN | 2.0–3.0 | 1.0–2.0 | 1097 | $1,454 | $1.33 | 2d | 17 | 0.98mi |
| 272 Brown Pl Gallatin, TN | 2.0 | 1.0 | 774 | $995 | $1.29 | 22d | 1 | 0.99mi |
| 1008 Village Green Xing Gallatin, TN | 1.0–3.0 | 1.0–2.5 | 1054 | $1,628 | $1.54 | 2d | 18 | 0.99mi |
| 547 N Water Ave Gallatin, TN | 2.0 | 1.0 | 950 | $1,199 | $1.26 | 44d | 1 | 1.00mi |
| 203 Morrison St Gallatin, TN | 1.0 | 1.0 | 700 | $1,100 | $1.57 | 17d | 1 | 1.03mi |
| 203 Morrison St Gallatin, TN | 1.0 | 1.0 | 700 | $1,100 | $1.57 | 21d | 1 | 1.03mi |
| 203 Morrison St Unit B Gallatin, TN | 1.0 | 1.0 | 700 | $1,095 | $1.56 | 21d | 1 | 1.03mi |
| 230 N Hume Ave Unit 3 Gallatin, TN | 2.0 | 1.0 | 1000 | $1,100 | $1.10 | 22d | 1 | 1.16mi |
| 227 E Park Ave Unit B Gallatin, TN | 1.0 | 1.0 | 619 | $1,150 | $1.86 | 44d | 1 | 1.21mi |
| 227 E Park Ave Unit A Gallatin, TN | 1.0 | 1.0 | 669 | $1,250 | $1.87 | 22d | 1 | 1.21mi |
| 500 Virginia Ave Gallatin, TN | 3.0 | 1.0 | 1112 | $1,790 | $1.61 | 44d | 1 | 1.27mi |
| 550 E Bledsoe St Unit A2 Gallatin, TN | 1.0 | 1.0 | 640 | $1,150 | $1.80 | 5d | 1 | 1.37mi |
| 550 E Bledsoe St Gallatin, TN | 1.0–2.0 | 1.0 | 820 | $1,195 | $1.46 | 4d | 2 | 1.37mi |
| 550 E Bledsoe St Apt B24 Gallatin, TN | 2.0 | 1.0 | 1000 | $1,195 | $1.20 | 3d | 1 | 1.38mi |
| 108 Glenn Ave Gallatin, TN | 3.0 | 1.0 | 1000 | $1,500 | $1.50 | 24d | 1 | 1.42mi |
Listing history 15 events
-
2026-06-18days on market $169,900 Active 51 DOM
-
2026-06-17days on market $169,900 Active 50 DOM
-
2026-06-16days on market $169,900 Active 49 DOM
-
2026-06-15days on market $169,900 Active 48 DOM
-
2026-06-13days on market $169,900 Active 46 DOM
-
2026-06-13days on market $169,900 Active 45 DOM
-
2026-06-09days on market $169,900 Active 42 DOM
-
2026-06-08days on market $169,900 Active 41 DOM
-
2026-06-07days on market $169,900 Active 40 DOM
-
2026-06-05days on market $169,900 Active 37 DOM
-
2026-06-03days on market $169,900 Active 36 DOM
-
2026-06-02days on market $169,900 Active 35 DOM
-
2026-06-01days on market $169,900 Active 34 DOM
-
2026-05-31days on market $169,900 Active 33 DOM
-
2026-04-28$169,900 Active 283-char remark
ⓘ Source: listings_history table (triggers on properties + properties_extension) + one-shot
backfill from property_details.listing_events for pre-trigger history.
Tax reassessment forecast TN · Resets to sale price
- Current annual tax
- $385 · $32/mo
- Projected year-2 tax
- $1,206 · $101/mo
- Expected delta
- +$821/yr (+$68/mo · 213.3%)
ⓘ Screening estimate from a state-policy table — verify with the county assessor before closing.
Climate risk First Street
- Flood 1/10 Low FEMA zone X (unshaded) · 0% chance over 30 yrs
- Wildfire 2/10 Low
- Heat 6/10 Major 7 d/yr ≥106°F today · 21 d/yr by 30 yrs out
- Wind 4/10 Moderate 8% chance of damaging wind over 30 yrs
- Air quality 2/10 Low 1 unhealthy d/yr today · 3 by 30 yrs out
Nearby sold comps map
Loading sold comps map…
Walkable amenities ~0.75 mi
Loading nearby amenities…
Taxation est. · year 1
- Rental income
- $16,406
- − Mortgage interest
- −$9,517
- − Property taxes
- −$385
- − Insurance
- −$850
- − Repairs & maintenance
- −$1,312
- − Management
- −$1,312
- − Depreciation
- −$4,943
- Taxable loss
- −$1,913
- Est. tax savings @ 24.0%
- +$459
- After-tax cash flow
- $1,494/yr
For passive investors: Depreciation is non-cash, so a rental often shows a tax loss while cash-flowing — sheltering income. Rental losses are passive: they offset passive income freely, and up to $25,000/yr can offset ordinary (W-2) income if you actively participate and your MAGI is under $100k (phasing out to $0 by $150k); unused losses carry forward. On sale, claimed depreciation is recaptured at up to 25%, and gains may owe capital-gains tax (a 1031 exchange can defer both). Figures are a year-1 estimate at your 24.0% rate — not tax advice; consult a CPA.
Schools (NCES district)
- District
- Sumner County
- NCES district ID
- 4704020
- Math proficiency
- 44% ▼ -11.00%
- Reading proficiency
- 39% ▼ -5.00%
- Median HH income
- $56,998
- Composite
- 36.44/100
- National rank
- #4667
- State rank
- #12 of 139 in TN
Livability — Gallatin
- Score
- 67/100
- State rank
- #108
- US rank
- #11017
Category grades
Schools grade is shown separately in the Schools card above.
Census & demographics
- Census place
- Gallatin, TN
- County
- Sumner County · 196,654 people
- City population
- 64,650
- Metro
- Nashville-Davidson--Murfreesboro--Franklin, TN
- Population (ZIP)
- 64,650
- Household income
- $81,614
- Rent vs Own
- Severe rent burden
- 2172.0
Population outlook (Sumner County) Hauer SSP2
- Today (2025)
- 208,284 people
- By 2030
- 223,902 · +7.5%
- By 2040
- 253,892 · +21.9%
- By 2050
- 281,199 · +35.0%
- By 2075
- 344,866 · +65.6%
- By 2100
- 384,369 · +84.5%
Race, ethnicity, and origin ACS 2023
- Neighborhood character
- Predominantly White (69%)
- Race & ethnicity
- White 69% Black 14% Hispanic / Latino 11% Two or more races 8% Asian 2%
- Hispanic origin (detail)
- Mexican 6% Puerto Rican 2%
- Common ancestry
- Italian 2% Lithuanian 2% Serbian 2%
- Foreign-born
- 6% · Canada
- Languages at home
- 91% English-only · Spanish 7% Other Indo-European 1%
Political lean MEDSL · Sumner
- 2024 margin
- Solid R (+41.8) · D 28.5% · R 70.3% · Other 1.1%
- 2008→2024 swing
- -6.9pp toward R · 2008: -34.9pp · 2024: -41.8pp
- All cycles
- 2024: R+41.8 2020: R+38.6 2016: R+45.0 2012: R+42.0 2008: R+34.9
Not yet ingested
- Civics
- —
Market trends
- HPI YoY
- ▼ -142.76%
- Current HPI
- 290.8043
- Rent YoY
- ▲ 0.39%
- Metro
- Nashville-Davidson--Murfreesboro--Franklin, TN
- State GDP YoY
- ▲ 2.78%
- F500 in state
- 22
Industry mix (Fortune 500 HQ in TN)
| Industry | F500 HQs | Revenue |
|---|---|---|
| Healthcare | 3 | $91B |
|
||
| Retail | 3 | $72B |
|
||
| Transportation / Logistics | 1 | $88B |
|
||
| Paper / Packaging | 1 | $19B |
|
||
| Insurance | 1 | $13B |
|
||
| Energy | 1 | $12B |
|
||
Price history
1 event — show timeline
- 2026-04-28 Listed $169,900 REALTRACS as Distributed by MLS Grid
Property tax history
+1.9%/yrLatest (2025): $385 · +45.8% YoY. Source: county tax records.
Cash-flow waterfall
monthlySold comps — $/sqft
last 12 mo · ≤1 miLoading sold comps…