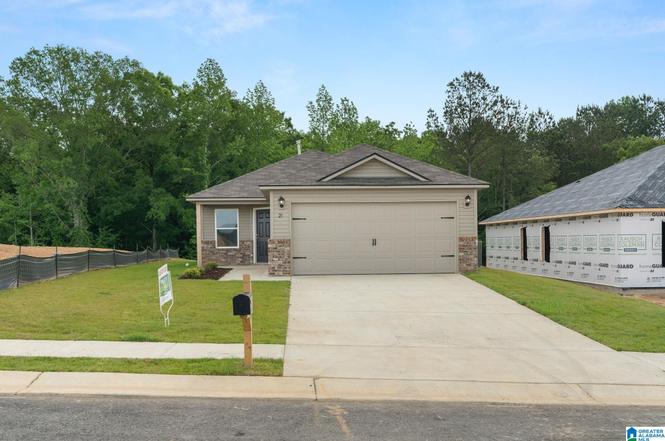
344 Timber Pass · Lincoln, AL
Flood risk 8/10 · Major
- FEMA flood zone
- X (unshaded)
- Chance of flooding over 30 yrs
- 0.99%
- Est. flood insurance / yr
- $507 – $1,088
Fire risk 6/10 · Moderate
- Est. fire insurance / yr
- $916 – $1,700
Heat risk 6/10 · Moderate
- Hot days now (above 107°F)
- 7 days/yr
- Hot days in 30 yrs
- 20 days/yr
Wind risk 6/10 · Moderate
- Chance of severe wind over 30 yrs
- 27.0%
Air-quality risk 3/10 · Minor
- Unhealthy air days now
- 2 days/yr
- Unhealthy air days in 30 yrs
- 3 days/yr
Risk factors via First Street. Map © Google.
Why this score? — see what drove the D grade
The composite is a weighted blend of 9 inputs, each scored 0–100. Each bar is that input's sub-score; the figure is the points it added to the 100-point composite (weight × sub-score).
- Cash flow +11.9/30.0
- ARV discount +6.9/15.0
- Appreciation +6.5/10.0
- DSCR +3.5/10.0
- 1% rule +3.4/10.0
- Livability +3.1/5.0
- Rent growth +2.5/5.0
- Schools +2.5/10.0
- Condition / age +2.5/5.0
$176,503
🖨 Deal sheet (PDF) 📄 Offer letter ✓ Due diligence
Listing remarks
Welcome to Deer Creek, a new Lennar community in Lincoln, AL! Enjoy modern living with Lennar’s Everything’s Included® features—luxury finishes, stainless appliances, smart-home technology, and energy efficiency throughout. Conveniently located near Lake Logan Martin, Top Trails OHV Park, Talladega Superspeedway, and downtown Lincoln, with easy access to I-20 for commuting to Birmingham or Oxford. Embrace the charm of the RC Carlie ll plan, a 3-bedroom, 2-bath home designed for seamless living. Its open floor plan encourages easy interactions, while the covered entry enhances curb appeal and makes a stylish entrance statement. Relax in the spacious living area and savo
Key facts
- Modern living
- Luxury finishes
- Stainless appliances
Tags
Neighborhood map
What this means for you Summary
Snapshot
- This is a 3-bed/2.5-bath single-family listed at $177k.
Deal economics
- At list price, monthly cash flow is $-112 ($-1k/yr) — negative.
- To cash-flow at today's rent, offer at most $160k (9.1% below list).
- To meet the 1% rule (rent ≥ 1% of price), the offer needs to be $149k (15.8% below list).
- Recommended offer: $149k (15.8% below list) — sets the bar for 1% rule.
- Cap rate 6.0% vs local median 4.2% in Lincoln — top-decile yield for the area; either an underpriced asset or a hidden risk that comps aren't pricing in. Stress-test before assuming the spread holds.
Location & tenants
- Location reads 62/100 on livability (#230 in AL) — a middle-class / working-renter tenant base. Strengths: cost of living A+, housing A+; Watch: crime D, amenities F, commute F.
- Talladega County (rural): math 15% / reading 44% proficiency, ranked #75 of 129 in AL (top 58%) — low school quality limits family demand, transient renter base, plan for 1-2y turnover; 64% free/reduced lunch — lower-income household profile, screen leases tightly.
- Zoned schools: Lincoln Elementary School (math 20% / reading 48%, grade F, #311 of 627 statewide, top 50%, 853 students, 62% FRL); Lincoln High School (math 12% / reading 27%, grade F, #169 of 305 statewide, top 59%, 585 students, 68% FRL) — zoned schools at 65% FRL track the district average.
- Market conditions: 230 active listings in the ZIP; 2 comparable units currently listed for rent nearby; 189 units permitted in Talladega County in 2024 (6 in 5+ unit buildings).
Forward outlook
- In year one you build about $6k of equity ($1k loan paydown + $5k appreciation (3.0% local appreciation)).
- Talladega County population projected at -14% by 2050 — secular population decline; favor cash flow + early exit over multi-decade hold.
- By year 6, paydown + projected appreciation supports a ~$34k cash-out refi (75% LTV) — recoverable capital for the next deal without selling this one.
Negotiation context
- It's been on market 120 days — a 9% lower offer ($161k) is reasonable based on typical stale-listing flexibility.
- 2 sale attempts; this cycle's ask has dropped $31k (15%) from the opening price — seller is motivated, your offer sets the floor, not the list.
Risks & watch-outs
- Watch-outs: flood insurance adds $66/mo.
- Climate carrying-cost: severe flood risk; major wind risk, 27% chance of damaging wind over 30y; major wildfire risk; extreme-heat days projected 7→20/yr by 2055 (HVAC capex compounding) — expect insurance premiums to compound above CPI over the hold.
Questions for the listing agent
- What do current leases actually rent for vs. the listed asking? Can we see a recent rent roll and the last 12 months of T-12 income?
- It's been on market 120 days. Have you received any prior offers? Is the seller open to a 16% concession, seller financing, or rate buy-down credit?
- What's the actual annual flood-insurance premium (NFIP or private), and is the property in a SFHA with mandatory coverage?
- Why hasn't it sold? Are there any deal-killer items the seller is aware of (foundation, flood, title, zoning, code violations)?
- Is there a deadline driving the sale (1031 exchange, divorce, estate, relocation)? That informs how much negotiation room exists.
- Schools are D-rated, which usually means shorter tenancies and higher turnover. Who's the typical renter profile here, and what's been the actual vacancy rate?
- Crime grade is D in this area — have there been break-ins, vandalism, or insurance claims at this property in the last 3 years? What carrier currently insures it and at what premium?
- The area grade is low — what's the realistic commute time and amenity access for the typical tenant pool here? Any planned neighborhood developments (good or bad) we should know about?
- What's the average days-on-market for RENTAL listings here right now (not sales)? A rising rental-DOM trend means longer vacancies and softer asking-rent achievability than the comps imply.
- What's the recent tenant-quality profile in this submarket — average credit score on applications, eviction rate, late-payment / NSF rate, and stable-employment percentage? A property-management company in the area should have these aggregated.
- How much new for-sale + rental construction is in the pipeline within 1–3 miles? Heavy new supply typically softens prices + rents 12–24 months out; constrained supply supports both.
Investment metrics
- 1% rule
- 0.84% ✗
- Cap rate
- 5.99%
- Cash-on-cash
- -1.09%
- DSCR
- 0.95
- GRM
- 9.9
CMA / ARV
- ARV (on-the-fly)
- $174,064
- Comps found
- 11
Show comp detail 11 sales within ~0.75 mi
| Address | Dist | Beds/Ba | Sqft | Sold | Price | $/sf | Match |
|---|---|---|---|---|---|---|---|
| 344 Timber Pass | 0.00mi | 3/2.5 | 1,012 (0%) | 1mo | $181,793 | $180 | 99 |
| 25 Greer St | 0.21mi | 3/2.0 | 1,147 (+13%) | 4mo | $193,500 | $169 | 62 |
| 69 Greer St | 0.26mi | 3/2.0 | 1,147 (+13%) | 3mo | $197,000 | $172 | 61 |
| 709 Antler Way | 0.50mi | 3/2.0 | 1,012 (0%) | 18mo | $192,126 | $190 | 60 |
| 59 Greer St | 0.25mi | 3/2.0 | 1,146 (+13%) | 6mo | $192,000 | $168 | 59 |
| 651 Antler Way | 0.39mi | 3/2.0 | 1,068 (+6%) | 14mo | $210,213 | $197 | 59 |
| 784 Antler Way | 0.33mi | 3/2.0 | 1,068 (+6%) | 19mo | $199,900 | $187 | 58 |
| 64 Jacob Ln | 0.38mi | 4/2.0 (+1) | 1,118 (+10%) | 3mo | $159,900 | $143 | 55 |
| 94 Jackson Ln | 0.38mi | 4/2.0 (+1) | 1,118 (+10%) | 3mo | $159,900 | $143 | 55 |
| 76 Shaley St | 0.30mi | 3/2.0 | 1,142 (+13%) | 15mo | $175,000 | $153 | 50 |
| 760 Antler Way | 0.35mi | 3/2.0 | 1,143 (+13%) | 20mo | $199,900 | $175 | 44 |
Match score weights: distance 35% · size 25% · config 20% · recency 20%. Top-matched comps best support the ARV.
Projected returns pro-forma
2.96% appreciation · 3.0% rent growth · sell at horizon
- IRR
- 4.9%
- Equity multiple
- 1.28×
- Total profit
- $13,847
- Equity at exit
- $78,962
- IRR
- 8.0%
- Equity multiple
- 2.21×
- Total profit
- $59,830
- Equity at exit
- $121,380
Cash invested: $49,421 (down + closing). Projections, not guarantees.
Landlord ↔ Tenant lean methodology
- Overall (STATE)
- 90 Strongly Landlord-Friendly
- State Alabama
- 90 Strongly Landlord-Friendly · R+15
- County
- — inherits STATE
- City
- — inherits STATE
ZIP-level market 35096
- Home prices YoY
- 1.2%
- Active inventory
- 230
- Price-to-rent
- 9.9×
Monthly cashflow live
- Estimated rent
- $1,487 medium interval (Pro) →
- Mortgage (P&I)
- −$926
- Tax est. 1.5%
- −$221 /mo · $2,648/yr
- Insurance
- −$74
- Flood insurance flood zone
- −$66 /mo · $798/yr
- HOA
- −$0
- Vacancy / Maint / Mgmt
- −$312
- Net cashflow
- $-112
Break-even live
Sensitivity live
| Price | -10% $10 | -5% $-51 | +0% $-112 | +5% $-172 | +10% $-233 |
|---|---|---|---|---|---|
| Rent | -10% $-229 | -5% $-170 | +0% $-112 | +5% $-53 | +10% $6 |
| Rate | -1.0pp $-23 | -0.5pp $-67 | base $-112 | +0.5pp $-157 | +1.0pp $-204 |
UW: 25.0% down · 7.5% · 30yr · 1.5% tax · 5.0% vac · 8.0% maint · 8.0% mgmt
Financing live
Cash to close
- Down payment
- $44,126
- Closing costs
- $5,295
- Reserves months
- —
- Total cash needed
- —
Loan-product check · same deal, 3 products live
Conventional
25% down · 7.5% · 30yr
- Down + closing
- —
- Monthly P&I
- —
- Monthly cashflow
- —
- DSCR
- —
- Eligible?
- —
Personal DTI + credit; lowest rate.
DSCR
20% down · 8.5% · 30yr
- Down + closing
- —
- Monthly P&I
- —
- Monthly cashflow
- —
- DSCR
- —
- Eligible?
- —
No personal income docs; deal must DSCR.
Hard money
10% down · 12.0% · 12mo
- Down + closing
- —
- Monthly P&I
- —
- Monthly cashflow
- —
- DSCR
- —
- Eligible?
- —
Short-term bridge; refi at stabilization.
Rent comps 2 comps
| Address | Beds | Baths | Sqft | Rent | $/sqft | DOM | Units | Dist |
|---|---|---|---|---|---|---|---|---|
| 67 Wilson Way Lincoln, AL | 3.0 | 2.0 | 1464 | $1,595 | $1.09 | 45d | 1 | 0.79mi |
| 2316 Speedway Blvd Lincoln, AL | 2.0–3.0 | 2.0–3.0 | 1500 | $1,295 | $0.86 | 13d | 3 | 1.37mi |
Listing history 8 events
-
2026-04-26status Pending
-
2026-04-19price $176,503
-
2026-03-28price $184,793
-
2026-03-08price $187,940
-
2026-03-04price $199,830
-
2026-03-03status Active
-
2026-01-28status Pending
-
2025-11-22$207,580 Active
ⓘ Source: listings_history table (triggers on properties + properties_extension) + one-shot
backfill from property_details.listing_events for pre-trigger history.
Climate risk First Street
- Flood 8/10 Severe FEMA zone X (unshaded) · 99% chance over 30 yrs
- Wildfire 6/10 Major
- Heat 6/10 Major 7 d/yr ≥107°F today · 20 d/yr by 30 yrs out
- Wind 6/10 Major 27% chance of damaging wind over 30 yrs
- Air quality 3/10 Moderate 2 unhealthy d/yr today · 3 by 30 yrs out
Nearby sold comps map
Loading sold comps map…
Walkable amenities ~0.75 mi
Loading nearby amenities…
Taxation est. · year 1
- Rental income
- $17,844
- − Mortgage interest
- −$9,887
- − Property taxes
- −$2,648
- − Insurance
- −$1,680
- − Repairs & maintenance
- −$1,428
- − Management
- −$1,428
- − Depreciation
- −$5,135
- Taxable loss
- −$4,360
- Est. tax savings @ 24.0%
- +$1,046
- After-tax cash flow
- $-292/yr
For passive investors: Depreciation is non-cash, so a rental often shows a tax loss while cash-flowing — sheltering income. Rental losses are passive: they offset passive income freely, and up to $25,000/yr can offset ordinary (W-2) income if you actively participate and your MAGI is under $100k (phasing out to $0 by $150k); unused losses carry forward. On sale, claimed depreciation is recaptured at up to 25%, and gains may owe capital-gains tax (a 1031 exchange can defer both). Figures are a year-1 estimate at your 24.0% rate — not tax advice; consult a CPA.
Schools (NCES district)
- District
- Talladega County
- NCES district ID
- 0103180
- Math proficiency
- 15% ▼ -24.00%
- Reading proficiency
- 44% ▲ 3.00%
- Median HH income
- $37,715
- Composite
- 24.5/100
- National rank
- #7650
- State rank
- #75 of 129 in AL
Livability — Lincoln
- Score
- 62/100
- State rank
- #230
- US rank
- #17221
Category grades
Schools grade is shown separately in the Schools card above.
Census & demographics
- City population
- 9,201
- Population (ZIP)
- 9,201
Population outlook (Talladega County) Hauer SSP2
- Today (2025)
- 78,905 people
- By 2030
- 77,160 · -2.2%
- By 2040
- 72,937 · -7.6%
- By 2050
- 68,279 · -13.5%
- By 2075
- 57,884 · -26.6%
- By 2100
- 47,220 · -40.2%
Race, ethnicity, and origin ACS 2023
- Neighborhood character
- Predominantly White (72%)
- Race & ethnicity
- White 72% Black 19% Two or more races 7% Hispanic / Latino 2%
- Common ancestry
- Lithuanian 2% Italian 1% Serbian 1%
- Foreign-born
- 1% · Canada, Vietnam
- Languages at home
- 98% English-only · Vietnamese 1% Spanish 1%
Political lean MEDSL · Talladega
- 2024 margin
- Solid R (+33.8) · D 32.9% · R 66.6%
- 2008→2024 swing
- -15.3pp toward R · 2008: -18.5pp · 2024: -33.8pp
- All cycles
- 2024: R+33.8 2020: R+25.5 2016: R+25.6 2012: R+16.0 2008: R+18.5
Not yet ingested
- Civics
- —
Market trends
- HPI YoY
- ▲ 2.96%
- Current HPI
- 255.9195
- Rent YoY
- —
- Metro
- —
- State GDP YoY
- ▲ 2.94%
- F500 in state
- 4
Industry mix (Fortune 500 HQ in AL)
| Industry | F500 HQs | Revenue |
|---|---|---|
| Financial Services | 1 | $8B |
|
||
| Healthcare | 1 | $5B |
|
||
Price history
-15.0% since first listed8 events — show timeline
- 2026-04-26 Pending — Greater Alabama MLS
- 2026-04-19 Price Changed $176,503 Greater Alabama MLS
- 2026-03-28 Price Changed $184,793 Greater Alabama MLS
- 2026-03-08 Price Changed $187,940 Greater Alabama MLS
- 2026-03-04 Price Changed $199,830 Greater Alabama MLS
- 2026-03-03 Relisted — Greater Alabama MLS
- 2026-01-28 Pending — Greater Alabama MLS
- 2025-11-22 Listed $207,580 Greater Alabama MLS
Cash-flow waterfall
monthlySold comps — $/sqft
last 12 mo · ≤1 miLoading sold comps…