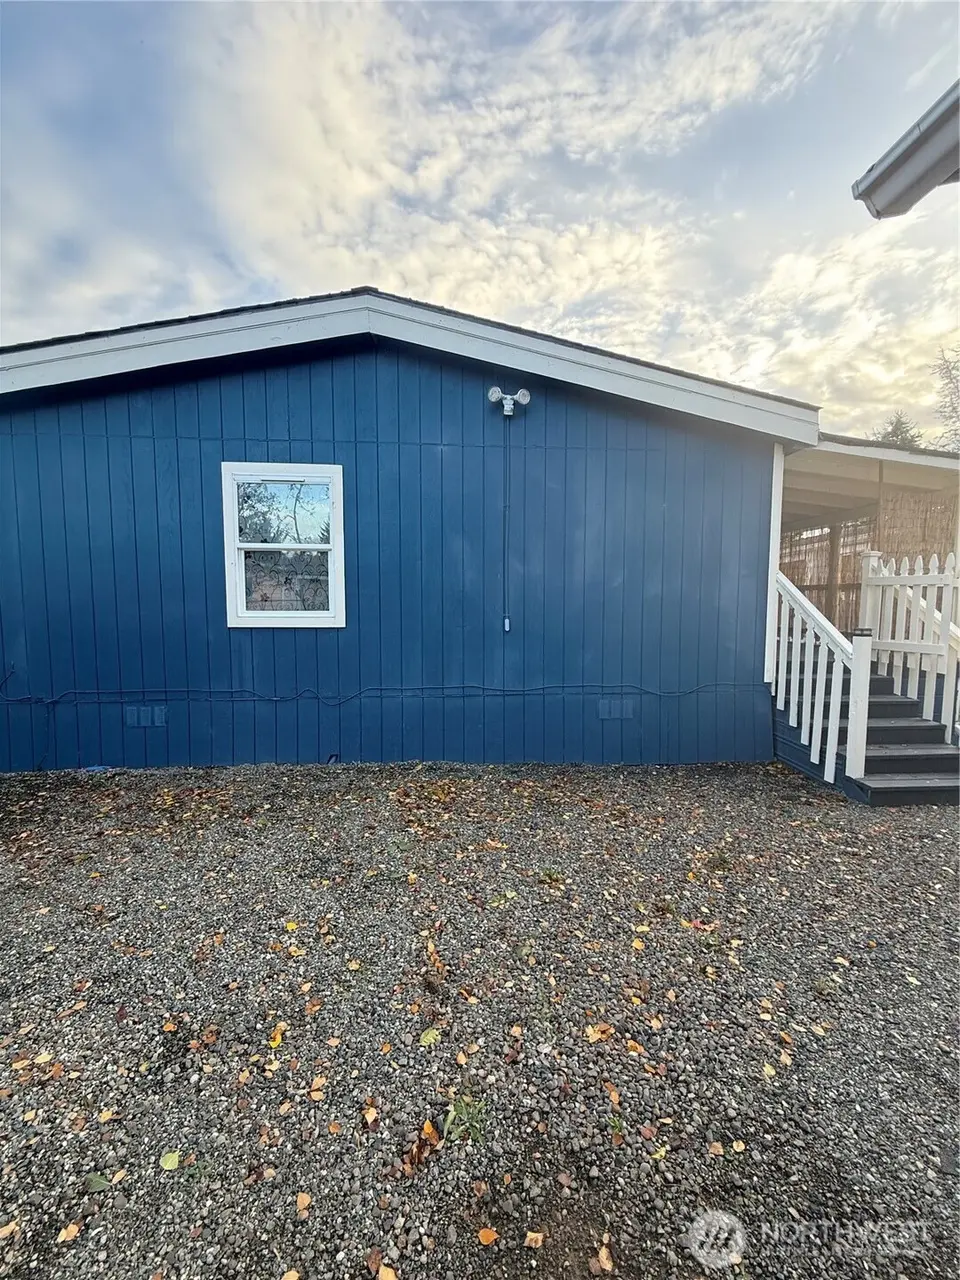
1900 Broadway Ave #59 · Hoquiam, WA
Flood risk 7/10 · Major
- FEMA flood zone
- X (unshaded)
- Chance of flooding over 30 yrs
- 0.75%
- Est. flood insurance / yr
- $507 – $1,088
Fire risk 1/10 · Minimal
- Est. fire insurance / yr
- $604 – $1,122
Heat risk 1/10 · Minimal
- Hot days now (above 77°F)
- 7 days/yr
- Hot days in 30 yrs
- 17 days/yr
Wind risk 1/10 · Minimal
- Chance of severe wind over 30 yrs
- —
Air-quality risk 6/10 · Moderate
- Unhealthy air days now
- 6 days/yr
- Unhealthy air days in 30 yrs
- 6 days/yr
Risk factors via First Street. Map © Google.
Why this score? — see what drove the B- grade
The composite is a weighted blend of 9 inputs, each scored 0–100. Each bar is that input's sub-score; the figure is the points it added to the 100-point composite (weight × sub-score).
- Cash flow +30.0/30.0
- 1% rule +10.0/10.0
- DSCR +10.0/10.0
- ARV discount +7.5/15.0
- Livability +3.8/5.0
- Schools +3.2/10.0
- Rent growth +2.5/5.0
- Condition / age +2.5/5.0
- Appreciation +0.0/10.0
$93,000
🖨 Deal sheet 📄 Offer letter ✓ Due diligence
Listing remarks
HUGE PRICE REDUCTION PLUS BUYER AND BUYER'S AGENT INCENTIVES!!! In Broadway Manor, an all-age park. Here's your opportunity to own an affordable and clean, well-maintained home featuring 3 bedrooms, 1.75 bathrooms, tons of storage, a nice shed with all the appliances included. From this home, it's a short drive to ocean beaches, downtown Hoquiam, the YMCA, grocery stores, schools, shops, banks, and libraries. There's enough space in the backyard to pursue your gardening hobbies. Enjoy your coffee in the huge, covered front porch. The meticulously maintained front yard brings joy and pride. This home is fun and worry-free. Truly move in ready! So, hurry now. Contact your real estate broke
Key facts
- Nice shed
- Remodeled in 2020
- Tons of storage
Tags
Neighborhood map
What this means for you Summary
Snapshot
- This is a 3-bed/2.0-bath manufactured listed at $93k.
Deal economics
- At list price, monthly cash flow is $927 ($11k/yr) — positive.
- The deal already cash-flows at list — no discount required.
- Meets the 1% rule at list price ($2k rent vs $93k).
- Recommended offer: $82k (12.0% below list) — sets the bar for market timing.
- Cap rate 19.1% vs local median 3.8% in Hoquiam — top-decile yield for the area; either an underpriced asset or a hidden risk that comps aren't pricing in. Stress-test before assuming the spread holds.
Location & tenants
- Location reads 75/100 on livability (#171 in WA, #4,268 nationally) — a middle-class / working-renter tenant base. Strengths: commute A+, cost of living A+, housing A+; Watch: health & safety C-, employment D, schools D-.
- Hoquiam School District (town): math 30% / reading 41% proficiency, ranked #250 of 291 in WA (top 86%) — families likely to look elsewhere, expect single-tenant / working-renter base with shorter leases.
- Market conditions: 154 active listings in the ZIP; 2 comparable units currently listed for rent nearby; 297 units permitted in Grays Harbor County in 2024 (17 in 5+ unit buildings).
- This rent runs 44% of the median local income ($55k/yr) — at the standard rent-burdened threshold; future hikes will face affordability resistance.
Forward outlook
- Local home prices are declining (-3.0%/yr); year-one equity from $643 of loan paydown is wiped out by about $3k of value loss. Plan a longer hold.
- Grays Harbor County population projected at -24% by 2050 — secular population decline; favor cash flow + early exit over multi-decade hold.
- At projected returns (-3.0% appreciation + 3.0% rent growth), your $26k cash investment doubles in ~3 years — after that, you're playing with house money.
Negotiation context
- It's been on market 160 days — a 12% lower offer ($82k) is reasonable based on typical stale-listing flexibility.
- 3 sale attempts; this cycle's ask has dropped $6k (6%) from the opening price — seller is motivated, your offer sets the floor, not the list.
Risks & watch-outs
- Watch-outs: flood insurance adds $66/mo.
- Climate carrying-cost: major flood risk — expect insurance premiums to compound above CPI over the hold.
Questions for the listing agent
- It's been on market 160 days. Have you received any prior offers? Is the seller open to a 12% concession, seller financing, or rate buy-down credit?
- What's the actual annual flood-insurance premium (NFIP or private), and is the property in a SFHA with mandatory coverage?
- Why hasn't it sold? Are there any deal-killer items the seller is aware of (foundation, flood, title, zoning, code violations)?
- Is there a deadline driving the sale (1031 exchange, divorce, estate, relocation)? That informs how much negotiation room exists.
- Schools are D-rated, which usually means shorter tenancies and higher turnover. Who's the typical renter profile here, and what's been the actual vacancy rate?
- What's the average days-on-market for RENTAL listings here right now (not sales)? A rising rental-DOM trend means longer vacancies and softer asking-rent achievability than the comps imply.
- What's the recent tenant-quality profile in this submarket — average credit score on applications, eviction rate, late-payment / NSF rate, and stable-employment percentage? A property-management company in the area should have these aggregated.
- How much new for-sale + rental construction is in the pipeline within 1–3 miles? Heavy new supply typically softens prices + rents 12–24 months out; constrained supply supports both.
Investment metrics
- 1% rule
- 2.15% ✓
- Cap rate
- 19.11%
- Cash-on-cash
- 45.79%
- DSCR
- 3.04
- GRM
- 3.9
CMA / ARV
- ARV (on-the-fly)
- $219,912
- Comps found
- 2
Show comp detail 2 sales within ~0.75 mi
| Address | Dist | Beds/Ba | Sqft | Sold | Price | $/sf | Match |
|---|---|---|---|---|---|---|---|
| 2010 Broadway Ave #2 | 0.09mi | 3/2.0 | 1,333 (-11%) | 14mo | $175,000 | $131 | 66 |
| 2010 Broadway Ave #14 | 0.09mi | 3/2.0 | 1,333 (-11%) | 19mo | $195,500 | $147 | 62 |
Match score weights: distance 35% · size 25% · config 20% · recency 20%. Top-matched comps best support the ARV.
Projected returns pro-forma
-3.0% appreciation · 3.0% rent growth · sell at horizon
- IRR
- 39.5%
- Equity multiple
- 2.69×
- Total profit
- $44,023
- Equity at exit
- $13,867
- IRR
- 45.9%
- Equity multiple
- 5.40×
- Total profit
- $114,528
- Equity at exit
- $8,041
Cash invested: $26,040 (down + closing). Projections, not guarantees.
Landlord ↔ Tenant lean methodology
- Overall (STATE)
- 28 Tenant-Leaning
- State Washington
- 28 Tenant-Leaning · D+8
- County
- — inherits STATE
- City
- — inherits STATE
ZIP-level market 98550
- Active inventory
- 154
- Price-to-rent
- 3.9×
Monthly cashflow live
- Estimated rent
- $2,000 medium interval (Pro) →
- Mortgage (P&I)
- −$488
- Tax from tax record
- −$60 /mo · $721/yr
- Insurance
- −$39
- Flood insurance flood zone
- −$66 /mo · $798/yr
- HOA
- −$0
- Vacancy / Maint / Mgmt
- −$420
- Net cashflow
- $927
Break-even live
UW: 25.0% down · 7.5% · 30yr · 1.5% tax · 5.0% vac · 8.0% maint · 8.0% mgmt
Financing live
Cash to close
- Down payment
- $23,250
- Closing costs
- $2,790
- Reserves months
- —
- Total cash needed
- —
Loan-product check · same deal, 3 products live
Conventional
25% down · 7.5% · 30yr
- Down + closing
- —
- Monthly P&I
- —
- Monthly cashflow
- —
- DSCR
- —
- Eligible?
- —
Personal DTI + credit; lowest rate.
DSCR
20% down · 8.5% · 30yr
- Down + closing
- —
- Monthly P&I
- —
- Monthly cashflow
- —
- DSCR
- —
- Eligible?
- —
No personal income docs; deal must DSCR.
Hard money
10% down · 12.0% · 12mo
- Down + closing
- —
- Monthly P&I
- —
- Monthly cashflow
- —
- DSCR
- —
- Eligible?
- —
Short-term bridge; refi at stabilization.
Rent comps 2 comps
| Address | Beds | Baths | Sqft | Rent | $/sqft | DOM | Units | Dist |
|---|---|---|---|---|---|---|---|---|
| 335 Endresen Rd Hoquiam, WA | 3.0 | 1.0 | 914 | $2,300 | $2.52 | 44d | 1 | 0.91mi |
| 829 Emerson Ave Hoquiam, WA | 4.0 | 2.0 | 1800 | $1,800 | $1.00 | 44d | 1 | 1.22mi |
Listing history 6 events
-
2026-05-08status Active
-
2026-05-08price $93,000
-
2026-04-13status Pending
-
2025-12-10status Active
-
2025-11-15status Pending
-
2025-10-28$99,000 Active
ⓘ Source: listings_history table (triggers on properties + properties_extension) + one-shot
backfill from property_details.listing_events for pre-trigger history.
Tax reassessment forecast WA · Resets to sale price
- Current annual tax
- $721 · $60/mo
- Projected year-2 tax
- $911 · $76/mo
- Expected delta
- +$190/yr (+$16/mo · 26.4%)
ⓘ Screening estimate from a state-policy table — verify with the county assessor before closing.
Climate risk First Street
- Flood 7/10 Severe FEMA zone X (unshaded) · 75% chance over 30 yrs
- Wildfire 1/10 Low
- Heat 1/10 Low 7 d/yr ≥77°F today · 17 d/yr by 30 yrs out
- Wind 1/10 Low
- Air quality 6/10 Major 6 unhealthy d/yr today · 6 by 30 yrs out
Nearby sold comps map
Loading sold comps map…
Walkable amenities ~0.75 mi
Loading nearby amenities…
Taxation est. · year 1
- Rental income
- $24,004
- − Mortgage interest
- −$5,209
- − Property taxes
- −$721
- − Insurance
- −$1,262
- − Repairs & maintenance
- −$1,920
- − Management
- −$1,920
- − Depreciation
- −$2,705
- Taxable income
- $10,265
- Est. tax owed @ 24.0%
- −$2,464
- After-tax cash flow
- $8,663/yr
For passive investors: Depreciation is non-cash, so a rental often shows a tax loss while cash-flowing — sheltering income. Rental losses are passive: they offset passive income freely, and up to $25,000/yr can offset ordinary (W-2) income if you actively participate and your MAGI is under $100k (phasing out to $0 by $150k); unused losses carry forward. On sale, claimed depreciation is recaptured at up to 25%, and gains may owe capital-gains tax (a 1031 exchange can defer both). Figures are a year-1 estimate at your 24.0% rate — not tax advice; consult a CPA.
Schools (NCES district)
- District
- Hoquiam School District
- NCES district ID
- 5303660
- Math proficiency
- 30% ▬ 0.00%
- Reading proficiency
- 41% ▲ 1.00%
- Median HH income
- $39,039
- Composite
- 32.31/100
- National rank
- #10914
- State rank
- #250 of 291 in WA
Livability — Hoquiam
- Score
- 75/100
- State rank
- #171
- US rank
- #4268
Category grades
Schools grade is shown separately in the Schools card above.
Census & demographics
- Census place
- Hoquiam, WA
- County
- Grays Harbor County · 44,693 people
- City population
- 12,316
- Metro
- Aberdeen, WA
- Population (ZIP)
- 12,316
- Household income
- $55,040
- Rent vs Own
- Severe rent burden
- 438.0
Population outlook (Grays Harbor County) Hauer SSP2
- Today (2025)
- 66,443 people
- By 2030
- 63,255 · -4.8%
- By 2040
- 56,466 · -15.0%
- By 2050
- 50,516 · -24.0%
- By 2075
- 39,296 · -40.9%
- By 2100
- 31,142 · -53.1%
Race, ethnicity, and origin ACS 2023
- Neighborhood character
- Predominantly White (82%)
- Race & ethnicity
- White 82% Hispanic / Latino 6% Two or more races 6% Native American 4% Asian 2% Black 1%
- Hispanic origin (detail)
- Mexican 5%
- Common ancestry
- Portuguese 6% Romanian 4% Slovak 3%
- Foreign-born
- 4% · Canada, China
- Languages at home
- 94% English-only · Spanish 4% Chinese 1% Russian/Polish/Slavic 1%
Political lean MEDSL · Grays Harbor
- 2024 margin
- Lean R (+6.0) · D 45.6% · R 51.6% · Other 2.8%
- 2008→2024 swing
- -20.6pp toward R · 2008: 14.6pp · 2024: -6.0pp
- All cycles
- 2024: R+6.0 2020: R+6.6 2016: R+7.1 2012: D+14.0 2008: D+14.6
Not yet ingested
- Civics
- —
Market trends
- HPI YoY
- ▼ -136.94%
- Current HPI
- 249.3102
- Rent YoY
- —
- Metro
- Aberdeen, WA
- State GDP YoY
- ▲ 4.65%
- F500 in state
- 22
Industry mix (Fortune 500 HQ in WA)
| Industry | F500 HQs | Revenue |
|---|---|---|
| Retail | 2 | $269B |
|
||
| Technology / Retail | 1 | $638B |
|
||
| Technology | 1 | $245B |
|
||
| Telecommunications | 1 | $38B |
|
||
| Food / Beverage | 1 | $36B |
|
||
| Automotive / Trucks | 1 | $34B |
|
||
Price history
-6.1% since first listed6 events — show timeline
- 2026-05-08 Relisted — NWMLS as Distributed by MLS Grid
- 2026-05-08 Price Changed $93,000 NWMLS as Distributed by MLS Grid
- 2026-04-13 Pending — NWMLS as Distributed by MLS Grid
- 2025-12-10 Relisted — NWMLS as Distributed by MLS Grid
- 2025-11-15 Pending — NWMLS as Distributed by MLS Grid
- 2025-10-28 Listed $99,000 NWMLS as Distributed by MLS Grid
Property tax history
+18.9%/yrLatest (2026): $721 · -2.5% YoY. Source: county tax records.
Cash-flow waterfall
monthlySold comps — $/sqft
last 12 mo · ≤1 miLoading sold comps…