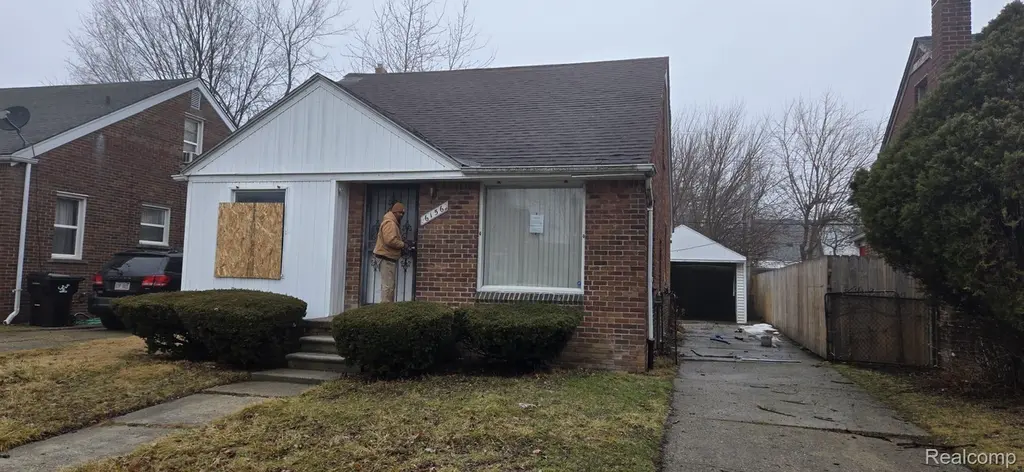
6156 Lodewyck St · Detroit, MI
Flood risk 1/10 · Minimal
- FEMA flood zone
- X (unshaded)
- Chance of flooding over 30 yrs
- 0.0%
- Est. flood insurance / yr
- $473 – $860
Fire risk 1/10 · Minimal
- Est. fire insurance / yr
- $784 – $1,456
Heat risk 3/10 · Minor
- Hot days now (above 96°F)
- 7 days/yr
- Hot days in 30 yrs
- 15 days/yr
Wind risk 2/10 · Minimal
- Chance of severe wind over 30 yrs
- —
Air-quality risk 3/10 · Minor
- Unhealthy air days now
- 3 days/yr
- Unhealthy air days in 30 yrs
- 4 days/yr
Risk factors via First Street. Map © Google.
Why this score? — see what drove the B grade
The composite is a weighted blend of 9 inputs, each scored 0–100. Each bar is that input's sub-score; the figure is the points it added to the 100-point composite (weight × sub-score).
- Cash flow +30.0/30.0
- ARV discount +13.9/15.0
- 1% rule +10.0/10.0
- DSCR +10.0/10.0
- Livability +3.7/5.0
- Rent growth +2.7/5.0
- Condition / age +2.5/5.0
- Schools +1.3/10.0
- Appreciation +0.0/10.0
$62,500
🖨 Deal sheet (PDF) 📄 Offer letter ✓ Due diligence
Listing remarks MLS
East side bungalow. Great fixer upper or nice rent potential. Close to main roads and shopping. Solid home. Room sizes estimated. Buyer's agent to verify all information.
Key facts
- Rent potential
- Shopping
- Main roads
Tags
Property features AI
Exterior
- Parking: Detached garage; Driveway; 1 garage space
- Utilities: Public water; Public sewer
- Home design: Single-family residence; One and one-half stories; Ground-level entry
- Construction: Brick construction; Block foundation; Built with a shingle roof (not specified otherwise)
- Exterior features: Paved road access; Lot roughly 0.1 acre (40 x 103.44)
Interior
- Bedrooms: Total of 3 rooms (includes bedrooms and living spaces)
- Bathrooms: 1 full bathroom
- Heating & cooling: Forced air heating; Propane heating; No central cooling
- Interior features: Unfinished basement
Neighborhood map
What this means for you Summary
Snapshot
- This is a 3-bed/1.0-bath single-family listed at $62k.
Deal economics
- At list price, monthly cash flow is $653 ($8k/yr) — positive.
- The deal already cash-flows at list — no discount required.
- Meets the 1% rule at list price ($1k rent vs $62k).
- Cap rate 18.8% vs local median 10.2% in Detroit — top-decile yield for the area; either an underpriced asset or a hidden risk that comps aren't pricing in. Stress-test before assuming the spread holds.
Location & tenants
- Location reads 73/100 on livability (#218 in MI) — a middle-class / working-renter tenant base. Strengths: amenities A+, commute A+, cost of living A+; Watch: schools F, crime F, employment F.
- Detroit Public Schools Community District (urban): math 10% / reading 24% proficiency, ranked #499 of 540 in MI (top 92%) — low school quality limits family demand, transient renter base, plan for 1-2y turnover; 90% free/reduced lunch — lower-income household profile, screen leases tightly.
- Market conditions: Rents flat; 484 active listings in the ZIP; 40 comparable units currently listed for rent nearby; rentals at typical pace (median 18d on market — plan ~3-4 weeks tenant-placement turnaround); lower-income renter base — watch delinquency; 2,639 units permitted in Wayne County in 2024 (1,216 in 5+ unit buildings).
- This rent runs 37% of the median local income ($45k/yr) — at the standard rent-burdened threshold; future hikes will face affordability resistance.
Forward outlook
- Local home prices are declining (-3.0%/yr); year-one equity from $432 of loan paydown is wiped out by about $2k of value loss. Plan a longer hold.
- Wayne County population projected at -17% by 2050 — secular population decline; favor cash flow + early exit over multi-decade hold.
- At projected returns (-3.0% appreciation + 0.7% rent growth), your $18k cash investment doubles in ~3 years — after that, you're playing with house money.
Negotiation context
- Only 4 days on market — expect competitive offers; lowballing is unlikely to land.
- 17 sale attempts since 22y ago with the ask held roughly flat each time — persistent listings suggest the price (not the market) is what's stuck; bring a comps-based counter.
- Current owner paid $51k; 23% above their basis — modest negotiation headroom, anchor on the comps not their cost.
Risks & watch-outs
- Watch-outs: built in 1949 — expect roof / HVAC / electrical / plumbing capex.
Questions for the listing agent
- Built in 1949 — when were the roof, HVAC, electrical panel, plumbing, and water heater last replaced?
- Is there a deadline driving the sale (1031 exchange, divorce, estate, relocation)? That informs how much negotiation room exists.
- Schools are F-rated, which usually means shorter tenancies and higher turnover. Who's the typical renter profile here, and what's been the actual vacancy rate?
- Crime grade is F in this area — have there been break-ins, vandalism, or insurance claims at this property in the last 3 years? What carrier currently insures it and at what premium?
- What's the average days-on-market for RENTAL listings here right now (not sales)? A rising rental-DOM trend means longer vacancies and softer asking-rent achievability than the comps imply.
- What's the recent tenant-quality profile in this submarket — average credit score on applications, eviction rate, late-payment / NSF rate, and stable-employment percentage? A property-management company in the area should have these aggregated.
- How much new for-sale + rental construction is in the pipeline within 1–3 miles? Heavy new supply typically softens prices + rents 12–24 months out; constrained supply supports both.
Investment metrics
- 1% rule
- 2.20% ✓
- Cap rate
- 18.84%
- Cash-on-cash
- 44.80%
- DSCR
- 2.99
- GRM
- 3.8
CMA / ARV
- ARV (median comp)
- $72,912
- List price
- $62,500
- Delta
- -14.28%
- Verdict
- UNDERPRICED
- Comps
- 20 within 1.0 mi
Show comp detail 12 sales within ~0.75 mi
| Address | Dist | Beds/Ba | Sqft | Sold | Price | $/sf | Match |
|---|---|---|---|---|---|---|---|
| 6135 Marseilles St | 0.08mi | 3/1.0 | 988 (-6%) | 0mo | $55,000 | $56 | 86 |
| 6156 Lodewyck St | 0.00mi | 3/1.0 | 900 (-14%) | 1mo | $51,000 | $57 | 76 |
| 21628 Newcastle Rd | 0.59mi | 3/1.0 | 1,079 (+3%) | 0mo | $173,500 | $161 | 67 |
| 9369 Sanilac St | 0.48mi | 3/1.0 | 1,124 (+8%) | 1mo | $65,000 | $58 | 64 |
| 5220 University Pl | 0.54mi | 2/1.0 (-1) | 1,001 (-4%) | 0mo | $40,000 | $40 | 62 |
| 6106 Oldtown St | 0.49mi | 3/1.5 | 961 (-8%) | 1mo | $132,000 | $137 | 61 |
| 21211 Newcastle Rd | 0.60mi | 3/1.0 | 1,120 (+7%) | 2mo | $135,000 | $121 | 59 |
| 6230 Oldtown St | 0.49mi | 3/1.0 | 1,149 (+10%) | 2mo | $76,000 | $66 | 59 |
| 20244 Mccormick St | 0.75mi | 3/1.0 | 1,000 (-4%) | 1mo | $75,000 | $75 | 57 |
| 10945 Peerless St | 0.74mi | 3/1.0 | 964 (-8%) | 2mo | $54,000 | $56 | 51 |
| 20300 Mccormick St | 0.70mi | 3/1.0 | 940 (-10%) | 1mo | $60,000 | $64 | 50 |
| 5279 Cadieux Rd | 0.75mi | 3/2.0 | 1,161 (+11%) | 0mo | $68,000 | $59 | 43 |
Match score weights: distance 35% · size 25% · config 20% · recency 20%. Top-matched comps best support the ARV.
Projected returns pro-forma
-3.0% appreciation · 0.73% rent growth · sell at horizon
- IRR
- 39.3%
- Equity multiple
- 2.62×
- Total profit
- $28,433
- Equity at exit
- $9,319
- IRR
- 44.5%
- Equity multiple
- 4.79×
- Total profit
- $66,391
- Equity at exit
- $5,404
Cash invested: $17,500 (down + closing). Projections, not guarantees.
Landlord ↔ Tenant lean methodology
- Overall (STATE)
- 62 Landlord-Friendly
- State Michigan
- 62 Landlord-Friendly · EVEN
- County
- — inherits STATE
- City
- — inherits STATE
ZIP-level market 48224
- Rents YoY
- 0.7%
- Active inventory
- 484
- Price-to-rent
- 3.8×
Monthly cashflow live
- Estimated rent
- $1,374 high interval (Pro) →
- Mortgage (P&I)
- −$328
- Tax est. 1.5%
- −$78 /mo · $938/yr
- Insurance
- −$26
- HOA
- −$0
- Vacancy / Maint / Mgmt
- −$288
- Net cashflow
- $653
Break-even live
Sensitivity live
| Price | -10% $696 | -5% $675 | +0% $653 | +5% $632 | +10% $610 |
|---|---|---|---|---|---|
| Rent | -10% $545 | -5% $599 | +0% $653 | +5% $708 | +10% $762 |
| Rate | -1.0pp $685 | -0.5pp $669 | base $653 | +0.5pp $637 | +1.0pp $621 |
UW: 25.0% down · 7.5% · 30yr · 1.5% tax · 5.0% vac · 8.0% maint · 8.0% mgmt
Financing live
Cash to close
- Down payment
- $15,625
- Closing costs
- $1,875
- Reserves months
- —
- Total cash needed
- —
Loan-product check · same deal, 3 products live
Conventional
25% down · 7.5% · 30yr
- Down + closing
- —
- Monthly P&I
- —
- Monthly cashflow
- —
- DSCR
- —
- Eligible?
- —
Personal DTI + credit; lowest rate.
DSCR
20% down · 8.5% · 30yr
- Down + closing
- —
- Monthly P&I
- —
- Monthly cashflow
- —
- DSCR
- —
- Eligible?
- —
No personal income docs; deal must DSCR.
Hard money
10% down · 12.0% · 12mo
- Down + closing
- —
- Monthly P&I
- —
- Monthly cashflow
- —
- DSCR
- —
- Eligible?
- —
Short-term bridge; refi at stabilization.
Rent comps 40 comps
| Address | Beds | Baths | Sqft | Rent | $/sqft | DOM | Units | Dist |
|---|---|---|---|---|---|---|---|---|
| 6301 Lodewyck St Detroit, MI | 3.0 | 1.0 | 1084 | $1,300 | $1.20 | 13d | 1 | 0.07mi |
| 6175 Marseilles St Detroit, MI | 3.0 | 1.0 | 1100 | $1,100 | $1.00 | 44d | 1 | 0.10mi |
| 17720 Chester St Detroit, MI | 2.0 | 1.0 | 986 | $1,250 | $1.27 | 44d | 1 | 0.18mi |
| 17710 Chester St Detroit, MI | 2.0 | 1.0 | 984 | $1,250 | $1.27 | 44d | 1 | 0.18mi |
| 5915 Farmbrook St Detroit, MI | 3.0 | 1.5 | 1000 | $1,250 | $1.25 | 24d | 1 | 0.19mi |
| 6181 Neff Ave Detroit, MI | 3.0 | 1.0 | 1102 | $1,299 | $1.18 | 18d | 1 | 0.31mi |
| 6325 Neff Ave Detroit, MI | 3.0 | 1.0 | 1000 | $1,500 | $1.50 | 3d | 1 | 0.31mi |
| 20926 Moross Rd Grosse Pointe, MI | 3.0 | 1.0 | 1200 | $1,350 | $1.12 | 44d | 1 | 0.32mi |
| 6154 Woodhall St Detroit, MI | 2.0 | 1.0 | 1136 | $1,000 | $0.88 | 44d | 1 | 0.34mi |
| 5786 Neff Ave Detroit, MI | 3.0 | 1.5 | 1100 | $1,225 | $1.11 | 17d | 1 | 0.37mi |
| 19168 Berden St Grosse Pointe, MI | 3.0 | 1.0 | 1200 | $1,800 | $1.50 | 2d | 1 | 0.38mi |
| 21401 Kingsville St Harper Woods, MI | 2.0 | 1.0 | 944 | $1,200 | $1.27 | 24d | 1 | 0.40mi |
| 19203 Edgefield St Harper Woods, MI | 2.0 | 1.0 | 1100 | $1,100 | $1.00 | 24d | 1 | 0.43mi |
| 5955 Guilford St Detroit, MI | 3.0 | 1.0 | 802 | $1,400 | $1.75 | 18d | 1 | 0.45mi |
| 6304 Bluehill St Detroit, MI | 3.0 | 1.0 | 1088 | $1,500 | $1.38 | 44d | 1 | 0.45mi |
| 10542 Lanark St Detroit, MI | 3.0 | 1.0 | 1023 | $1,250 | $1.22 | 44d | 1 | 0.49mi |
| 6225 Oldtown St Detroit, MI | 3.0 | 1.0 | 1330 | $1,199 | $0.90 | 18d | 1 | 0.53mi |
| 19000 Chandler Park Dr Grosse Pointe, MI | 2.0 | 1.0 | 1374 | $2,300 | $1.67 | 2d | 1 | 0.55mi |
| 19000 Chandler Park Dr Grosse Pointe, MI | 2.0 | 1.0 | 1374 | $2,300 | $1.67 | 5d | 1 | 0.55mi |
| 22144 Moross Rd Grosse Pointe, MI | 2.0 | 1.0 | 819 | $1,350 | $1.65 | 3d | 1 | 0.60mi |
| 22144 Moross Rd Grosse Pointe, MI | 2.0 | 1.0 | 819 | $1,350 | $1.65 | 18d | 1 | 0.60mi |
| 22148 Moross Rd Grosse Pointe, MI | 2.0 | 1.0 | 819 | $1,250 | $1.53 | 18d | 1 | 0.61mi |
| 22148 Moross Rd Grosse Pointe, MI | 2.0 | 1.0 | 819 | $1,250 | $1.53 | 3d | 1 | 0.61mi |
| 10870 Marne St Detroit, MI | 3.0 | 1.0 | 1156 | $1,100 | $0.95 | 18d | 1 | 0.65mi |
| 20461 Kingsville St Harper Woods, MI | 4.0 | 1.0 | 1100 | $1,399 | $1.27 | 15d | 1 | 0.65mi |
| 10985 Peerless St Detroit, MI | 3.0 | 1.0 | 1000 | $1,364 | $1.36 | 5d | 1 | 0.73mi |
| 9241 Boleyn St Detroit, MI | 3.0 | 1.0 | 1350 | $1,350 | $1.00 | 44d | 1 | 0.77mi |
| 9313 Harvard Rd Detroit, MI | 3.0 | 1.5 | 1329 | $1,200 | $0.90 | 18d | 1 | 0.78mi |
| 10692 Meuse St Detroit, MI | 3.0 | 1.0 | 955 | $1,250 | $1.31 | 13d | 1 | 0.79mi |
| 10370 Britain St Detroit, MI | 3.0 | 1.0 | 1100 | $1,100 | $1.00 | 44d | 1 | 0.81mi |
| 10400 Britain St Detroit, MI | 3.0 | 1.0 | 890 | $1,100 | $1.24 | 44d | 1 | 0.83mi |
| 19982 McCormick St Detroit, MI | 3.0 | 1.0 | 866 | $1,200 | $1.39 | 4d | 1 | 0.86mi |
| 5783 Yorkshire Rd Detroit, MI | 2.0 | 1.0 | 1040 | $1,200 | $1.15 | 44d | 1 | 0.86mi |
| 10177 Boleyn St Detroit, MI | 3.0 | 1.0 | 767 | $1,250 | $1.63 | 44d | 1 | 0.88mi |
| 10037 Grayton St Detroit, MI | 3.0 | 1.0 | 1000 | $1,400 | $1.40 | 4d | 1 | 0.88mi |
| 17137 Ontario St Unit 1 Detroit, MI | 2.0 | 1.0 | 982 | $1,123 | $1.14 | 24d | 1 | 1.01mi |
| 9635 Everts St Detroit, MI | 4.0 | 2.0 | 1450 | $1,650 | $1.14 | 44d | 1 | 1.04mi |
| 19639 Moross Rd Unit 1 Detroit, MI | 2.0 | 1.0 | 900 | $1,100 | $1.22 | 44d | 1 | 1.05mi |
| 19661 Kenosha St Harper Woods, MI | 3.0 | 2.0 | 1000 | $1,400 | $1.40 | 24d | 1 | 1.11mi |
| 11529 Roxbury St Detroit, MI | 2.0 | 1.0 | 720 | $1,200 | $1.67 | 13d | 1 | 1.15mi |
Listing history 40 events
-
2026-05-09status Pending 170-char remark
Show marketing remark (170 chars)
East side bungalow. Great fixer upper or nice rent potential. Close to main roads and shopping. Solid home. Room sizes estimated. Buyer's agent to verify all information.
-
2026-05-09status Pending 170-char remark
Show marketing remark (170 chars)
East side bungalow. Great fixer upper or nice rent potential. Close to main roads and shopping. Solid home. Room sizes estimated. Buyer's agent to verify all information.
-
2026-05-05$62,500 Active 170-char remark
Show marketing remark (170 chars)
East side bungalow. Great fixer upper or nice rent potential. Close to main roads and shopping. Solid home. Room sizes estimated. Buyer's agent to verify all information.
-
2026-05-05$62,500 Active 170-char remark
Show marketing remark (170 chars)
East side bungalow. Great fixer upper or nice rent potential. Close to main roads and shopping. Solid home. Room sizes estimated. Buyer's agent to verify all information.
-
2023-01-25soldstatus $44,900 Sold
Show marketing remark (236 chars)
Great location near St. John Hospital and I 94. 3 bedroom bungalow hardwood floors, basement and 1.5 detached garage and fended yard. EM of $1,000 or 1%, whichever is greater, min. deposit is required w/ offer. Subject to Bank Addendum.
-
2023-01-25soldstatus $44,900 Closed
Show marketing remark (236 chars)
Great location near St. John Hospital and I 94. 3 bedroom bungalow hardwood floors, basement and 1.5 detached garage and fended yard. EM of $1,000 or 1%, whichever is greater, min. deposit is required w/ offer. Subject to Bank Addendum.
-
2022-12-22status Pending
Show marketing remark (236 chars)
Great location near St. John Hospital and I 94. 3 bedroom bungalow hardwood floors, basement and 1.5 detached garage and fended yard. EM of $1,000 or 1%, whichever is greater, min. deposit is required w/ offer. Subject to Bank Addendum.
-
2022-12-22status Pending
Show marketing remark (236 chars)
Great location near St. John Hospital and I 94. 3 bedroom bungalow hardwood floors, basement and 1.5 detached garage and fended yard. EM of $1,000 or 1%, whichever is greater, min. deposit is required w/ offer. Subject to Bank Addendum.
-
2022-11-15$44,900 Active
Show marketing remark (236 chars)
Great location near St. John Hospital and I 94. 3 bedroom bungalow hardwood floors, basement and 1.5 detached garage and fended yard. EM of $1,000 or 1%, whichever is greater, min. deposit is required w/ offer. Subject to Bank Addendum.
-
2022-11-14$44,900 Active
-
2011-04-20soldstatus $56,000
-
2011-04-13soldstatus $56,000
-
2011-04-13soldstatus $56,000
-
2010-12-13$65,000
-
2010-12-13$65,000
-
2010-08-28historical
-
2009-09-04soldstatus $9,125
-
2009-09-04soldstatus $9,125
-
2009-08-28$75,000
-
2009-06-23historical
-
2009-06-12$9,000
-
2009-06-12$9,000
-
2008-08-23historical
-
2008-08-23historical
-
2008-01-23$84,900
-
2008-01-23$84,900
-
2007-12-30historical
-
2007-12-30historical
-
2007-05-17$84,900
-
2007-05-17historical
-
2007-05-17historical
-
2007-05-16$84,900
-
2007-01-08$94,900
-
2007-01-08$94,900
-
2005-06-20soldstatus $85,000
-
2005-06-08soldstatus $87,500
-
2005-03-02historical
-
2005-01-05$89,900
-
2004-12-31historical
-
2004-09-22$89,900
ⓘ Source: listings_history table (triggers on properties + properties_extension) + one-shot
backfill from property_details.listing_events for pre-trigger history.
Climate risk First Street
- Flood 1/10 Low FEMA zone X (unshaded) · 0% chance over 30 yrs
- Wildfire 1/10 Low
- Heat 3/10 Moderate 7 d/yr ≥96°F today · 15 d/yr by 30 yrs out
- Wind 2/10 Low
- Air quality 3/10 Moderate 3 unhealthy d/yr today · 4 by 30 yrs out
Nearby sold comps map
Loading sold comps map…
Walkable amenities ~0.75 mi
Loading nearby amenities…
Taxation est. · year 1
- Rental income
- $16,484
- − Mortgage interest
- −$3,501
- − Property taxes
- −$938
- − Insurance
- −$312
- − Repairs & maintenance
- −$1,319
- − Management
- −$1,319
- − Depreciation
- −$1,818
- Taxable income
- $7,278
- Est. tax owed @ 24.0%
- −$1,747
- After-tax cash flow
- $6,093/yr
For passive investors: Depreciation is non-cash, so a rental often shows a tax loss while cash-flowing — sheltering income. Rental losses are passive: they offset passive income freely, and up to $25,000/yr can offset ordinary (W-2) income if you actively participate and your MAGI is under $100k (phasing out to $0 by $150k); unused losses carry forward. On sale, claimed depreciation is recaptured at up to 25%, and gains may owe capital-gains tax (a 1031 exchange can defer both). Figures are a year-1 estimate at your 24.0% rate — not tax advice; consult a CPA.
Schools (NCES district)
- District
- Detroit Public Schools Community District
- NCES district ID
- 2601103
- Math proficiency
- 10% ▼ -2.00%
- Reading proficiency
- 24% ▲ 6.00%
- Median HH income
- $25,815
- Composite
- 13.06/100
- National rank
- #9564
- State rank
- #499 of 540 in MI
Livability — Detroit
- Score
- 73/100
- State rank
- #218
- US rank
- #5427
Category grades
Schools grade is shown separately in the Schools card above.
Census & demographics
- Census place
- Detroit, MI
- County
- Wayne County · 1,562,939 people
- City population
- 572,865
- Metro
- Detroit-Warren-Dearborn, MI
- Population (ZIP)
- 39,668
- Household income
- $44,856
- Rent vs Own
- Severe rent burden
- 2515.0
Population outlook (Wayne County) Hauer SSP2
- Today (2025)
- 1,675,273 people
- By 2030
- 1,620,300 · -3.3%
- By 2040
- 1,502,341 · -10.3%
- By 2050
- 1,384,039 · -17.4%
- By 2075
- 1,124,592 · -32.9%
- By 2100
- 881,193 · -47.4%
Race, ethnicity, and origin ACS 2023
- Neighborhood character
- Predominantly Black (88%)
- Race & ethnicity
- Black 88% White 8% Two or more races 3% Hispanic / Latino 1%
- Common ancestry
- Iranian 1% Romanian 1% Lithuanian 1%
- Foreign-born
- 1%
- Languages at home
- 97% English-only · Spanish 2%
Political lean MEDSL · Wayne
- 2024 margin
- Strong D (+29.0) · D 62.7% · R 33.7% · Other 3.6%
- 2008→2024 swing
- -20.5pp toward R · 2008: 49.5pp · 2024: 29.0pp
- All cycles
- 2024: D+29.0 2020: D+38.1 2016: D+37.3 2012: D+46.9 2008: D+49.5
Not yet ingested
- Civics
- —
Market trends
- HPI YoY
- ▼ -226.38%
- Current HPI
- 161.886
- Rent YoY
- ▲ 0.73%
- Metro
- Detroit-Warren-Dearborn, MI
- State GDP YoY
- ▲ 1.37%
- F500 in state
- 28
Industry mix (Fortune 500 HQ in MI)
| Industry | F500 HQs | Revenue |
|---|---|---|
| Automotive Parts | 3 | $48B |
|
||
| Automotive | 2 | $372B |
|
||
| Chemicals | 1 | $45B |
|
||
| Automotive Retail | 1 | $29B |
|
||
| Healthcare / Medical Devices | 1 | $23B |
|
||
| Automotive Technology | 1 | $20B |
|
||
Price history
-43.3% since first listed42 events — show timeline
- 2026-06-01 Sold (MLS) $51,000 MiRealSource-MiMLS
- 2026-06-01 Sold (MLS) $51,000 REALCOMP
- 2026-05-09 Pending — MiRealSource-MiMLS
- 2026-05-09 Pending — REALCOMP
- 2026-05-05 Listed $62,500 MiRealSource-MiMLS
- 2026-05-05 Listed $62,500 REALCOMP
- 2023-01-25 Sold (MLS) $44,900 MiRealSource-MiMLS
- 2023-01-25 Sold (MLS) $44,900 REALCOMP
- 2022-12-22 Pending — MiRealSource-MiMLS
- 2022-12-22 Pending — REALCOMP
- 2022-11-15 Listed $44,900 REALCOMP
- 2022-11-14 Listed $44,900 MiRealSource-MiMLS
- 2011-04-20 Sold (Public Records) $56,000 Public Records
- 2011-04-13 Sold (MLS) $56,000 MiRealSource-MiMLS
- 2011-04-13 Sold (MLS) $56,000 REALCOMP
- 2010-12-13 Listed $65,000 MiRealSource-MiMLS
- 2010-12-13 Listed $65,000 REALCOMP
- 2010-08-28 Listing Removed — REALCOMP
- 2009-09-04 Sold (MLS) $9,125 MiRealSource-MiMLS
- 2009-09-04 Sold (MLS) $9,125 REALCOMP
- 2009-08-28 Listed $75,000 REALCOMP
- 2009-06-23 Listing Removed — MiRealSource-MiMLS
- 2009-06-12 Listed $9,000 MiRealSource-MiMLS
- 2009-06-12 Listed $9,000 REALCOMP
- 2008-08-23 Listing Removed — MiRealSource-MiMLS
- 2008-08-23 Listing Removed — REALCOMP
- 2008-01-23 Listed $84,900 MiRealSource-MiMLS
- 2008-01-23 Listed $84,900 REALCOMP
- 2007-12-30 Listing Removed — MiRealSource-MiMLS
- 2007-12-30 Listing Removed — REALCOMP
- 2007-05-17 Listing Removed — REALCOMP
- 2007-05-17 Listing Removed — MiRealSource-MiMLS
- 2007-05-17 Listed $84,900 REALCOMP
- 2007-05-16 Listed $84,900 MiRealSource-MiMLS
- 2007-01-08 Listed $94,900 REALCOMP
- 2007-01-08 Listed $94,900 MiRealSource-MiMLS
- 2005-06-20 Sold (MLS) $85,000 MiRealSource-MiMLS
- 2005-06-08 Sold (Public Records) $87,500 Public Records
- 2005-03-02 Listing Removed — MiRealSource-MiMLS
- 2005-01-05 Listed $89,900 MiRealSource-MiMLS
- 2004-12-31 Listing Removed — MiRealSource-MiMLS
- 2004-09-22 Listed $89,900 MiRealSource-MiMLS
Property tax history
+11.4%/yrLatest (2025): $6,436 · -11.0% YoY. Source: county tax records.
Cash-flow waterfall
monthlySold comps — $/sqft
last 12 mo · ≤1 miLoading sold comps…