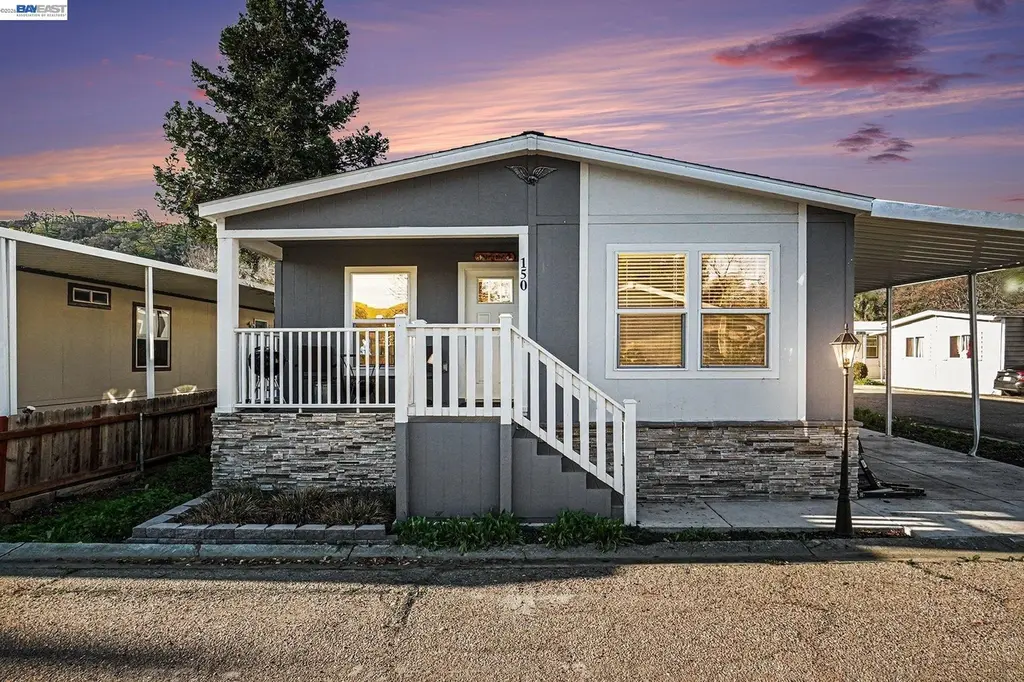
16711 Marsh Creek Rd #150 · Antioch, CA
Flood risk 8/10 · Major
- FEMA flood zone
- X (unshaded)
- Chance of flooding over 30 yrs
- 0.99%
- Est. flood insurance / yr
- $507 – $1,088
Fire risk 9/10 · Severe
- Est. fire insurance / yr
- $659 – $1,223
Heat risk 5/10 · Moderate
- Hot days now (above 97°F)
- 7 days/yr
- Hot days in 30 yrs
- 15 days/yr
Wind risk 1/10 · Minimal
- Chance of severe wind over 30 yrs
- —
Air-quality risk 9/10 · Severe
- Unhealthy air days now
- 17 days/yr
- Unhealthy air days in 30 yrs
- 18 days/yr
Risk factors via First Street. Map © Google.
Why this score? — see what drove the C+ grade
The composite is a weighted blend of 9 inputs, each scored 0–100. Each bar is that input's sub-score; the figure is the points it added to the 100-point composite (weight × sub-score).
- Cash flow +30.0/30.0
- DSCR +10.0/10.0
- 1% rule +7.7/10.0
- Schools +5.3/10.0
- Livability +2.8/5.0
- Rent growth +2.5/5.0
- Condition / age +2.5/5.0
- ARV discount +1.5/15.0
- Appreciation +0.0/10.0
$289,000
🖨 Deal sheet 📄 Offer letter ✓ Due diligence
Listing remarks MLS
Super Value! This mobile home is like new. This house has many upgrades. Upgrade Kitchen, tile, fresh paint inside and outside. Great and quiet neighborhood!
Key facts
- Community pool
- Listed 92 days
Property features AI
Finance
- HOA & community: Park community with shared amenities (pool, playground, greenbelt, BBQ area)
Exterior
- Parking: Covered carport for 2 or more vehicles
- Utilities: Water and sewer: community services; Power: standard utility connections
- Home design: Manufactured in park (mobile home); Double wide model (Tempo Series); Faces northwest; Corner, premium lot
- Construction: Aluminum siding; Lap skirt (skirting)
- Exterior features: Deck; Front porch; Garden/play area; Low-maintenance landscaping; Community pool (in-ground, private within community); Community BBQ area; Playground; Greenbelt
Interior
- Kitchen: Eat-in kitchen; Laminate countertops; Dishwasher; Electric range
- Bedrooms: 7 total rooms (includes den and family room)
- Flooring: Laminate flooring; Carpet
- Bathrooms: 2 bathrooms (both full)
- Heating & cooling: Natural gas heating; Central air; Ceiling fans
- Interior features: Den; Family room; Sun porch
- Laundry & utility: Laundry room with washer and dryer
Neighborhood map
What this means for you Summary
Snapshot
- This is a 3-bed/2.0-bath manufactured listed at $289k.
Deal economics
- At list price, monthly cash flow is $1k ($13k/yr) — positive.
- The deal already cash-flows at list — no discount required.
- Meets the 1% rule at list price ($4k rent vs $289k).
- Recommended offer: $263k (9.0% below list) — sets the bar for market timing.
- Cap rate 11.1% vs local median 3.9% in Antioch — top-decile yield for the area; either an underpriced asset or a hidden risk that comps aren't pricing in. Stress-test before assuming the spread holds.
Location & tenants
- Location reads 56/100 on livability (#782 in CA) — a working-class tenant base; expect higher turnover. Strengths: employment A+, housing A+, health & safety A; Watch: schools F, crime F, amenities F.
- Brentwood Union Elementary (suburban): math 51% / reading 59% proficiency, ranked #268 of 1,400 in CA (top 19%) — acceptable for families but not a draw, mixed tenant base, ~2y average lease.
- Market conditions: 56 active listings in the ZIP; 2,169 units permitted in Contra Costa County in 2024 (896 in 5+ unit buildings).
Forward outlook
- Local home prices are declining (-3.0%/yr); year-one equity from $2k of loan paydown is wiped out by about $9k of value loss. Plan a longer hold.
- Contra Costa County population projected at +26% by 2050 — long-run rental-demand tailwind backs the buy-and-hold thesis.
- At projected returns (-3.0% appreciation + 3.0% rent growth), your $81k cash investment doubles in ~8 years — after that, you're playing with house money.
Negotiation context
- It's been on market 92 days — a 9% lower offer ($263k) is reasonable based on typical stale-listing flexibility.
- 3 sale attempts since 20y ago with the ask held roughly flat each time — persistent listings suggest the price (not the market) is what's stuck; bring a comps-based counter.
- Current owner paid $60k; list at $289k implies a 382% gain — meaningful room to come down on a strong offer.
Risks & watch-outs
- Watch-outs: flood insurance adds $66/mo.
- Climate carrying-cost: severe flood risk; severe wildfire risk; extreme-heat days projected 7→15/yr by 2055 (HVAC capex compounding) — expect insurance premiums to compound above CPI over the hold.
Questions for the listing agent
- It's been on market 92 days. Have you received any prior offers? Is the seller open to a 9% concession, seller financing, or rate buy-down credit?
- What's the actual annual flood-insurance premium (NFIP or private), and is the property in a SFHA with mandatory coverage?
- Why hasn't it sold? Are there any deal-killer items the seller is aware of (foundation, flood, title, zoning, code violations)?
- Is there a deadline driving the sale (1031 exchange, divorce, estate, relocation)? That informs how much negotiation room exists.
- Schools are F-rated, which usually means shorter tenancies and higher turnover. Who's the typical renter profile here, and what's been the actual vacancy rate?
- Crime grade is F in this area — have there been break-ins, vandalism, or insurance claims at this property in the last 3 years? What carrier currently insures it and at what premium?
- What's the average days-on-market for RENTAL listings here right now (not sales)? A rising rental-DOM trend means longer vacancies and softer asking-rent achievability than the comps imply.
- What's the recent tenant-quality profile in this submarket — average credit score on applications, eviction rate, late-payment / NSF rate, and stable-employment percentage? A property-management company in the area should have these aggregated.
- How much new for-sale + rental construction is in the pipeline within 1–3 miles? Heavy new supply typically softens prices + rents 12–24 months out; constrained supply supports both.
Investment metrics
- 1% rule
- 1.27% ✓
- Cap rate
- 11.07%
- Cash-on-cash
- 17.05%
- DSCR
- 1.76
- GRM
- 6.6
CMA / ARV
- ARV (on-the-fly)
- $254,880
- Comps found
- 10
Show comp detail 10 sales within ~0.75 mi
| Address | Dist | Beds/Ba | Sqft | Sold | Price | $/sf | Match |
|---|---|---|---|---|---|---|---|
| 16711 Marsh Creek Rd #52 | 0.00mi | 3/2.0 | 1,416 (-2%) | 15mo | $250,000 | $177 | 84 |
| 16711 Marsh Creek Rd #88 | 0.00mi | 3/2.0 | 1,368 (-5%) | 14mo | $185,000 | $135 | 80 |
| 16711 Marsh Creek Rd #68 | 0.10mi | 4/2.0 (+1) | 1,404 (-2%) | 8mo | $260,000 | $185 | 80 |
| 16711 Marsh Creek Rd #175 | 0.00mi | 4/2.0 (+1) | 1,460 (+1%) | 17mo | $216,000 | $148 | 78 |
| 16711 Marsh Creek Rd #66 | 0.10mi | 3/2.0 | 1,352 (-6%) | 10mo | $255,000 | $189 | 76 |
| 16711 Marsh Creek Rd #126 | 0.00mi | 3/2.0 | 1,300 (-10%) | 10mo | $182,000 | $140 | 76 |
| 16711 Marsh Creek Rd #65 | 0.10mi | 2/2.0 (-1) | 1,426 (-1%) | 18mo | $249,999 | $175 | 74 |
| 16711 Marsh Creek Rd #63 | 0.00mi | 3/2.0 | 1,300 (-10%) | 14mo | $245,000 | $188 | 72 |
| 16711 Marsh Creek Rd #29 | 0.00mi | 3/2.0 | 1,558 (+8%) | 20mo | $240,000 | $154 | 69 |
| 16711 Marsh Creek Rd #135 | 0.00mi | 3/2.0 | 1,248 (-13%) | 20mo | $221,000 | $177 | 61 |
Match score weights: distance 35% · size 25% · config 20% · recency 20%. Top-matched comps best support the ARV.
Projected returns pro-forma
-3.0% appreciation · 3.0% rent growth · sell at horizon
- IRR
- 7.0%
- Equity multiple
- 1.27×
- Total profit
- $22,123
- Equity at exit
- $43,091
- IRR
- 16.3%
- Equity multiple
- 2.33×
- Total profit
- $107,896
- Equity at exit
- $24,987
Cash invested: $80,920 (down + closing). Projections, not guarantees.
Landlord ↔ Tenant lean methodology
- Overall (STATE)
- 18 Strongly Tenant-Friendly
- State California
- 18 Strongly Tenant-Friendly · D+13
- County
- — inherits STATE
- City
- — inherits STATE
ZIP-level market 94517
- Active inventory
- 56
- Price-to-rent
- 6.6×
Monthly cashflow live
- Estimated rent
- $3,669 medium interval (Pro) →
- Mortgage (P&I)
- −$1,516
- Tax from tax record
- −$112 /mo · $1,349/yr
- Insurance
- −$120
- Flood insurance flood zone
- −$66 /mo · $798/yr
- HOA
- −$0
- Vacancy / Maint / Mgmt
- −$770
- Net cashflow
- $1,084
Break-even live
UW: 25.0% down · 7.5% · 30yr · 1.5% tax · 5.0% vac · 8.0% maint · 8.0% mgmt
Financing live
Cash to close
- Down payment
- $72,250
- Closing costs
- $8,670
- Reserves months
- —
- Total cash needed
- —
Loan-product check · same deal, 3 products live
Conventional
25% down · 7.5% · 30yr
- Down + closing
- —
- Monthly P&I
- —
- Monthly cashflow
- —
- DSCR
- —
- Eligible?
- —
Personal DTI + credit; lowest rate.
DSCR
20% down · 8.5% · 30yr
- Down + closing
- —
- Monthly P&I
- —
- Monthly cashflow
- —
- DSCR
- —
- Eligible?
- —
No personal income docs; deal must DSCR.
Hard money
10% down · 12.0% · 12mo
- Down + closing
- —
- Monthly P&I
- —
- Monthly cashflow
- —
- DSCR
- —
- Eligible?
- —
Short-term bridge; refi at stabilization.
Listing history 20 events
-
2026-06-18days on market $289,000 Active 92 DOM
-
2026-06-17days on market $289,000 Active 91 DOM
-
2026-06-16days on market $289,000 Active 90 DOM
-
2026-06-15days on market $289,000 Active 89 DOM
-
2026-06-13days on market $289,000 Active 87 DOM
-
2026-06-13days on market $289,000 Active 86 DOM
-
2026-06-09days on market $289,000 Active 83 DOM
-
2026-06-08days on market $289,000 Active 82 DOM
-
2026-06-07days on market $289,000 Active 81 DOM
-
2026-06-04days on market $289,000 Active 78 DOM
-
2026-06-03days on market $289,000 Active 77 DOM
-
2026-06-02days on market $289,000 Active 76 DOM
-
2026-06-01days on market $289,000 Active 75 DOM
-
2026-05-31days on market $289,000 Active 74 DOM
-
2026-03-18$289,000 Active
-
2026-03-18historical
-
2026-01-13Active
-
2006-09-30soldstatus $60,000 158-char remark
Show marketing remark (158 chars)
Super Value! This mobile home is like new. This house has many upgrades. Upgrade Kitchen, tile, fresh paint inside and outside. Great and quiet neighborhood!
-
2006-08-16historical 158-char remark
Show marketing remark (158 chars)
Super Value! This mobile home is like new. This house has many upgrades. Upgrade Kitchen, tile, fresh paint inside and outside. Great and quiet neighborhood!
-
2006-08-05$63,000 158-char remark
Show marketing remark (158 chars)
Super Value! This mobile home is like new. This house has many upgrades. Upgrade Kitchen, tile, fresh paint inside and outside. Great and quiet neighborhood!
ⓘ Source: listings_history table (triggers on properties + properties_extension) + one-shot
backfill from property_details.listing_events for pre-trigger history.
Tax reassessment forecast CA · Resets to sale price
- Current annual tax
- $1,349 · $112/mo
- Projected year-2 tax
- $2,196 · $183/mo
- Expected delta
- +$847/yr (+$71/mo · 62.8%)
ⓘ Screening estimate from a state-policy table — verify with the county assessor before closing.
Climate risk First Street
- Flood 8/10 Severe FEMA zone X (unshaded) · 99% chance over 30 yrs
- Wildfire 9/10 Extreme
- Heat 5/10 Major 7 d/yr ≥97°F today · 15 d/yr by 30 yrs out
- Wind 1/10 Low
- Air quality 9/10 Extreme 17 unhealthy d/yr today · 18 by 30 yrs out
Nearby sold comps map
Loading sold comps map…
Walkable amenities ~0.75 mi
Loading nearby amenities…
Taxation est. · year 1
- Rental income
- $44,026
- − Mortgage interest
- −$16,188
- − Property taxes
- −$1,349
- − Insurance
- −$2,242
- − Repairs & maintenance
- −$3,522
- − Management
- −$3,522
- − Depreciation
- −$8,407
- Taxable income
- $8,794
- Est. tax owed @ 24.0%
- −$2,111
- After-tax cash flow
- $10,892/yr
For passive investors: Depreciation is non-cash, so a rental often shows a tax loss while cash-flowing — sheltering income. Rental losses are passive: they offset passive income freely, and up to $25,000/yr can offset ordinary (W-2) income if you actively participate and your MAGI is under $100k (phasing out to $0 by $150k); unused losses carry forward. On sale, claimed depreciation is recaptured at up to 25%, and gains may owe capital-gains tax (a 1031 exchange can defer both). Figures are a year-1 estimate at your 24.0% rate — not tax advice; consult a CPA.
Schools (NCES district)
- District
- Brentwood Union Elementary
- NCES district ID
- 0605910
- Math proficiency
- 51% ▲ 1.00%
- Reading proficiency
- 59% ▬ 0.00%
- Median HH income
- $91,644
- Composite
- 52.7/100
- National rank
- #3320
- State rank
- #268 of 1400 in CA
Livability — Antioch
- Score
- 56/100
- State rank
- #782
- US rank
- #22472
Category grades
Schools grade is shown separately in the Schools card above.
Census & demographics
- City population
- 116,477
- Population (ZIP)
- 12,164
Population outlook (Contra Costa County) Hauer SSP2
- Today (2025)
- 1,287,720 people
- By 2030
- 1,364,937 · +6.0%
- By 2040
- 1,506,209 · +17.0%
- By 2050
- 1,624,373 · +26.1%
- By 2075
- 1,853,193 · +43.9%
- By 2100
- 1,901,231 · +47.6%
Race, ethnicity, and origin ACS 2023
- Neighborhood character
- Predominantly White (67%)
- Race & ethnicity
- White 67% Two or more races 13% Hispanic / Latino 13% Asian 11% Black 3%
- Hispanic origin (detail)
- Mexican 5% Puerto Rican 2%
- Common ancestry
- Italian 3% Scotch-Irish 2% Lithuanian 2%
- Foreign-born
- 13% · Canada, China, Philippines
- Languages at home
- 87% English-only · Spanish 4% Russian/Polish/Slavic 2% Other Indo-European 2%
Political lean MEDSL · Contra Costa
- 2024 margin
- Solid D (+38.0) · D 67.3% · R 29.4% · Other 3.3%
- 2008→2024 swing
- +0.2pp no change · 2008: 37.8pp · 2024: 38.0pp
- All cycles
- 2024: D+38.0 2020: D+45.3 2016: D+43.5 2012: D+33.7 2008: D+37.8
Not yet ingested
- Civics
- —
Market trends
- HPI YoY
- ▼ -693.84%
- Current HPI
- 144.7139
- Rent YoY
- —
- Metro
- —
- State GDP YoY
- ▲ 3.21%
- F500 in state
- 116
Industry mix (Fortune 500 HQ in CA)
| Industry | F500 HQs | Revenue |
|---|---|---|
| Technology | 27 | $1,492B |
|
||
| Financial Services | 3 | $174B |
|
||
| Retail | 3 | $44B |
|
||
| Insurance | 3 | $26B |
|
||
| Media / Entertainment | 2 | $115B |
|
||
| Pharmaceuticals / Biotech | 2 | $62B |
|
||
Price history
+358.7% since first listed6 events — show timeline
- 2026-03-18 Listed $289,000 bridgeMLS, Bay East AOR, or Contra Costa AOR
- 2026-03-18 Listing Removed — bridgeMLS, Bay East AOR, or Contra Costa AOR
- 2026-01-13 Listed — bridgeMLS, Bay East AOR, or Contra Costa AOR
- 2006-09-30 Sold (MLS) $60,000 bridgeMLS, Bay East AOR, or Contra Costa AOR
- 2006-08-16 Listing Removed — bridgeMLS, Bay East AOR, or Contra Costa AOR
- 2006-08-05 Listed $63,000 bridgeMLS, Bay East AOR, or Contra Costa AOR
Property tax history
+17.7%/yrLatest (2025): $1,349 · +1306.1% YoY. Source: county tax records.
Cash-flow waterfall
monthlySold comps — $/sqft
last 12 mo · ≤1 miLoading sold comps…