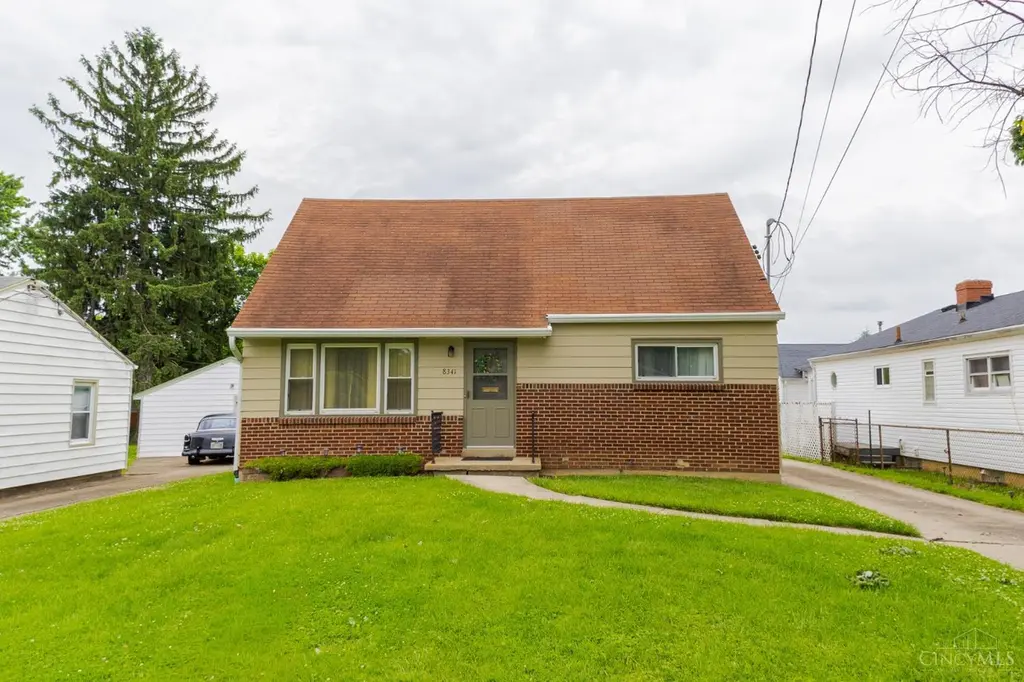
8341 Pippin Rd · Groesbeck, OH
Flood risk 1/10 · Minimal
- FEMA flood zone
- X (unshaded)
- Chance of flooding over 30 yrs
- 0.0%
- Est. flood insurance / yr
- $473 – $860
Fire risk 1/10 · Minimal
- Est. fire insurance / yr
- $713 – $1,323
Heat risk 4/10 · Minor
- Hot days now (above 103°F)
- 7 days/yr
- Hot days in 30 yrs
- 19 days/yr
Wind risk 2/10 · Minimal
- Chance of severe wind over 30 yrs
- 1.0%
Air-quality risk 2/10 · Minimal
- Unhealthy air days now
- 1 days/yr
- Unhealthy air days in 30 yrs
- 1 days/yr
Risk factors via First Street. Map © Google.
Why this score? — see what drove the D grade
The composite is a weighted blend of 9 inputs, each scored 0–100. Each bar is that input's sub-score; the figure is the points it added to the 100-point composite (weight × sub-score).
- Cash flow +12.6/30.0
- ARV discount +7.9/15.0
- Livability +4.2/5.0
- Rent growth +4.0/5.0
- DSCR +3.7/10.0
- Schools +3.7/10.0
- 1% rule +3.1/10.0
- Condition / age +2.5/5.0
- Appreciation +0.0/10.0
$222,900
🖨 Deal sheet (PDF) 📄 Offer letter ✓ Due diligence
Listing remarks
Charming, move-in ready Cape Cod with thoughtful updates throughout! The beautifully update kitchen (June 2025) features Butcher block countertops, stainless steel appliances less than a year old, and a warm, inviting feel. Main level LVP flooring, upstairs carpet, and exterior paint have all been updated within the last 5 years, plus the entire interior was freshly painted just 2 months ago. Upstairs offers spacious bedrooms and plumbing already in place for a future half bath. The unfinished basement provides excellent storage or potential additional living space. Washer and dryer stay! Outside, enjoy the large patio and convenient turn-around ability on and off Pippin Rd with plenty of p
Key facts
- 7,449 sq ft lot
- Built 1953
- Listed 25 days
Property features AI
Finance
- HOA & community: No HOA
Exterior
- Parking: Driveway
- Utilities: Public water; Public sewer; Gas at street
- Home design: Cape Cod style; Single-family home; One and one-half stories; Block foundation
- Construction: Brick and vinyl siding exterior; Vinyl windows; Shingle roof
- Exterior features: Patio; Shed; Lot approximately 50 x 150 (less than 0.5 acre)
Interior
- Kitchen: Galley kitchen with wood cabinets; Dishwasher; Gas cooktop; Microwave; Oven/Range; Refrigerator
- Bedrooms: 4 bedrooms total; Primary bedroom on level 1 (11 x 11); Bedroom 2 on level 1 (9 x 10); Bedroom 3 on level 2 (10 x 12); Bedroom 4 on level 2 (10 x 12)
- Bathrooms: 1 full bathroom on level 1
- Heating & cooling: Forced air heating (gas); Central air conditioning; Gas water heating
- Interior features: Unfinished full basement; Entry; 8 total rooms
- Laundry & utility: Washer; Dryer
Neighborhood map
What this means for you Summary
Snapshot
- This is a 4-bed/1.0-bath single-family listed at $223k.
Deal economics
- At list price, monthly cash flow is $-29 ($-352/yr) — negative.
- To cash-flow at today's rent, offer at most $218k (2.3% below list).
- To meet the 1% rule (rent ≥ 1% of price), the offer needs to be $180k (19.2% below list).
- Recommended offer: $180k (19.2% below list) — sets the bar for 1% rule.
Location & tenants
- Location reads 84/100 on livability (#48 in OH, #629 nationally) — a professional / high-income tenant draw. Strengths: amenities A+, commute A+, cost of living A+; Watch: schools D+.
- Northwest Local (suburban): math 38% / reading 46% proficiency, ranked #508 of 656 in OH (top 77%) — families likely to look elsewhere, expect single-tenant / working-renter base with shorter leases.
- Market conditions: Rents rising fast (+6.0%/yr); 58 active listings in the ZIP; 7 comparable units currently listed for rent nearby; rentals at typical pace (median 25d on market — plan ~3-4 weeks tenant-placement turnaround); 801 units permitted in Hamilton County in 2024 (190 in 5+ unit buildings).
- This rent runs 36% of the median local income ($60k/yr) — at the standard rent-burdened threshold; future hikes will face affordability resistance.
Forward outlook
- Local home prices are declining (-3.0%/yr); year-one equity from $2k of loan paydown is wiped out by about $7k of value loss. Plan a longer hold.
Negotiation context
- It's been on market 26 days — a 2% lower offer ($220k) is reasonable based on typical stale-listing flexibility.
- 2 sale attempts since 22y ago with the ask held roughly flat each time — persistent listings suggest the price (not the market) is what's stuck; bring a comps-based counter.
Risks & watch-outs
- Watch-outs: built in 1953 — expect roof / HVAC / electrical / plumbing capex.
Questions for the listing agent
- What do current leases actually rent for vs. the listed asking? Can we see a recent rent roll and the last 12 months of T-12 income?
- Built in 1953 — when were the roof, HVAC, electrical panel, plumbing, and water heater last replaced?
- Is there a deadline driving the sale (1031 exchange, divorce, estate, relocation)? That informs how much negotiation room exists.
- Schools are D-rated, which usually means shorter tenancies and higher turnover. Who's the typical renter profile here, and what's been the actual vacancy rate?
- The area grade is low — what's the realistic commute time and amenity access for the typical tenant pool here? Any planned neighborhood developments (good or bad) we should know about?
- What's the average days-on-market for RENTAL listings here right now (not sales)? A rising rental-DOM trend means longer vacancies and softer asking-rent achievability than the comps imply.
- What's the recent tenant-quality profile in this submarket — average credit score on applications, eviction rate, late-payment / NSF rate, and stable-employment percentage? A property-management company in the area should have these aggregated.
- How much new for-sale + rental construction is in the pipeline within 1–3 miles? Heavy new supply typically softens prices + rents 12–24 months out; constrained supply supports both.
Investment metrics
- 1% rule
- 0.81% ✗
- Cap rate
- 6.14%
- Cash-on-cash
- -0.56%
- DSCR
- 0.97
- GRM
- 10.3
CMA / ARV
- ARV (on-the-fly)
- $225,024
- Comps found
- 12
Show comp detail 12 sales within ~0.75 mi
| Address | Dist | Beds/Ba | Sqft | Sold | Price | $/sf | Match |
|---|---|---|---|---|---|---|---|
| 8729 Morningstar Ln | 0.50mi | 3/1.0 (-1) | 1,040 (-11%) | 2mo | $200,000 | $192 | 52 |
| 2351 Mercury Ave | 0.50mi | 3/2.0 (-1) | 1,040 (-11%) | 0mo | $232,000 | $223 | 49 |
| 8724 Neptune Dr | 0.52mi | 3/2.0 (-1) | 1,040 (-11%) | 2mo | $210,000 | $202 | 46 |
| 2035 Carpenter Dr | 0.62mi | 3/2.0 (-1) | 1,270 (+8%) | 6mo | $225,500 | $178 | 43 |
| 8796 Neptune Dr | 0.63mi | 3/2.0 (-1) | 1,040 (-11%) | 1mo | $205,000 | $197 | 42 |
| 8695 Neptune Dr | 0.48mi | 3/1.5 (-1) | 1,040 (-11%) | 12mo | $192,000 | $185 | 42 |
| 7068 Mulberry St | 0.74mi | 3/1.5 (-1) | 1,096 (-6%) | 8mo | $203,000 | $185 | 40 |
| 8777 Morningstar Ln | 0.60mi | 3/1.5 (-1) | 1,040 (-11%) | 15mo | $217,500 | $209 | 34 |
| 2389 Aquarius Dr | 0.63mi | 3/2.0 (-1) | 1,040 (-11%) | 12mo | $219,900 | $211 | 33 |
| 2015 Dallas Ave | 0.73mi | 3/1.0 (-1) | 1,295 (+10%) | 14mo | $120,000 | $93 | 32 |
| 2033 Sundale Ave | 0.71mi | 4/3.0 | 1,344 (+15%) | 4mo | $230,000 | $171 | 31 |
| 8865 Neptune Dr | 0.72mi | 3/1.5 (-1) | 1,040 (-11%) | 14mo | $194,000 | $187 | 29 |
Match score weights: distance 35% · size 25% · config 20% · recency 20%. Top-matched comps best support the ARV.
Projected returns pro-forma
-3.0% appreciation · 6.0% rent growth · sell at horizon
- IRR
- -14.1%
- Equity multiple
- 0.48×
- Total profit
- $-32,410
- Equity at exit
- $33,235
- IRR
- -1.3%
- Equity multiple
- 0.90×
- Total profit
- $-6,285
- Equity at exit
- $19,272
Cash invested: $62,412 (down + closing). Projections, not guarantees.
Landlord ↔ Tenant lean methodology
- Overall (STATE)
- 73 Landlord-Friendly
- State Ohio
- 73 Landlord-Friendly · R+6
- County
- — inherits STATE
- City
- — inherits STATE
ZIP-level market 45239
- Home prices YoY
- -32.8%
- Rents YoY
- 6.0%
- Active inventory
- 58
- Price-to-rent
- 10.3×
Monthly cashflow live
- Estimated rent
- $1,802 high interval (Pro) →
- Mortgage (P&I)
- −$1,169
- Tax from tax record
- −$191 /mo · $2,291/yr
- Insurance
- −$93
- HOA
- −$0
- Vacancy / Maint / Mgmt
- −$378
- Net cashflow
- $-29
Break-even live
Sensitivity live
| Price | -10% $97 | -5% $34 | +0% $-29 | +5% $-92 | +10% $-155 |
|---|---|---|---|---|---|
| Rent | -10% $-172 | -5% $-100 | +0% $-29 | +5% $42 | +10% $113 |
| Rate | -1.0pp $83 | -0.5pp $27 | base $-29 | +0.5pp $-87 | +1.0pp $-146 |
UW: 25.0% down · 7.5% · 30yr · 1.5% tax · 5.0% vac · 8.0% maint · 8.0% mgmt
Financing live
Cash to close
- Down payment
- $55,725
- Closing costs
- $6,687
- Reserves months
- —
- Total cash needed
- —
Loan-product check · same deal, 3 products live
Conventional
25% down · 7.5% · 30yr
- Down + closing
- —
- Monthly P&I
- —
- Monthly cashflow
- —
- DSCR
- —
- Eligible?
- —
Personal DTI + credit; lowest rate.
DSCR
20% down · 8.5% · 30yr
- Down + closing
- —
- Monthly P&I
- —
- Monthly cashflow
- —
- DSCR
- —
- Eligible?
- —
No personal income docs; deal must DSCR.
Hard money
10% down · 12.0% · 12mo
- Down + closing
- —
- Monthly P&I
- —
- Monthly cashflow
- —
- DSCR
- —
- Eligible?
- —
Short-term bridge; refi at stabilization.
Rent comps 7 comps
| Address | Beds | Baths | Sqft | Rent | $/sqft | DOM | Units | Dist |
|---|---|---|---|---|---|---|---|---|
| 8879 Zodiac Dr Cincinnati, OH | 3.0 | 2.0 | 1040 | $1,781 | $1.71 | 25d | 1 | 0.67mi |
| 6834 Betts Ave Cincinnati, OH | 4.0 | 1.5 | 1426 | $1,695 | $1.19 | 25d | 1 | 0.89mi |
| 7032 La Boiteaux Ave Cincinnati, OH | 4.0 | 1.0 | 1200 | $1,800 | $1.50 | 25d | 1 | 0.90mi |
| 9128 Orangewood Dr Cincinnati, OH | 4.0 | 1.0 | 1359 | $1,495 | $1.10 | 25d | 1 | 1.02mi |
| 1908 Emerson Ave Cincinnati, OH | 4.0 | 1.0 | 760 | $1,550 | $2.04 | 25d | 1 | 1.03mi |
| 1740 Bising Ave North College Hill, OH | 3.0 | 2.0 | 1235 | $1,697 | $1.37 | 3d | 6 | 1.12mi |
| 9500 Ridgemoor Ave Cincinnati, OH | 3.0 | 1.0 | 1344 | $1,600 | $1.19 | 9d | 1 | 1.47mi |
Listing history 20 events
-
2026-06-21days on market $222,900 Active 26 DOM
-
2026-06-21days on market $222,900 Active 25 DOM
-
2026-06-18price $222,900 Active 23 DOM
-
2026-06-18days on market $229,000 Active 23 DOM
-
2026-06-17days on market $229,000 Active 22 DOM
-
2026-06-16days on market $229,000 Active 21 DOM
-
2026-06-15days on market $229,000 Active 20 DOM
-
2026-06-13days on market $229,000 Active 18 DOM
-
2026-06-12days on market $229,000 Active 17 DOM
-
2026-06-09days on market $229,000 Active 14 DOM
-
2026-06-08days on market $229,000 Active 13 DOM
-
2026-06-08days on market $229,000 Active 12 DOM
-
2026-06-07days on market $229,000 Active 11 DOM
-
2026-06-04days on market $229,000 Active 8 DOM
-
2026-06-02days on market $229,000 Active 7 DOM
-
2026-06-01days on market $229,000 Active 6 DOM
-
2026-05-31days on market $229,000 Active 5 DOM
-
2026-05-27$229,000 Active
-
2004-11-17historical
-
2004-08-17$98,500
ⓘ Source: listings_history table (triggers on properties + properties_extension) + one-shot
backfill from property_details.listing_events for pre-trigger history.
Tax reassessment forecast OH · Partial reset (capped growth)
- Current annual tax
- $2,291 · $191/mo
- Projected year-2 tax
- $2,884 · $240/mo
- Expected delta
- +$593/yr (+$49/mo · 25.9%)
ⓘ Screening estimate from a state-policy table — verify with the county assessor before closing.
Climate risk First Street
- Flood 1/10 Low FEMA zone X (unshaded) · 0% chance over 30 yrs
- Wildfire 1/10 Low
- Heat 4/10 Moderate 7 d/yr ≥103°F today · 19 d/yr by 30 yrs out
- Wind 2/10 Low 100% chance of damaging wind over 30 yrs
- Air quality 2/10 Low 1 unhealthy d/yr today · 1 by 30 yrs out
Nearby sold comps map
Loading sold comps map…
Walkable amenities ~0.75 mi
Loading nearby amenities…
Taxation est. · year 1
- Rental income
- $21,621
- − Mortgage interest
- −$12,486
- − Property taxes
- −$2,291
- − Insurance
- −$1,114
- − Repairs & maintenance
- −$1,730
- − Management
- −$1,730
- − Depreciation
- −$6,484
- Taxable loss
- −$4,214
- Est. tax savings @ 24.0%
- +$1,011
- After-tax cash flow
- $660/yr
For passive investors: Depreciation is non-cash, so a rental often shows a tax loss while cash-flowing — sheltering income. Rental losses are passive: they offset passive income freely, and up to $25,000/yr can offset ordinary (W-2) income if you actively participate and your MAGI is under $100k (phasing out to $0 by $150k); unused losses carry forward. On sale, claimed depreciation is recaptured at up to 25%, and gains may owe capital-gains tax (a 1031 exchange can defer both). Figures are a year-1 estimate at your 24.0% rate — not tax advice; consult a CPA.
Schools (NCES district)
- District
- Northwest Local
- NCES district ID
- 3904736
- Math proficiency
- 38% ▼ -18.00%
- Reading proficiency
- 46% ▼ -10.00%
- Median HH income
- $58,765
- Composite
- 36.97/100
- National rank
- #4528
- State rank
- #508 of 656 in OH
Livability — Groesbeck
- Score
- 84/100
- State rank
- #48
- US rank
- #629
Category grades
Schools grade is shown separately in the Schools card above.
Census & demographics
- Census place
- Groesbeck, OH
- County
- Hamilton County · 701,295 people
- Metro
- Cincinnati, OH-KY-IN
- Population (ZIP)
- 29,607
- Household income
- $60,324
- Rent vs Own
- Severe rent burden
- 1566.0
Population outlook (Hamilton County) Hauer SSP2
- Today (2025)
- 826,054 people
- By 2030
- 830,947 · +0.6%
- By 2040
- 832,319 · +0.8%
- By 2050
- 822,428 · -0.4%
- By 2075
- 788,688 · -4.5%
- By 2100
- 710,674 · -14.0%
Race, ethnicity, and origin ACS 2023
- Neighborhood character
- Diverse neighborhood (Simpson 0.63)
- Race & ethnicity
- White 50% Black 35% Two or more races 8% Hispanic / Latino 4% Asian 4%
- Common ancestry
- Lithuanian 2% Slovak 1% Italian 1%
- Foreign-born
- 4% · India, Canada
- Languages at home
- 93% English-only · Other Indo-European 3% Spanish 2%
Political lean MEDSL · Hamilton
- 2024 margin
- D (+14.9) · D 57.0% · R 42.1%
- 2008→2024 swing
- +7.9pp toward D · 2008: 7.0pp · 2024: 14.9pp
- All cycles
- 2024: D+14.9 2020: D+15.9 2016: D+9.5 2012: D+4.9 2008: D+7.0
Not yet ingested
- Civics
- —
Market trends
- HPI YoY
- ▼ -114.46%
- Current HPI
- 234.6033
- Rent YoY
- ▲ 6.00%
- Metro
- Cincinnati, OH-KY-IN
- State GDP YoY
- ▲ 1.98%
- F500 in state
- 48
Industry mix (Fortune 500 HQ in OH)
| Industry | F500 HQs | Revenue |
|---|---|---|
| Insurance | 3 | $145B |
|
||
| Industrial Machinery | 3 | $49B |
|
||
| Financial Services | 3 | $24B |
|
||
| Consumer Goods | 2 | $93B |
|
||
| Aerospace / Defense | 2 | $47B |
|
||
| Utilities | 2 | $33B |
|
||
Price history
+132.5% since first listed3 events — show timeline
- 2026-05-27 Listed $229,000 Cincy MLS
- 2004-11-17 Listing Removed — Cincy MLS
- 2004-08-17 Listed $98,500 Cincy MLS
Property tax history
+8.1%/yrLatest (2025): $2,291 · +7.8% YoY. Source: county tax records.
Cash-flow waterfall
monthlySold comps — $/sqft
last 12 mo · ≤1 miLoading sold comps…