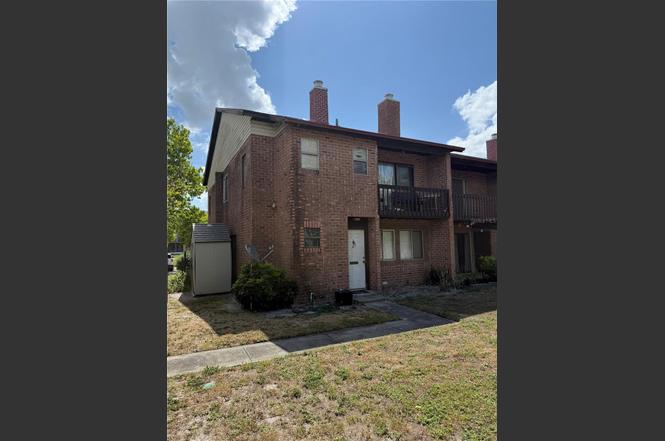
5032 Downing St #10 · Orlando, FL
Flood risk 1/10 · Minimal
- FEMA flood zone
- X (unshaded)
- Chance of flooding over 30 yrs
- 0.0%
- Est. flood insurance / yr
- $507 – $1,088
Fire risk 1/10 · Minimal
- Est. fire insurance / yr
- $947 – $1,759
Heat risk 9/10 · Severe
- Hot days now (above 108°F)
- 7 days/yr
- Hot days in 30 yrs
- 24 days/yr
Wind risk 9/10 · Severe
- Chance of severe wind over 30 yrs
- 99.0%
Air-quality risk 1/10 · Minimal
- Unhealthy air days now
- 0 days/yr
- Unhealthy air days in 30 yrs
- 0 days/yr
Risk factors via First Street. Map © Google.
Why this score? — see what drove the D grade
The composite is a weighted blend of 9 inputs, each scored 0–100. Each bar is that input's sub-score; the figure is the points it added to the 100-point composite (weight × sub-score).
- Cash flow +13.0/30.0
- ARV discount +7.5/15.0
- 1% rule +5.9/10.0
- Livability +4.3/5.0
- Schools +4.1/10.0
- DSCR +3.9/10.0
- Condition / age +2.5/5.0
- Rent growth +2.4/5.0
- Appreciation +0.0/10.0
$136,500
🖨 Deal sheet (PDF) 📄 Offer letter ✓ Due diligence
Listing remarks MLS
Great location. Central. Near bus station. Minutes from I-4 and Area Malls. Community offers pool, tennis courts and playground
Key facts
- Clubhouse
- Private balcony
- Pool and spa
Tags
Property features AI
Finance
- Other: Property type classified as Residential, zoning R-3
- Financial info: Total monthly fees $296; total annual fees $3,552; Lease restrictions apply
- HOA & community: HOA required (Huntington on the Green) — $296/month; HOA covers pool, structure maintenance, grounds maintenance, and security; Association approval required; Community amenities include playground, pool, and tennis courts; Pets allowed (cats and dogs) with breed restrictions
Exterior
- Utilities: Public water; Public sewer; Public utilities
- Home design: Townhouse; Residential property; Two levels; Faces east; Entry on slab foundation
- Construction: Stucco construction; Shingle roof; Slab foundation; Built as building number 5032
- Exterior features: Balcony; Asphalt road access
Interior
- Kitchen: Built-in oven
- Bedrooms: 2 bedrooms
- Flooring: Carpet
- Bathrooms: 1 full bath; 1 half bath
- Heating & cooling: Central heating; Central air conditioning
- Interior features: Ceiling fans
- Laundry & utility: Inside laundry
Neighborhood map
What this means for you Summary
Snapshot
- This is a 2-bed/2.0-bath condo listed at $136k.
Deal economics
- At list price, monthly cash flow is $-7 ($-89/yr) — negative.
- To cash-flow at today's rent, offer at most $135k (1.0% below list).
- Meets the 1% rule at list price ($1k rent vs $136k).
- Recommended offer: $128k (6.0% below list) — sets the bar for market timing.
- Cap rate 6.2% vs local median 3.0% in Orlando — top-decile yield for the area; either an underpriced asset or a hidden risk that comps aren't pricing in. Stress-test before assuming the spread holds.
Location & tenants
- Location reads 86/100 on livability (#12 in FL, #360 nationally) — a professional / high-income tenant draw. Strengths: amenities A+, commute A+, housing A+.
- Orange (suburban): math 46% / reading 51% proficiency, ranked #43 of 73 in FL (top 59%) — families likely to look elsewhere, expect single-tenant / working-renter base with shorter leases.
- Zoned schools: Palmetto Elementary (math 31% / reading 33%, grade F, #1,797 of 2,144 statewide, top 86%, 805 students, 75% FRL); Westridge Middle (math 33% / reading 30%, grade F, #453 of 571 statewide, top 81%, 1,207 students, 68% FRL); Oak Ridge High (math 17% / reading 27%, grade F, #544 of 667 statewide, top 82%, 2,477 students, 66% FRL).
- Zoned-school proficiency averages 28% at this address vs 48% district-wide (-20 pts) — the specific schools serving this property underperform the Orange average; the district grade overstates school quality for this exact location.
- Market conditions: Rents soft (-0.5%/yr); 224 active listings in the ZIP; 40 comparable units currently listed for rent nearby; rentals at typical pace (median 26d on market — plan ~3-4 weeks tenant-placement turnaround); 8,053 units permitted in Orange County in 2024 (3,133 in 5+ unit buildings).
- This rent runs 38% of the median local income ($47k/yr) — at the standard rent-burdened threshold; future hikes will face affordability resistance.
Forward outlook
- Local home prices are declining (-3.0%/yr); year-one equity from $944 of loan paydown is wiped out by about $4k of value loss. Plan a longer hold.
- Orange County population projected at +52% by 2050 — long-run rental-demand tailwind backs the buy-and-hold thesis.
Negotiation context
- It's been on market 89 days — a 6% lower offer ($128k) is reasonable based on typical stale-listing flexibility.
- 4 sale attempts since 18y ago with the ask held roughly flat each time — persistent listings suggest the price (not the market) is what's stuck; bring a comps-based counter.
- Current owner paid $75k; list at $136k implies a 82% gain — meaningful room to come down on a strong offer.
Risks & watch-outs
- Climate carrying-cost: severe wind risk, 99% chance of damaging wind over 30y; extreme-heat days projected 7→24/yr by 2055 (HVAC capex compounding) — expect insurance premiums to compound above CPI over the hold.
Questions for the listing agent
- What do current leases actually rent for vs. the listed asking? Can we see a recent rent roll and the last 12 months of T-12 income?
- It's been on market 89 days. Have you received any prior offers? Is the seller open to a 6% concession, seller financing, or rate buy-down credit?
- Built in 1974 — when were the roof, HVAC, electrical panel, plumbing, and water heater last replaced?
- What does the HOA fee cover, when was the last increase, and are there any pending special assessments or reserve-fund shortfalls?
- Any open or pending special assessments — roof, HVAC, plumbing, elevator, façade? What's the per-unit balance and payoff schedule, and is the seller paying it off at close or rolling it to the buyer?
- Why hasn't it sold? Are there any deal-killer items the seller is aware of (foundation, flood, title, zoning, code violations)?
- Is there a deadline driving the sale (1031 exchange, divorce, estate, relocation)? That informs how much negotiation room exists.
- Schools are B-rated — typically a magnet for longer-tenancy family renters. What's the average tenant stay here, and is there a school-zone premium baked into asking?
- The area grade is low — what's the realistic commute time and amenity access for the typical tenant pool here? Any planned neighborhood developments (good or bad) we should know about?
- What's the average days-on-market for RENTAL listings here right now (not sales)? A rising rental-DOM trend means longer vacancies and softer asking-rent achievability than the comps imply.
- What's the recent tenant-quality profile in this submarket — average credit score on applications, eviction rate, late-payment / NSF rate, and stable-employment percentage? A property-management company in the area should have these aggregated.
- How much new apartment / multifamily construction is in the pipeline within 1–3 miles? Heavy new supply (>2% of stock underway) typically softens rents 12–24 months out; light construction supports rent growth.
Investment metrics
- 1% rule
- 1.09% ✓
- Cap rate
- 6.23%
- Cash-on-cash
- -0.23%
- DSCR
- 0.99
- GRM
- 7.6
CMA / ARV
No comps found within radius.
Projected returns pro-forma
-3.0% appreciation · 0.0% rent growth · sell at horizon
- IRR
- -20.9%
- Equity multiple
- 0.30×
- Total profit
- $-26,796
- Equity at exit
- $20,353
- IRR
- -26.6%
- Equity multiple
- -0.05×
- Total profit
- $-40,159
- Equity at exit
- $11,802
Cash invested: $38,220 (down + closing). Projections, not guarantees.
Landlord ↔ Tenant lean methodology
- Overall (STATE)
- 87 Strongly Landlord-Friendly
- State Florida
- 87 Strongly Landlord-Friendly · R+3
- County
- — inherits STATE
- City
- — inherits STATE
ZIP-level market 32839
- Home prices YoY
- -20.1%
- Rents YoY
- -0.5%
- Active inventory
- 224
- Price-to-rent
- 7.6×
Monthly cashflow live
- Estimated rent
- $1,494 high interval (Pro) →
- Mortgage (P&I)
- −$716
- Tax from tax record
- −$119 /mo · $1,427/yr
- Insurance
- −$57
- HOA
- −$296
- Vacancy / Maint / Mgmt
- −$314
- Net cashflow
- $-7
Break-even live
Sensitivity live
| Price | -10% $70 | -5% $31 | +0% $-7 | +5% $-46 | +10% $-85 |
|---|---|---|---|---|---|
| Rent | -10% $-125 | -5% $-66 | +0% $-7 | +5% $52 | +10% $111 |
| Rate | -1.0pp $61 | -0.5pp $27 | base $-7 | +0.5pp $-43 | +1.0pp $-79 |
UW: 25.0% down · 7.5% · 30yr · 1.5% tax · 5.0% vac · 8.0% maint · 8.0% mgmt
Financing live
Cash to close
- Down payment
- $34,125
- Closing costs
- $4,095
- Reserves months
- —
- Total cash needed
- —
Loan-product check · same deal, 3 products live
Conventional
25% down · 7.5% · 30yr
- Down + closing
- —
- Monthly P&I
- —
- Monthly cashflow
- —
- DSCR
- —
- Eligible?
- —
Personal DTI + credit; lowest rate.
DSCR
20% down · 8.5% · 30yr
- Down + closing
- —
- Monthly P&I
- —
- Monthly cashflow
- —
- DSCR
- —
- Eligible?
- —
No personal income docs; deal must DSCR.
Hard money
10% down · 12.0% · 12mo
- Down + closing
- —
- Monthly P&I
- —
- Monthly cashflow
- —
- DSCR
- —
- Eligible?
- —
Short-term bridge; refi at stabilization.
Rent comps 40 comps
| Address | Beds | Baths | Sqft | Rent | $/sqft | DOM | Units | Dist |
|---|---|---|---|---|---|---|---|---|
| 5214 Via Hacienda Cir Apt 207 Orlando, FL | 2.0 | 2.0 | 1073 | $1,500 | $1.40 | 0d | 1 | 0.07mi |
| 5208 Via Hacienda Cir Unit 101 Orlando, FL | 2.0 | 2.0 | 1073 | $2,000 | $1.86 | 25d | 1 | 0.07mi |
| 2691 Charleston Town Pl Orlando, FL | 1.0–3.0 | 1.0–2.0 | 1199 | $1,988 | $1.66 | 0d | 20 | 0.08mi |
| 5226 Via Hacienda Cir Unit A116 Orlando, FL | 2.0 | 2.0 | 934 | $1,350 | $1.45 | 25d | 1 | 0.08mi |
| 5226 Via Hacienda Cir Unit A313 Orlando, FL | 2.0 | 2.0 | 934 | $1,400 | $1.50 | 4d | 1 | 0.08mi |
| 5226 Via Hacienda Cir Unit A215 Orlando, FL | 2.0 | 2.0 | 1073 | $1,550 | $1.44 | 25d | 1 | 0.08mi |
| 5219 Via Hacienda Cir Unit B209 Orlando, FL | 2.0 | 2.0 | 1073 | $1,500 | $1.40 | 18d | 1 | 0.11mi |
| 5225 Via Hacienda Cir Unit B115 Orlando, FL | 2.0 | 2.0 | 1073 | $1,480 | $1.38 | 25d | 1 | 0.12mi |
| 5124 Park Central Dr #517 Orlando, FL | 2.0 | 2.0 | 874 | $1,700 | $1.95 | 15d | 1 | 0.13mi |
| 5124 Park Central Dr Orlando, FL | 2.0 | 2.0 | 874 | $1,648 | $1.89 | 25d | 2 | 0.13mi |
| 4789 S Texas Ave Apt A Orlando, FL | 2.0 | 2.0 | 976 | $1,500 | $1.54 | 9d | 1 | 0.13mi |
| 2342 Huntington Green Ct #2 Orlando, FL | 2.0 | 1.5 | 996 | $1,300 | $1.31 | 23d | 1 | 0.14mi |
| 2352 Huntington Green Ct #7 Orlando, FL | 2.0 | 1.5 | 996 | $1,400 | $1.41 | 25d | 1 | 0.14mi |
| 2203 Yankee Pl #427 Orlando, FL | 1.0 | 1.0 | 605 | $1,325 | $2.19 | 6d | 1 | 0.15mi |
| 4703 S Texas Ave Unit A Orlando, FL | 1.0 | 1.0 | 756 | $1,200 | $1.59 | 25d | 1 | 0.18mi |
| 2210 Yankee Pl #316 Orlando, FL | 1.0 | 1.0 | 535 | $1,375 | $2.57 | 25d | 1 | 0.18mi |
| 2210 Yankee Pl #334 Orlando, FL | 1.0 | 1.0 | 535 | $1,195 | $2.23 | 16d | 1 | 0.18mi |
| 4711 S Texas Ave Unit 4711A Orlando, FL | 2.0 | 2.0 | 976 | $1,600 | $1.64 | 25d | 1 | 0.20mi |
| 1940 Lake Atriums Cir Orlando, FL | 1.0 | 1.0 | 593 | $1,225 | $2.07 | 25d | 4 | 0.20mi |
| 4807 S Texas Ave Unit 4807C Orlando, FL | 1.0 | 1.0 | 756 | $1,599 | $2.12 | 25d | 1 | 0.21mi |
| 4807 S Texas Ave Unit 4807D Orlando, FL | 1.0 | 1.0 | 756 | $1,349 | $1.78 | 25d | 1 | 0.21mi |
| 1948 Lake Atriums Cir Orlando, FL | 2.0–3.0 | 2.0 | 864 | $1,450 | $1.68 | 9d | 3 | 0.21mi |
| 2201 Metropolitan Way Orlando, FL | 2.0 | 2.0 | 874 | $1,475 | $1.69 | 4d | 1 | 0.22mi |
| 4801 S Texas Ave Unit 4801D Orlando, FL | 1.0 | 1.0 | 756 | $1,200 | $1.59 | 25d | 1 | 0.23mi |
| 1924 Lake Atriums Cir #62 Orlando, FL | 2.0 | 2.0 | 864 | $1,450 | $1.68 | 25d | 1 | 0.24mi |
| 5028 Park Central Dr #2133 Orlando, FL | 1.0 | 1.0 | 605 | $1,350 | $2.23 | 25d | 1 | 0.24mi |
| 5028 Park Central Dr #2131 Orlando, FL | 1.0 | 1.0 | 605 | $1,290 | $2.13 | 4d | 1 | 0.24mi |
| 1956 Lake Atriums Cir #144 Orlando, FL | 2.0 | 2.0 | 864 | $1,500 | $1.74 | 6d | 1 | 0.25mi |
| 4795 S Texas Ave Unit 4795A Orlando, FL | 1.0 | 1.0 | 756 | $1,200 | $1.59 | 25d | 1 | 0.25mi |
| 1956 Lake Atriums Cir Orlando, FL | 2.0 | 2.0 | 864 | $1,425 | $1.65 | 9d | 2 | 0.25mi |
| 1956 Lake Atriums Cir Orlando, FL | 2.0 | 2.0 | 864 | $1,425 | $1.65 | 16d | 3 | 0.25mi |
| 4791 S Texas Ave Orlando, FL | 2.0 | 2.0 | 976 | $1,300 | $1.33 | 25d | 1 | 0.26mi |
| 2437 Americana Blvd Orlando, FL | 2.0 | 1.0–2.0 | 895 | $2,147 | $2.40 | 0d | 16 | 0.26mi |
| 1908 Lake Atriums Cir Orlando, FL | 1.0 | 1.0 | 593 | $1,124 | $1.90 | 25d | 3 | 0.26mi |
| 1972 Lake Atriums Cir #180 Orlando, FL | 1.0 | 1.0 | 526 | $1,150 | $2.19 | 0d | 1 | 0.26mi |
| 1972 Lake Atriums Cir #181 Orlando, FL | 2.0 | 2.0 | 864 | $1,300 | $1.50 | 25d | 1 | 0.26mi |
| 1916 Lake Atriums Cir Orlando, FL | 1.0 | 1.0 | 593 | $1,172 | $1.98 | 0d | 3 | 0.27mi |
| 1964 Lake Atriums Cir Orlando, FL | 1.0 | 1.0 | 655 | $1,225 | $1.87 | 9d | 3 | 0.27mi |
| 1964 Lake Atriums Cir Orlando, FL | 1.0 | 1.0 | 526 | $1,250 | $2.38 | 12d | 2 | 0.27mi |
| 5017 City St #1923 Orlando, FL | 1.0 | 1.0 | 724 | $1,500 | $2.07 | 25d | 1 | 0.27mi |
HOA detail condo
- Monthly dues
- $296 · $3,552/yr
- Likely covers
- pool
- Assessments
- None detected in remarks — confirm with the listing agent.
Listing history 11 events
-
2026-05-31days on market $136,500 Active 89 DOM
-
2026-03-03$136,500 Active
-
2025-09-15soldstatus $75,000 Closed 127-char remark
Show marketing remark (127 chars)
Great location. Central. Near bus station. Minutes from I-4 and Area Malls. Community offers pool, tennis courts and playground
-
2025-06-13status Pending 127-char remark
Show marketing remark (127 chars)
Great location. Central. Near bus station. Minutes from I-4 and Area Malls. Community offers pool, tennis courts and playground
-
2025-06-10status Active 127-char remark
Show marketing remark (127 chars)
Great location. Central. Near bus station. Minutes from I-4 and Area Malls. Community offers pool, tennis courts and playground
-
2025-05-15status Pending 127-char remark
Show marketing remark (127 chars)
Great location. Central. Near bus station. Minutes from I-4 and Area Malls. Community offers pool, tennis courts and playground
-
2025-05-12$140,000 Active 127-char remark
Show marketing remark (127 chars)
Great location. Central. Near bus station. Minutes from I-4 and Area Malls. Community offers pool, tennis courts and playground
-
2008-08-29historical
-
2008-07-06$104,700
-
1993-03-30soldstatus $32,300
-
1991-05-28soldstatus $46,800
ⓘ Source: listings_history table (triggers on properties + properties_extension) + one-shot
backfill from property_details.listing_events for pre-trigger history.
Tax reassessment forecast FL · Resets to sale price
- Current annual tax
- $1,427 · $119/mo
- Projected year-2 tax
- $1,427 · $119/mo
- Expected delta
- $0/yr ($0/mo · 0.0%)
ⓘ Screening estimate from a state-policy table — verify with the county assessor before closing.
Climate risk First Street
- Flood 1/10 Low FEMA zone X (unshaded) · 0% chance over 30 yrs
- Wildfire 1/10 Low
- Heat 9/10 Extreme 7 d/yr ≥108°F today · 24 d/yr by 30 yrs out
- Wind 9/10 Extreme 99% chance of damaging wind over 30 yrs
- Air quality 1/10 Low 0 unhealthy d/yr today · 0 by 30 yrs out
Nearby sold comps map
Loading sold comps map…
Walkable amenities ~0.75 mi
Loading nearby amenities…
Taxation est. · year 1
- Rental income
- $17,927
- − Mortgage interest
- −$7,646
- − Property taxes
- −$1,427
- − Insurance
- −$682
- − Repairs & maintenance
- −$1,434
- − Management
- −$1,434
- − HOA
- −$3,552
- − Depreciation
- −$3,971
- Taxable loss
- −$2,220
- Est. tax savings @ 24.0%
- +$533
- After-tax cash flow
- $444/yr
For passive investors: Depreciation is non-cash, so a rental often shows a tax loss while cash-flowing — sheltering income. Rental losses are passive: they offset passive income freely, and up to $25,000/yr can offset ordinary (W-2) income if you actively participate and your MAGI is under $100k (phasing out to $0 by $150k); unused losses carry forward. On sale, claimed depreciation is recaptured at up to 25%, and gains may owe capital-gains tax (a 1031 exchange can defer both). Figures are a year-1 estimate at your 24.0% rate — not tax advice; consult a CPA.
Schools (NCES district)
- District
- Orange
- NCES district ID
- 1201440
- Math proficiency
- 46% ▼ -9.00%
- Reading proficiency
- 51% ▼ -2.00%
- Median HH income
- $49,350
- Composite
- 41.47/100
- National rank
- #3461
- State rank
- #43 of 73 in FL
Livability — Orlando
- Score
- 86/100
- State rank
- #12
- US rank
- #360
Category grades
Schools grade is shown separately in the Schools card above.
Census & demographics
- County
- Orange County · 1,471,359 people
- City population
- 964,969
- Metro
- Orlando-Kissimmee-Sanford, FL
- Population (ZIP)
- 53,242
- Household income
- $47,313
- Rent vs Own
- Severe rent burden
- 5337.0
Population outlook (Orange County) Hauer SSP2
- Today (2025)
- 1,618,226 people
- By 2030
- 1,787,404 · +10.5%
- By 2040
- 2,125,621 · +31.4%
- By 2050
- 2,454,016 · +51.6%
- By 2075
- 3,173,711 · +96.1%
- By 2100
- 3,607,781 · +122.9%
Race, ethnicity, and origin ACS 2023
- Neighborhood character
- Diverse neighborhood (Simpson 0.69)
- Race & ethnicity
- Hispanic / Latino 39% Black 35% Two or more races 17% White 16% Asian 4%
- Hispanic origin (detail)
- Mexican 5% Puerto Rican 14% Cuban 2% Dominican 3%
- Common ancestry
- Hispanic 8% Estonian 1% Lithuanian 1%
- Foreign-born
- 30% · Canada, Jamaica, Vietnam
- Languages at home
- 51% English-only · Spanish 33% French/Haitian/Cajun 9% Other Indo-European 2%
Political lean MEDSL · Orange
- 2024 margin
- D (+13.6) · D 56.1% · R 42.5% · Other 1.3%
- 2008→2024 swing
- -5.0pp toward R · 2008: 18.6pp · 2024: 13.6pp
- All cycles
- 2024: D+13.6 2020: D+23.1 2016: D+24.6 2012: D+18.2 2008: D+18.6
Not yet ingested
- Civics
- —
Market trends
- HPI YoY
- ▼ -89.65%
- Current HPI
- 357.4828
- Rent YoY
- ▼ -0.50%
- Metro
- Orlando-Kissimmee-Sanford, FL
- State GDP YoY
- ▲ 3.28%
- F500 in state
- 36
Industry mix (Fortune 500 HQ in FL)
| Industry | F500 HQs | Revenue |
|---|---|---|
| Industrial Technology | 2 | $29B |
|
||
| Insurance | 2 | $17B |
|
||
| Retail | 1 | $60B |
|
||
| Technology Distribution | 1 | $58B |
|
||
| Homebuilding | 1 | $35B |
|
||
| Technology Manufacturing | 1 | $35B |
|
||
Price history
+191.7% since first listed10 events — show timeline
- 2026-03-03 Listed $136,500 Stellar MLS as Distributed by MLS Grid
- 2025-09-15 Sold (MLS) $75,000 Stellar MLS as Distributed by MLS Grid
- 2025-06-13 Pending — Stellar MLS as Distributed by MLS Grid
- 2025-06-10 Relisted — Stellar MLS as Distributed by MLS Grid
- 2025-05-15 Pending — Stellar MLS as Distributed by MLS Grid
- 2025-05-12 Listed $140,000 Stellar MLS as Distributed by MLS Grid
- 2008-08-29 Listing Removed — Stellar MLS as Distributed by MLS Grid
- 2008-07-06 Listed $104,700 Stellar MLS as Distributed by MLS Grid
- 1993-03-30 Sold (Public Records) $32,300 Public Records
- 1991-05-28 Sold (Public Records) $46,800 Public Records
Property tax history
+9.3%/yrLatest (2025): $1,427 · +9.5% YoY. Source: county tax records.
Cash-flow waterfall
monthlySold comps — $/sqft
last 12 mo · ≤1 miLoading sold comps…