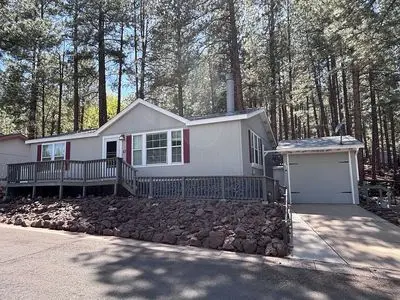
2401 W Route 66 · Flagstaff, AZ
Flood risk 8/10 · Major
- FEMA flood zone
- X (unshaded)
- Chance of flooding over 30 yrs
- 0.99%
- Est. flood insurance / yr
- $507 – $1,088
Fire risk 8/10 · Major
- Est. fire insurance / yr
- $610 – $1,132
Heat risk 2/10 · Minimal
- Hot days now (above 86°F)
- 7 days/yr
- Hot days in 30 yrs
- 18 days/yr
Wind risk 1/10 · Minimal
- Chance of severe wind over 30 yrs
- —
Air-quality risk 1/10 · Minimal
- Unhealthy air days now
- 0 days/yr
- Unhealthy air days in 30 yrs
- 0 days/yr
Risk factors via First Street. Map © Google.
Why this score? — see what drove the F grade
The composite is a weighted blend of 9 inputs, each scored 0–100. Each bar is that input's sub-score; the figure is the points it added to the 100-point composite (weight × sub-score).
- ARV discount +7.5/15.0
- Cash flow +7.1/30.0
- 1% rule +4.8/10.0
- Livability +3.1/5.0
- Rent growth +2.6/5.0
- Condition / age +2.5/5.0
- Schools +2.1/10.0
- DSCR +1.3/10.0
- Appreciation +0.0/10.0
$217,000
🖨 Deal sheet 📄 Offer letter ✓ Due diligence
Listing remarks MLS
Welcome to easy mountain living in beautiful Flagstaff. Located along historic U. S. Route 66, this charming 3-bedroom, 1-bath home offers comfort, privacy, and access to excellent community amenities in a desirable 55+ neighborhood. The home features a bright and functional layout with a cozy wood-burning stove, perfect for enjoying Flagstaffs cool mountain evenings. The kitchen comes fully equipped with all appliances included, including a refrigerator, washer, and dryer, making this home move-in ready. Step outside to enjoy a private fenced yard, offering space to relax, garden, or entertain. A covered carport provides convenient parking and protection from the elements. Residents of the community enjoy access to fantastic amenities including a heated swimming pool, clubhouse, and fitness room, creating a welcoming and active lifestyle environment. Ideally located in the heart of Flagstaff, the home is just minutes from shopping, dining, outdoor recreation, and the campus of Northern Arizona University. This is a rare opportunity to own an affordable home in one of Arizona's most beautiful mountain towns. For Sale By Owner Contact George at 303-475-6384 Buyer agents welcome.
Key facts
- Two skylights
- Eastern exposure
- Double plain windows
Tags
Neighborhood map
What this means for you Summary
Snapshot
- This is a 2-bed/2.0-bath land listed at $217k.
Deal economics
- At list price, monthly cash flow is $-372 ($-4k/yr) — negative.
- To cash-flow at today's rent, offer at most $183k (15.7% below list).
- To meet the 1% rule (rent ≥ 1% of price), the offer needs to be $213k (1.7% below list).
- Recommended offer: $183k (15.7% below list) — sets the bar for cash-flow.
- Cap rate 4.6% vs local median 2.1% in Flagstaff — top-decile yield for the area; either an underpriced asset or a hidden risk that comps aren't pricing in. Stress-test before assuming the spread holds.
Location & tenants
- Location reads 61/100 on livability (#167 in AZ) — a middle-class / working-renter tenant base. Strengths: housing B; Watch: schools C-, employment C-, crime D-.
- Flagstaff Unified District (4192) (urban): math 18% / reading 29% proficiency, ranked #158 of 249 in AZ (top 64%) — low school quality limits family demand, transient renter base, plan for 1-2y turnover.
- Market conditions: Rents flat; 280 active listings in the ZIP; 14 comparable units currently listed for rent nearby; rentals lingering (median 44d on market — plan ~5-8 weeks vacancy on turnover, expect pricing pressure); 100% of comp listings sitting > 30 days — soft ceiling on asking rent; 698 units permitted in Coconino County in 2024 (354 in 5+ unit buildings).
- This rent runs 40% of the median local income ($65k/yr) — at the standard rent-burdened threshold; future hikes will face affordability resistance.
Forward outlook
- Local home prices are declining (-3.0%/yr); year-one equity from $2k of loan paydown is wiped out by about $7k of value loss. Plan a longer hold.
- Coconino County population projected at +20% by 2050 — long-run rental-demand tailwind backs the buy-and-hold thesis.
Negotiation context
- It's been on market 38 days — a 3% lower offer ($210k) is reasonable based on typical stale-listing flexibility.
- 2 sale attempts; this cycle's ask is 45% above the opening price — seller raised mid-cycle; expect resistance to lowballs.
Risks & watch-outs
- Watch-outs: property tax is 4.2% of price; flood insurance adds $66/mo.
- Climate carrying-cost: severe flood risk; severe wildfire risk — expect insurance premiums to compound above CPI over the hold.
Questions for the listing agent
- What do current leases actually rent for vs. the listed asking? Can we see a recent rent roll and the last 12 months of T-12 income?
- It's been on market 38 days. Have you received any prior offers? Is the seller open to a 16% concession, seller financing, or rate buy-down credit?
- Property tax is high relative to price — has the assessment been appealed recently, and will the sale trigger a re-assessment?
- What's the actual annual flood-insurance premium (NFIP or private), and is the property in a SFHA with mandatory coverage?
- Is there a deadline driving the sale (1031 exchange, divorce, estate, relocation)? That informs how much negotiation room exists.
- Crime grade is D in this area — have there been break-ins, vandalism, or insurance claims at this property in the last 3 years? What carrier currently insures it and at what premium?
- The area grade is low — what's the realistic commute time and amenity access for the typical tenant pool here? Any planned neighborhood developments (good or bad) we should know about?
- What's the average days-on-market for RENTAL listings here right now (not sales)? A rising rental-DOM trend means longer vacancies and softer asking-rent achievability than the comps imply.
- What's the recent tenant-quality profile in this submarket — average credit score on applications, eviction rate, late-payment / NSF rate, and stable-employment percentage? A property-management company in the area should have these aggregated.
- How much new for-sale + rental construction is in the pipeline within 1–3 miles? Heavy new supply typically softens prices + rents 12–24 months out; constrained supply supports both.
Investment metrics
- 1% rule
- 0.98% ✗
- Cap rate
- 4.60%
- Cash-on-cash
- -6.04%
- DSCR
- 0.73
- GRM
- 8.5
CMA / ARV
No comps found within radius.
Projected returns pro-forma
-3.0% appreciation · 0.55% rent growth · sell at horizon
- IRR
- -33.0%
- Equity multiple
- -0.05×
- Total profit
- $-63,642
- Equity at exit
- $32,355
- IRR
- -66.4%
- Equity multiple
- -0.72×
- Total profit
- $-104,487
- Equity at exit
- $18,762
Cash invested: $60,760 (down + closing). Projections, not guarantees.
Landlord ↔ Tenant lean methodology
- Overall (STATE)
- 87 Strongly Landlord-Friendly
- State Arizona
- 87 Strongly Landlord-Friendly · R+3
- County
- — inherits STATE
- City
- — inherits STATE
ZIP-level market 86001
- Rents YoY
- 0.6%
- Active inventory
- 280
- Price-to-rent
- 8.5×
Monthly cashflow live
- Estimated rent
- $2,132 high interval (Pro) →
- Mortgage (P&I)
- −$1,138
- Tax from tax record
- −$762 /mo · $9,143/yr
- Insurance
- −$90
- Flood insurance flood zone
- −$66 /mo · $798/yr
- HOA
- −$0
- Vacancy / Maint / Mgmt
- −$448
- Net cashflow
- $-372
Break-even live
UW: 25.0% down · 7.5% · 30yr · 1.5% tax · 5.0% vac · 8.0% maint · 8.0% mgmt
Financing live
Cash to close
- Down payment
- $54,250
- Closing costs
- $6,510
- Reserves months
- —
- Total cash needed
- —
Loan-product check · same deal, 3 products live
Conventional
25% down · 7.5% · 30yr
- Down + closing
- —
- Monthly P&I
- —
- Monthly cashflow
- —
- DSCR
- —
- Eligible?
- —
Personal DTI + credit; lowest rate.
DSCR
20% down · 8.5% · 30yr
- Down + closing
- —
- Monthly P&I
- —
- Monthly cashflow
- —
- DSCR
- —
- Eligible?
- —
No personal income docs; deal must DSCR.
Hard money
10% down · 12.0% · 12mo
- Down + closing
- —
- Monthly P&I
- —
- Monthly cashflow
- —
- DSCR
- —
- Eligible?
- —
Short-term bridge; refi at stabilization.
Rent comps 14 comps
| Address | Beds | Baths | Sqft | Rent | $/sqft | DOM | Units | Dist |
|---|---|---|---|---|---|---|---|---|
| 2701 S Woody Mountain Rd Flagstaff, AZ | 1.0–3.0 | 1.0–2.0 | 1078 | $2,642 | $2.45 | 43d | 77 | 0.41mi |
| 2292 S Alvan Clark Blvd Flagstaff, AZ | 2.0–3.0 | 1.0–2.0 | 978 | $1,473 | $1.51 | 43d | 12 | 0.58mi |
| 1385 W University Ave Flagstaff, AZ | 2.0 | 2.0 | 906 | $1,725 | $1.90 | 43d | 3 | 0.82mi |
| 1000 W Forest Meadows St Flagstaff, AZ | 2.0 | 2.0 | 947 | $1,925 | $2.03 | 43d | 1 | 0.94mi |
| 927 W Forest Meadows St Flagstaff, AZ | 1.0–2.0 | 1.0–2.0 | 958 | $2,806 | $2.93 | 43d | 11 | 0.99mi |
| 923 W University Ave Flagstaff, AZ | 1.0–2.0 | 1.0–2.0 | 877 | $2,304 | $2.63 | 43d | 36 | 1.10mi |
| 1580 S Plaza Way Flagstaff, AZ | 1.0–2.0 | 1.0–2.0 | 875 | $2,455 | $2.81 | 43d | 12 | 1.12mi |
| 800 W Forest Meadows St Flagstaff, AZ | 1.0–3.0 | 1.0–2.0 | 847 | $2,548 | $3.01 | 43d | 32 | 1.14mi |
| 813 W University Ave Flagstaff, AZ | 2.0 | 1.0–2.0 | 567 | $1,840 | $3.25 | 43d | 1 | 1.18mi |
| 1515 S Yale St Flagstaff, AZ | 2.0 | 1.0–2.0 | 860 | $1,740 | $2.02 | 43d | 6 | 1.19mi |
| 700 W University Ave Flagstaff, AZ | 2.0 | 1.0–2.0 | 675 | $1,735 | $2.57 | 43d | 1 | 1.20mi |
| 600 W University Heights Dr N Flagstaff, AZ | 1.0–2.0 | 1.0–2.0 | 766 | $2,254 | $2.94 | 43d | 4 | 1.42mi |
| 3200 S Litzler Dr Unit 9-236 Flagstaff, AZ | 2.0 | 2.0 | 776 | $1,800 | $2.32 | 43d | 1 | 1.44mi |
| 1200 S Riordan Ranch St Flagstaff, AZ | 1.0 | 1.0 | 528 | $1,525 | $2.89 | 43d | 1 | 1.46mi |
Listing history 23 events
-
2026-06-19days on market $217,000 Active 38 DOM
-
2026-06-18days on market $217,000 Active 37 DOM
-
2026-06-17days on market $217,000 Active 36 DOM
-
2026-06-16days on market $217,000 Active 35 DOM
-
2026-06-15days on market $217,000 Active 34 DOM
-
2026-06-14days on market $217,000 Active 32 DOM
-
2026-06-13days on market $217,000 Active 31 DOM
-
2026-06-10days on market $217,000 Active 29 DOM
-
2026-06-09days on market $217,000 Active 28 DOM
-
2026-06-08days on market $217,000 Active 27 DOM
-
2026-06-07days on market $217,000 Active 26 DOM
-
2026-06-05days on market $217,000 Active 23 DOM
-
2026-06-03days on market $217,000 Active 22 DOM
-
2026-06-02days on market $217,000 Active 21 DOM
-
2026-06-01days on market $217,000 Active 20 DOM
-
2026-05-31days on market $217,000 Active 19 DOM
-
2026-05-30days on market $217,000 Active 18 DOM
-
2026-05-12$217,000 Active 1751-char remark
-
2005-12-15soldstatus $6,600,000
-
2003-04-14soldstatus $4,800,000
-
2003-04-04soldstatus $2,900,000
-
1998-11-04soldstatus $3,580,000
-
1998-11-02soldstatus $3,580,000
ⓘ Source: listings_history table (triggers on properties + properties_extension) + one-shot
backfill from property_details.listing_events for pre-trigger history.
Tax reassessment forecast AZ · Resets to sale price
- Current annual tax
- $9,143 · $762/mo
- Projected year-2 tax
- $9,143 · $762/mo
- Expected delta
- $0/yr ($0/mo · 0.0%)
ⓘ Screening estimate from a state-policy table — verify with the county assessor before closing.
Climate risk First Street
- Flood 8/10 Severe FEMA zone X (unshaded) · 99% chance over 30 yrs
- Wildfire 8/10 Severe
- Heat 2/10 Low 7 d/yr ≥86°F today · 18 d/yr by 30 yrs out
- Wind 1/10 Low
- Air quality 1/10 Low 0 unhealthy d/yr today · 0 by 30 yrs out
Nearby sold comps map
Loading sold comps map…
Walkable amenities ~0.75 mi
Loading nearby amenities…
Taxation est. · year 1
- Rental income
- $25,584
- − Mortgage interest
- −$12,155
- − Property taxes
- −$9,143
- − Insurance
- −$1,882
- − Repairs & maintenance
- −$2,047
- − Management
- −$2,047
- − Depreciation
- −$6,313
- Taxable loss
- −$8,003
- Est. tax savings @ 24.0%
- +$1,921
- After-tax cash flow
- $-2,549/yr
For passive investors: Depreciation is non-cash, so a rental often shows a tax loss while cash-flowing — sheltering income. Rental losses are passive: they offset passive income freely, and up to $25,000/yr can offset ordinary (W-2) income if you actively participate and your MAGI is under $100k (phasing out to $0 by $150k); unused losses carry forward. On sale, claimed depreciation is recaptured at up to 25%, and gains may owe capital-gains tax (a 1031 exchange can defer both). Figures are a year-1 estimate at your 24.0% rate — not tax advice; consult a CPA.
Schools (NCES district)
- District
- Flagstaff Unified District (4192)
- NCES district ID
- 0402860
- Math proficiency
- 18% ▼ -16.00%
- Reading proficiency
- 29% ▼ -10.00%
- Median HH income
- $53,510
- Composite
- 21.11/100
- National rank
- #8437
- State rank
- #158 of 249 in AZ
Livability — Flagstaff
- Score
- 61/100
- State rank
- #167
- US rank
- #18308
Category grades
Schools grade is shown separately in the Schools card above.
Census & demographics
- Census place
- Flagstaff, AZ
- County
- Coconino County · 91,667 people
- City population
- 91,667
- Metro
- Flagstaff, AZ
- Population (ZIP)
- 37,312
- Household income
- $64,626
- Rent vs Own
- Severe rent burden
- 3117.0
Population outlook (Coconino County) Hauer SSP2
- Today (2025)
- 150,645 people
- By 2030
- 156,857 · +4.1%
- By 2040
- 168,714 · +12.0%
- By 2050
- 181,082 · +20.2%
- By 2075
- 218,399 · +45.0%
- By 2100
- 238,853 · +58.6%
Race, ethnicity, and origin ACS 2023
- Neighborhood character
- Diverse neighborhood (Simpson 0.59)
- Race & ethnicity
- White 62% Hispanic / Latino 15% Native American 12% Two or more races 9% Asian 3% Black 2%
- Hispanic origin (detail)
- Mexican 10%
- Common ancestry
- Italian 2% Slovak 2% Romanian 2%
- Foreign-born
- 6% · Canada, China, Jamaica
- Languages at home
- 84% English-only · Spanish 8% Other Indo-European 1% Chinese 1%
Political lean MEDSL · Coconino
- 2024 margin
- D (+19.9) · D 59.2% · R 39.4% · Other 1.4%
- 2008→2024 swing
- +2.9pp toward D · 2008: 17.0pp · 2024: 19.9pp
- All cycles
- 2024: D+19.9 2020: D+24.1 2016: D+19.4 2012: D+14.9 2008: D+17.0
Not yet ingested
- Civics
- —
Market trends
- HPI YoY
- ▼ -488.37%
- Current HPI
- 393.2551
- Rent YoY
- ▲ 0.55%
- Metro
- Flagstaff, AZ
- State GDP YoY
- ▲ 4.54%
- F500 in state
- 20
Industry mix (Fortune 500 HQ in AZ)
| Industry | F500 HQs | Revenue |
|---|---|---|
| Technology | 2 | $13B |
|
||
| Mining / Metals | 1 | $23B |
|
||
| Environmental Services | 1 | $16B |
|
||
| Metals / Steel | 1 | $14B |
|
||
| Technology Distribution | 1 | $9B |
|
||
| Homebuilding | 1 | $8B |
|
||
Price history
-95.8% since first listed7 events — show timeline
- 2026-06-04 Listed $150,000 ForSaleByOwner.com
- 2026-05-12 Listed $217,000 FSBO.com
- 2005-12-15 Sold (Public Records) $6,600,000 Public Records
- 2003-04-14 Sold (Public Records) $4,800,000 Public Records
- 2003-04-04 Sold (Public Records) $2,900,000 Public Records
- 1998-11-04 Sold (Public Records) $3,580,000 Public Records
- 1998-11-02 Sold (Public Records) $3,580,000 Public Records
Property tax history
+1.6%/yrLatest (2025): $9,143 · +3.0% YoY. Source: county tax records.
Cash-flow waterfall
monthlySold comps — $/sqft
last 12 mo · ≤1 miLoading sold comps…