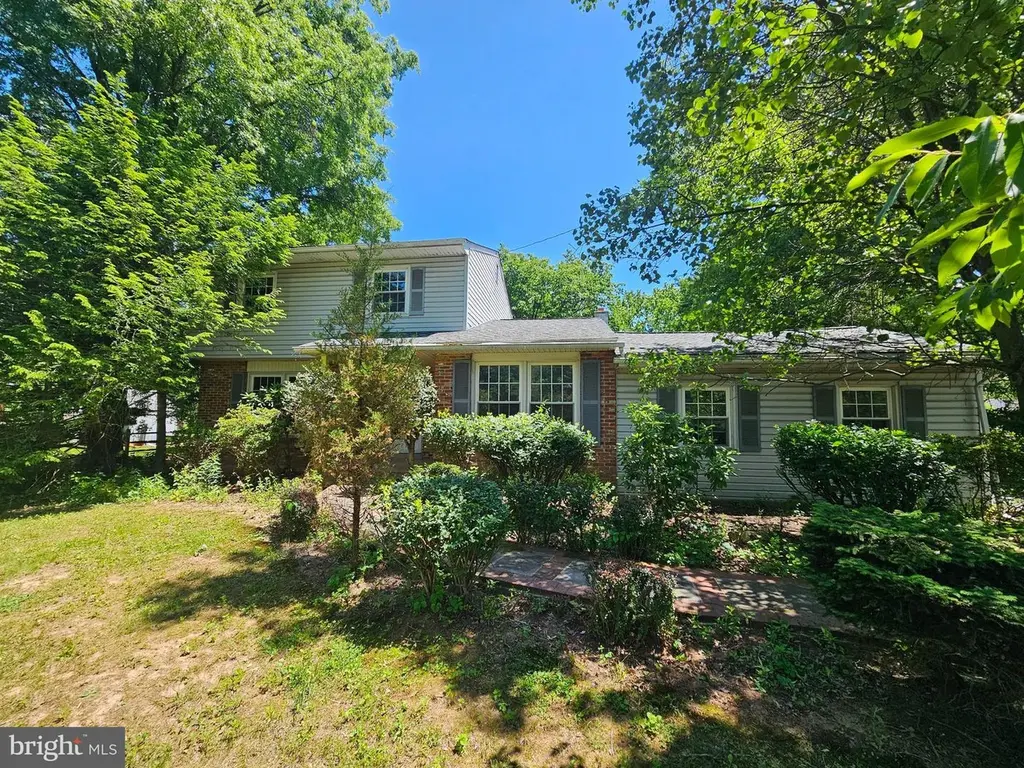
44 N Boro Line Rd · Trappe, PA
Flood risk 3/10 · Minor
- FEMA flood zone
- X (unshaded)
- Chance of flooding over 30 yrs
- 0.2%
- Est. flood insurance / yr
- $473 – $860
Fire risk 1/10 · Minimal
- Est. fire insurance / yr
- $511 – $949
Heat risk 5/10 · Moderate
- Hot days now (above 100°F)
- 7 days/yr
- Hot days in 30 yrs
- 15 days/yr
Wind risk 6/10 · Moderate
- Chance of severe wind over 30 yrs
- 27.0%
Air-quality risk 4/10 · Minor
- Unhealthy air days now
- 3 days/yr
- Unhealthy air days in 30 yrs
- 6 days/yr
Risk factors via First Street. Map © Google.
Why this score? — see what drove the C+ grade
The composite is a weighted blend of 9 inputs, each scored 0–100. Each bar is that input's sub-score; the figure is the points it added to the 100-point composite (weight × sub-score).
- Cash flow +21.4/30.0
- ARV discount +15.0/15.0
- DSCR +6.8/10.0
- 1% rule +6.4/10.0
- Schools +5.6/10.0
- Livability +4.0/5.0
- Condition / age +2.5/5.0
- Rent growth +2.4/5.0
- Appreciation +0.0/10.0
$249,900
🖨 Deal sheet 📄 Offer letter ✓ Due diligence
Listing remarks
Multiple offers have been received. The estate is setting a deadline of Friday 6/5 at noon. Bring your vision and your contractor to this incredible opportunity in the heart of the Perkiomen Valley School District. Situated on a sprawling, picturesque 1.33-acre lot, this classic two-story Colonial offers the perfect canvas for a total transformation. The home features a traditional layout including three bedrooms, 1.5 bathrooms, and the convenience of an attached two-car garage. While the property is being sold strictly in "as-is" condition—requiring a full renovation including kitchen, baths, flooring, and mechanical updates—the potential here is limitless. Whether yo
Key facts
- Large lot
- Full renovation
- 1.33-acre lot
Tags
Property features AI
Exterior
- Parking: Attached 2-car garage with rear entry, inside access, and garage door opener; Paved driveway with space for 4 vehicles (total 6 parking spaces)
- Utilities: Well water; On-site septic; Electric hot water; Circuit breaker electrical
- Home design: Detached home; Pitched roof; Fee simple ownership
- Construction: Vinyl siding; Permanent foundation
- Exterior features: Level lot with front and rear yard; Patio and porch with roof; Above-grade outdoor structures
Interior
- Kitchen: Stove; Microwave
- Bedrooms: Three bedrooms on the upper level
- Flooring: Wood floors; Vinyl flooring; Carpet
- Bathrooms: One full bathroom on the upper level; One half bathroom on the main level
- Heating & cooling: Forced air heating (oil); Central air conditioning
- Interior features: Eat-in kitchen; Tub with shower; Ceiling fans; Dining area; Traditional floor plan; Drywall walls and ceilings
- Laundry & utility: Washer and dryer on the main floor
Neighborhood map
What this means for you Summary
Snapshot
- This is a 3-bed/1.5-bath single-family listed at $250k.
Deal economics
- At list price, monthly cash flow is $372 ($4k/yr) — positive.
- The deal already cash-flows at list — no discount required.
- Meets the 1% rule at list price ($3k rent vs $250k).
- Cap rate 8.1% vs local median 1.4% in Trappe — top-decile yield for the area; either an underpriced asset or a hidden risk that comps aren't pricing in. Stress-test before assuming the spread holds.
Location & tenants
- Location reads 79/100 on livability (#245 in PA, #2,090 nationally) — a middle-class / working-renter tenant base. Strengths: schools A+, crime A+, employment A+; Watch: commute F, health & safety D-.
- Perkiomen Valley SD (suburban): math 53% / reading 70% proficiency, ranked #46 of 539 in PA (top 8%) — acceptable for families but not a draw, mixed tenant base, ~2y average lease; only 10% free/reduced lunch — higher-income household profile.
- Market conditions: Rents soft (-0.3%/yr); 158 active listings in the ZIP; 4 comparable units currently listed for rent nearby; rentals leasing fast (median 12d on market — plan ~1-2 weeks tenant-placement turnaround); high-income renter base; 1,936 units permitted in Montgomery County in 2024 (530 in 5+ unit buildings).
Forward outlook
- Local home prices are declining (-3.0%/yr); year-one equity from $2k of loan paydown is wiped out by about $7k of value loss. Plan a longer hold.
- Montgomery County population projected at +5% by 2050 — modest demand growth; plan on rents tracking national, not racing it.
Negotiation context
- Only 5 days on market — expect competitive offers; lowballing is unlikely to land.
- 3 sale attempts since 29y ago with the ask held roughly flat each time — persistent listings suggest the price (not the market) is what's stuck; bring a comps-based counter.
- Current owner paid $165k; list at $250k implies a 51% gain — meaningful room to come down on a strong offer.
Risks & watch-outs
- Climate carrying-cost: major wind risk, 27% chance of damaging wind over 30y; extreme-heat days projected 7→15/yr by 2055 (HVAC capex compounding) — expect insurance premiums to compound above CPI over the hold.
Questions for the listing agent
- Built in 1972 — when were the roof, HVAC, electrical panel, plumbing, and water heater last replaced?
- Is there a deadline driving the sale (1031 exchange, divorce, estate, relocation)? That informs how much negotiation room exists.
- Schools are A-rated — typically a magnet for longer-tenancy family renters. What's the average tenant stay here, and is there a school-zone premium baked into asking?
- What's the average days-on-market for RENTAL listings here right now (not sales)? A rising rental-DOM trend means longer vacancies and softer asking-rent achievability than the comps imply.
- What's the recent tenant-quality profile in this submarket — average credit score on applications, eviction rate, late-payment / NSF rate, and stable-employment percentage? A property-management company in the area should have these aggregated.
- How much new for-sale + rental construction is in the pipeline within 1–3 miles? Heavy new supply typically softens prices + rents 12–24 months out; constrained supply supports both.
Investment metrics
- 1% rule
- 1.14% ✓
- Cap rate
- 8.08%
- Cash-on-cash
- 6.38%
- DSCR
- 1.28
- GRM
- 7.3
CMA / ARV
- ARV (on-the-fly)
- $494,100
- Comps found
- 8
Show comp detail 8 sales within ~0.75 mi
| Address | Dist | Beds/Ba | Sqft | Sold | Price | $/sf | Match |
|---|---|---|---|---|---|---|---|
| 87 Cherry Ave | 0.30mi | 4/2.5 (+1) | 1,590 (-2%) | 12mo | $575,000 | $362 | 64 |
| 1670 W Main St | 0.56mi | 3/1.0 | 1,504 (-7%) | 4mo | $349,900 | $233 | 57 |
| 127 Pennapacker Rd | 0.44mi | 4/1.5 (+1) | 1,618 (-0%) | 21mo | $415,000 | $256 | 57 |
| 79 Cherry Ave | 0.31mi | 3/2.0 | 1,404 (-13%) | 12mo | $475,000 | $338 | 51 |
| 50 Holly Dr | 0.45mi | 3/1.5 | 1,835 (+13%) | 10mo | $430,000 | $234 | 49 |
| 113 Linfield Trappe Rd | 0.32mi | 3/2.0 | 1,466 (-10%) | 24mo | $278,500 | $190 | 47 |
| 301 Rittenhouse Rd | 0.69mi | 2/2.0 (-1) | 1,472 (-9%) | 9mo | $501,000 | $340 | 38 |
| 630 Bonnybrook Ave | 0.74mi | 4/1.5 (+1) | 1,785 (+10%) | 21mo | $545,000 | $305 | 26 |
Match score weights: distance 35% · size 25% · config 20% · recency 20%. Top-matched comps best support the ARV.
Projected returns pro-forma
-3.0% appreciation · 0.0% rent growth · sell at horizon
- IRR
- -10.1%
- Equity multiple
- 0.64×
- Total profit
- $-25,011
- Equity at exit
- $37,261
- IRR
- -5.9%
- Equity multiple
- 0.67×
- Total profit
- $-22,927
- Equity at exit
- $21,607
Cash invested: $69,972 (down + closing). Projections, not guarantees.
Landlord ↔ Tenant lean methodology
- Overall (STATE)
- 62 Landlord-Friendly
- State Pennsylvania
- 62 Landlord-Friendly · EVEN
- County
- — inherits STATE
- City
- — inherits STATE
ZIP-level market 19426
- Rents YoY
- -0.3%
- Active inventory
- 158
- Price-to-rent
- 7.3×
Monthly cashflow live
- Estimated rent
- $2,841 medium interval (Pro) →
- Mortgage (P&I)
- −$1,311
- Tax from tax record
- −$458 /mo · $5,492/yr
- Insurance
- −$104
- HOA
- −$0
- Vacancy / Maint / Mgmt
- −$597
- Net cashflow
- $372
Break-even live
UW: 25.0% down · 7.5% · 30yr · 1.5% tax · 5.0% vac · 8.0% maint · 8.0% mgmt
Financing live
Cash to close
- Down payment
- $62,475
- Closing costs
- $7,497
- Reserves months
- —
- Total cash needed
- —
Loan-product check · same deal, 3 products live
Conventional
25% down · 7.5% · 30yr
- Down + closing
- —
- Monthly P&I
- —
- Monthly cashflow
- —
- DSCR
- —
- Eligible?
- —
Personal DTI + credit; lowest rate.
DSCR
20% down · 8.5% · 30yr
- Down + closing
- —
- Monthly P&I
- —
- Monthly cashflow
- —
- DSCR
- —
- Eligible?
- —
No personal income docs; deal must DSCR.
Hard money
10% down · 12.0% · 12mo
- Down + closing
- —
- Monthly P&I
- —
- Monthly cashflow
- —
- DSCR
- —
- Eligible?
- —
Short-term bridge; refi at stabilization.
Rent comps 4 comps
| Address | Beds | Baths | Sqft | Rent | $/sqft | DOM | Units | Dist |
|---|---|---|---|---|---|---|---|---|
| 522 Hancock Ct Trappe, PA | 3.0 | 2.5 | 1820 | $2,610 | $1.43 | 12d | 1 | 0.78mi |
| 150 Morgan Dr Royersford, PA | 1.0–3.0 | 1.0–2.5 | 1075 | $3,215 | $2.99 | 43d | 15 | 1.35mi |
| 150 Morgan Dr Royersford, PA | 1.0–3.0 | 1.0–2.5 | 1075 | $2,880 | $2.68 | 1d | 15 | 1.35mi |
| 645 Muhlenberg Dr #407 Trappe, PA | 2.0 | 2.5 | 1768 | $2,500 | $1.41 | 1d | 1 | 1.36mi |
Listing history 5 events
-
2026-06-07statusdays on market $249,900 Pending 5 DOM
-
2026-06-04days on market $249,900 Active 3 DOM
-
2026-06-03days on market $249,900 Active 2 DOM
-
2026-06-02remarks 677-char remark
-
2026-06-02$249,900 Active 1 DOM
ⓘ Source: listings_history table (triggers on properties + properties_extension) + one-shot
backfill from property_details.listing_events for pre-trigger history.
Tax reassessment forecast PA · Partial reset (capped growth)
- Current annual tax
- $5,492 · $458/mo
- Projected year-2 tax
- $5,492 · $458/mo
- Expected delta
- $0/yr ($0/mo · 0.0%)
ⓘ Screening estimate from a state-policy table — verify with the county assessor before closing.
Climate risk First Street
- Flood 3/10 Moderate FEMA zone X (unshaded) · 20% chance over 30 yrs
- Wildfire 1/10 Low
- Heat 5/10 Major 7 d/yr ≥100°F today · 15 d/yr by 30 yrs out
- Wind 6/10 Major 27% chance of damaging wind over 30 yrs
- Air quality 4/10 Moderate 3 unhealthy d/yr today · 6 by 30 yrs out
Nearby sold comps map
Loading sold comps map…
Walkable amenities ~0.75 mi
Loading nearby amenities…
Taxation est. · year 1
- Rental income
- $34,087
- − Mortgage interest
- −$13,998
- − Property taxes
- −$5,492
- − Insurance
- −$1,250
- − Repairs & maintenance
- −$2,727
- − Management
- −$2,727
- − Depreciation
- −$7,270
- Taxable income
- $623
- Est. tax owed @ 24.0%
- −$150
- After-tax cash flow
- $4,311/yr
For passive investors: Depreciation is non-cash, so a rental often shows a tax loss while cash-flowing — sheltering income. Rental losses are passive: they offset passive income freely, and up to $25,000/yr can offset ordinary (W-2) income if you actively participate and your MAGI is under $100k (phasing out to $0 by $150k); unused losses carry forward. On sale, claimed depreciation is recaptured at up to 25%, and gains may owe capital-gains tax (a 1031 exchange can defer both). Figures are a year-1 estimate at your 24.0% rate — not tax advice; consult a CPA.
Schools (NCES district)
- District
- Perkiomen Valley SD
- NCES district ID
- 4218930
- Math proficiency
- 53% ▼ -12.00%
- Reading proficiency
- 70% ▼ -12.00%
- Median HH income
- $92,706
- Composite
- 56.33/100
- National rank
- #1167
- State rank
- #46 of 539 in PA
Livability — Trappe
- Score
- 79/100
- State rank
- #245
- US rank
- #2090
Category grades
Schools grade is shown separately in the Schools card above.
Census & demographics
- Census place
- Trappe, PA
- County
- Montgomery County · 712,331 people
- Metro
- Philadelphia-Camden-Wilmington, PA-NJ-DE-MD
- Population (ZIP)
- 43,460
- Household income
- $151,748
- Rent vs Own
- Severe rent burden
- 452.0
Population outlook (Montgomery County) Hauer SSP2
- Today (2025)
- 856,074 people
- By 2030
- 870,887 · +1.7%
- By 2040
- 891,195 · +4.1%
- By 2050
- 896,417 · +4.7%
- By 2075
- 903,212 · +5.5%
- By 2100
- 843,240 · -1.5%
Race, ethnicity, and origin ACS 2023
- Neighborhood character
- Predominantly White (74%)
- Race & ethnicity
- White 74% Asian 9% Black 9% Hispanic / Latino 5% Two or more races 4%
- Hispanic origin (detail)
- Puerto Rican 2%
- Common ancestry
- Romanian 6% Lithuanian 2% Slovak 1%
- Foreign-born
- 10% · Canada, China, South Korea
- Languages at home
- 87% English-only · Spanish 4% Other Indo-European 4% Other Asian/Pacific 2%
Political lean MEDSL · Montgomery
- 2024 margin
- Strong D (+22.8) · D 60.9% · R 38.1% · Other 1.1%
- 2008→2024 swing
- +2.0pp toward D · 2008: 20.8pp · 2024: 22.8pp
- All cycles
- 2024: D+22.8 2020: D+26.3 2016: D+21.1 2012: D+14.3 2008: D+20.8
Not yet ingested
- Civics
- —
Market trends
- HPI YoY
- ▼ -249.96%
- Current HPI
- 287.7659
- Rent YoY
- ▼ -0.32%
- Metro
- Philadelphia-Camden-Wilmington, PA-NJ-DE-MD
- State GDP YoY
- ▲ 1.68%
- F500 in state
- 34
Industry mix (Fortune 500 HQ in PA)
| Industry | F500 HQs | Revenue |
|---|---|---|
| Healthcare | 2 | $309B |
|
||
| Insurance | 2 | $27B |
|
||
| Telecommunications / Media | 1 | $124B |
|
||
| Industrial Distribution | 1 | $22B |
|
||
| Financial Services | 1 | $20B |
|
||
| Chemicals / Materials | 1 | $18B |
|
||
Price history
+177.7% since first listed8 events — show timeline
- 2026-06-01 Listed $249,900 BRIGHT MLS
- 1997-11-06 Sold (Public Records) $165,000 Public Records
- 1997-09-30 Listing Removed — BRIGHT MLS
- 1997-05-30 Listed $169,900 BRIGHT MLS
- 1997-03-07 Listing Removed — BRIGHT MLS
- 1997-03-07 Listed $169,900 BRIGHT MLS
- 1989-05-25 Sold (Public Records) $167,900 Public Records
- 1984-09-06 Sold (Public Records) $90,000 Public Records
Property tax history
+0.9%/yrLatest (2026): $5,492 · +3.8% YoY. Source: county tax records.
Cash-flow waterfall
monthlySold comps — $/sqft
last 12 mo · ≤1 miLoading sold comps…