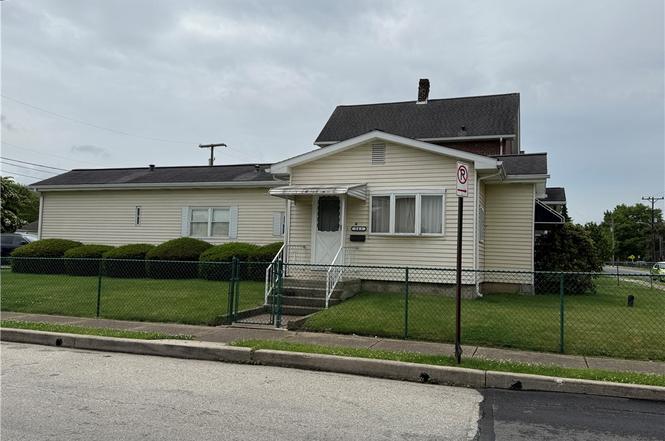
343 Oak St · Latrobe, PA
Flood risk 8/10 · Major
- FEMA flood zone
- X (unshaded)
- Chance of flooding over 30 yrs
- 0.99%
- Est. flood insurance / yr
- $507 – $1,088
Fire risk 1/10 · Minimal
- Est. fire insurance / yr
- $511 – $949
Heat risk 4/10 · Minor
- Hot days now (above 96°F)
- 7 days/yr
- Hot days in 30 yrs
- 19 days/yr
Wind risk 2/10 · Minimal
- Chance of severe wind over 30 yrs
- —
Air-quality risk 2/10 · Minimal
- Unhealthy air days now
- 1 days/yr
- Unhealthy air days in 30 yrs
- 2 days/yr
Risk factors via First Street. Map © Google.
Why this score? — see what drove the C+ grade
The composite is a weighted blend of 9 inputs, each scored 0–100. Each bar is that input's sub-score; the figure is the points it added to the 100-point composite (weight × sub-score).
- Cash flow +26.2/30.0
- DSCR +8.9/10.0
- ARV discount +7.5/15.0
- 1% rule +6.3/10.0
- Schools +4.9/10.0
- Rent growth +4.0/5.0
- Livability +4.0/5.0
- Condition / age +2.5/5.0
- Appreciation +0.0/10.0
$108,000
🖨 Deal sheet 📄 Offer letter ✓ Due diligence
Listing remarks
Super clean mobile a full foundation. Great corner lot and fully fenced yard. New storm door to begin stalled the week of 06/15/2026. Move in ready and very well-maintained.
Key facts
- Full foundation
- Well maintained
- Move in ready
Tags
Property features AI
Finance
- Other: Resale condition
- Financial info: Not specified
- HOA & community: Not specified
Exterior
- Parking: Off-street parking; 2 parking spaces
- Security: Not specified
- Utilities: Public water; Public sewer
- Home design: Single-story home; Resale property
- Construction: Aluminum siding; Asphalt roof; Crawl space foundation; Built previously (year not specified)
- Exterior features: Small lot (approximately 0.114 acre)
Interior
- Kitchen: Dishwasher; Electric stove; Refrigerator; Some electric appliances
- Bedrooms: Not specified
- Flooring: Vinyl flooring; Carpet
- Bathrooms: 1 full bathroom
- Heating & cooling: Electric forced-air heating; Wall/window air conditioning unit(s)
- Interior features: Window treatments throughout; Screens on windows
- Laundry & utility: Washer; Dryer
Neighborhood map
What this means for you Summary
Snapshot
- This is a 3-bed/1.0-bath other listed at $108k.
Deal economics
- At list price, monthly cash flow is $210 ($3k/yr) — positive.
- The deal already cash-flows at list — no discount required.
- Meets the 1% rule at list price ($1k rent vs $108k).
Location & tenants
- Location reads 81/100 on livability (#181 in PA, #1,511 nationally) — a professional / high-income tenant draw. Strengths: cost of living A+, housing A+, health & safety A+; Watch: amenities F, commute F.
- Greater Latrobe SD (suburban): math 52% / reading 62% proficiency, ranked #94 of 539 in PA (top 17%) — acceptable for families but not a draw, mixed tenant base, ~2y average lease.
- Market conditions: Rents rising fast (+6.2%/yr); 110 active listings in the ZIP; 1 comparable units currently listed for rent nearby; 415 units permitted in Westmoreland County in 2024 (10 in 5+ unit buildings).
Forward outlook
- Local home prices are declining (-3.0%/yr); year-one equity from $747 of loan paydown is wiped out by about $3k of value loss. Plan a longer hold.
- Westmoreland County population projected at -19% by 2050 — secular population decline; favor cash flow + early exit over multi-decade hold.
- At projected returns (-3.0% appreciation + 6.2% rent growth), your $30k cash investment doubles in ~9 years — after that, you're playing with house money.
Negotiation context
- Only 5 days on market — expect competitive offers; lowballing is unlikely to land.
Risks & watch-outs
- Watch-outs: flood insurance adds $66/mo.
- Climate carrying-cost: severe flood risk — expect insurance premiums to compound above CPI over the hold.
Questions for the listing agent
- Built in 1974 — when were the roof, HVAC, electrical panel, plumbing, and water heater last replaced?
- What's the actual annual flood-insurance premium (NFIP or private), and is the property in a SFHA with mandatory coverage?
- Is there a deadline driving the sale (1031 exchange, divorce, estate, relocation)? That informs how much negotiation room exists.
- Schools are B-rated — typically a magnet for longer-tenancy family renters. What's the average tenant stay here, and is there a school-zone premium baked into asking?
- What's the average days-on-market for RENTAL listings here right now (not sales)? A rising rental-DOM trend means longer vacancies and softer asking-rent achievability than the comps imply.
- What's the recent tenant-quality profile in this submarket — average credit score on applications, eviction rate, late-payment / NSF rate, and stable-employment percentage? A property-management company in the area should have these aggregated.
- How much new for-sale + rental construction is in the pipeline within 1–3 miles? Heavy new supply typically softens prices + rents 12–24 months out; constrained supply supports both.
Investment metrics
- 1% rule
- 1.13% ✓
- Cap rate
- 9.37%
- Cash-on-cash
- 10.99%
- DSCR
- 1.49
- GRM
- 7.4
CMA / ARV
No comps found within radius.
Projected returns pro-forma
-3.0% appreciation · 6.19% rent growth · sell at horizon
- IRR
- -0.0%
- Equity multiple
- 1.00×
- Total profit
- $-44
- Equity at exit
- $16,103
- IRR
- 12.7%
- Equity multiple
- 2.16×
- Total profit
- $34,979
- Equity at exit
- $9,338
Cash invested: $30,240 (down + closing). Projections, not guarantees.
Landlord ↔ Tenant lean methodology
- Overall (STATE)
- 62 Landlord-Friendly
- State Pennsylvania
- 62 Landlord-Friendly · EVEN
- County
- — inherits STATE
- City
- — inherits STATE
ZIP-level market 15650
- Rents YoY
- 6.2%
- Active inventory
- 110
- Price-to-rent
- 7.4×
Monthly cashflow live
- Estimated rent
- $1,218 medium interval (Pro) →
- Mortgage (P&I)
- −$566
- Tax from tax record
- −$74 /mo · $885/yr
- Insurance
- −$45
- Flood insurance flood zone
- −$66 /mo · $798/yr
- HOA
- −$0
- Vacancy / Maint / Mgmt
- −$256
- Net cashflow
- $210
Break-even live
UW: 25.0% down · 7.5% · 30yr · 1.5% tax · 5.0% vac · 8.0% maint · 8.0% mgmt
Financing live
Cash to close
- Down payment
- $27,000
- Closing costs
- $3,240
- Reserves months
- —
- Total cash needed
- —
Loan-product check · same deal, 3 products live
Conventional
25% down · 7.5% · 30yr
- Down + closing
- —
- Monthly P&I
- —
- Monthly cashflow
- —
- DSCR
- —
- Eligible?
- —
Personal DTI + credit; lowest rate.
DSCR
20% down · 8.5% · 30yr
- Down + closing
- —
- Monthly P&I
- —
- Monthly cashflow
- —
- DSCR
- —
- Eligible?
- —
No personal income docs; deal must DSCR.
Hard money
10% down · 12.0% · 12mo
- Down + closing
- —
- Monthly P&I
- —
- Monthly cashflow
- —
- DSCR
- —
- Eligible?
- —
Short-term bridge; refi at stabilization.
Rent comps 1 comps
| Address | Beds | Baths | Sqft | Rent | $/sqft | DOM | Units | Dist |
|---|---|---|---|---|---|---|---|---|
| 26 E 1st Ave Latrobe, PA | 2.0 | 1.0 | 1200 | $1,100 | $0.92 | 1d | 1 | 0.15mi |
Listing history 5 events
-
2026-06-18days on market $108,000 Active 5 DOM
-
2026-06-17days on market $108,000 Active 4 DOM
-
2026-06-16days on market $108,000 Active 3 DOM
-
2026-06-15remarks 174-char remark
-
2026-06-15$108,000 Active 2 DOM
ⓘ Source: listings_history table (triggers on properties + properties_extension) + one-shot
backfill from property_details.listing_events for pre-trigger history.
Tax reassessment forecast PA · Partial reset (capped growth)
- Current annual tax
- $885 · $74/mo
- Projected year-2 tax
- $1,296 · $108/mo
- Expected delta
- +$411/yr (+$34/mo · 46.4%)
ⓘ Screening estimate from a state-policy table — verify with the county assessor before closing.
Climate risk First Street
- Flood 8/10 Severe FEMA zone X (unshaded) · 99% chance over 30 yrs
- Wildfire 1/10 Low
- Heat 4/10 Moderate 7 d/yr ≥96°F today · 19 d/yr by 30 yrs out
- Wind 2/10 Low
- Air quality 2/10 Low 1 unhealthy d/yr today · 2 by 30 yrs out
Nearby sold comps map
Loading sold comps map…
Walkable amenities ~0.75 mi
Loading nearby amenities…
Taxation est. · year 1
- Rental income
- $14,613
- − Mortgage interest
- −$6,050
- − Property taxes
- −$885
- − Insurance
- −$1,338
- − Repairs & maintenance
- −$1,169
- − Management
- −$1,169
- − Depreciation
- −$3,142
- Taxable income
- $861
- Est. tax owed @ 24.0%
- −$207
- After-tax cash flow
- $2,318/yr
For passive investors: Depreciation is non-cash, so a rental often shows a tax loss while cash-flowing — sheltering income. Rental losses are passive: they offset passive income freely, and up to $25,000/yr can offset ordinary (W-2) income if you actively participate and your MAGI is under $100k (phasing out to $0 by $150k); unused losses carry forward. On sale, claimed depreciation is recaptured at up to 25%, and gains may owe capital-gains tax (a 1031 exchange can defer both). Figures are a year-1 estimate at your 24.0% rate — not tax advice; consult a CPA.
Schools (NCES district)
- District
- Greater Latrobe SD
- NCES district ID
- 4210980
- Math proficiency
- 52% ▼ -10.00%
- Reading proficiency
- 62% ▼ -17.00%
- Median HH income
- $53,111
- Composite
- 48.85/100
- National rank
- #2087
- State rank
- #94 of 539 in PA
Livability — Latrobe
- Score
- 81/100
- State rank
- #181
- US rank
- #1511
Category grades
Schools grade is shown separately in the Schools card above.
Census & demographics
- Census place
- Latrobe, PA
- County
- Westmoreland County · 183,777 people
- City population
- 26,312
- Metro
- Pittsburgh, PA
- Population (ZIP)
- 26,312
- Household income
- $63,305
- Rent vs Own
- Severe rent burden
- 714.0
Population outlook (Westmoreland County) Hauer SSP2
- Today (2025)
- 342,555 people
- By 2030
- 331,717 · -3.2%
- By 2040
- 304,976 · -11.0%
- By 2050
- 277,444 · -19.0%
- By 2075
- 224,607 · -34.4%
- By 2100
- 171,084 · -50.1%
Race, ethnicity, and origin ACS 2023
- Neighborhood character
- Predominantly White (95%)
- Race & ethnicity
- White 95% Two or more races 3%
- Common ancestry
- Romanian 10% Slovak 2% Scotch-Irish 2%
- Foreign-born
- 1%
- Languages at home
- 98% English-only · Spanish 1%
Political lean MEDSL · Westmoreland
- 2024 margin
- Strong R (+28.4) · D 35.4% · R 63.9%
- 2008→2024 swing
- -11.7pp toward R · 2008: -16.7pp · 2024: -28.4pp
- All cycles
- 2024: R+28.4 2020: R+28.3 2016: R+31.3 2012: R+23.7 2008: R+16.7
Not yet ingested
- Civics
- —
Market trends
- HPI YoY
- ▼ -119.30%
- Current HPI
- 152.0097
- Rent YoY
- ▲ 6.19%
- Metro
- Pittsburgh, PA
- State GDP YoY
- ▲ 1.68%
- F500 in state
- 34
Industry mix (Fortune 500 HQ in PA)
| Industry | F500 HQs | Revenue |
|---|---|---|
| Healthcare | 2 | $309B |
|
||
| Insurance | 2 | $27B |
|
||
| Telecommunications / Media | 1 | $124B |
|
||
| Industrial Distribution | 1 | $22B |
|
||
| Financial Services | 1 | $20B |
|
||
| Chemicals / Materials | 1 | $18B |
|
||
Price history
1 event — show timeline
- 2026-06-13 Listed $108,000 West Penn MLS
Property tax history
+1.3%/yrLatest (2026): $885 · -0.0% YoY. Source: county tax records.
Cash-flow waterfall
monthlySold comps — $/sqft
last 12 mo · ≤1 miLoading sold comps…