111 Camp Creek Rd Unit 1-4 · Cateechee, SC
Flood risk 1/10 · Minimal
- FEMA flood zone
- X (unshaded)
- Chance of flooding over 30 yrs
- 0.0%
- Est. flood insurance / yr
- $507 – $1,088
Fire risk 5/10 · Moderate
- Est. fire insurance / yr
- $783 – $1,453
Heat risk 5/10 · Moderate
- Hot days now (above 105°F)
- 7 days/yr
- Hot days in 30 yrs
- 17 days/yr
Wind risk 2/10 · Minimal
- Chance of severe wind over 30 yrs
- 0.0%
Air-quality risk 3/10 · Minor
- Unhealthy air days now
- 3 days/yr
- Unhealthy air days in 30 yrs
- 4 days/yr
Risk factors via First Street. Map © Google.
Why this score? — see what drove the F grade
The composite is a weighted blend of 9 inputs, each scored 0–100. Each bar is that input's sub-score; the figure is the points it added to the 100-point composite (weight × sub-score).
- ARV discount +7.5/15.0
- Schools +3.9/10.0
- Rent growth +2.5/5.0
- Livability +2.5/5.0
- Condition / age +2.2/5.0
- Cash flow +0.4/30.0
- 1% rule +0.0/10.0
- DSCR +0.0/10.0
- Appreciation +0.0/10.0
$425,000
🖨 Deal sheet 📄 Offer letter ✓ Due diligence
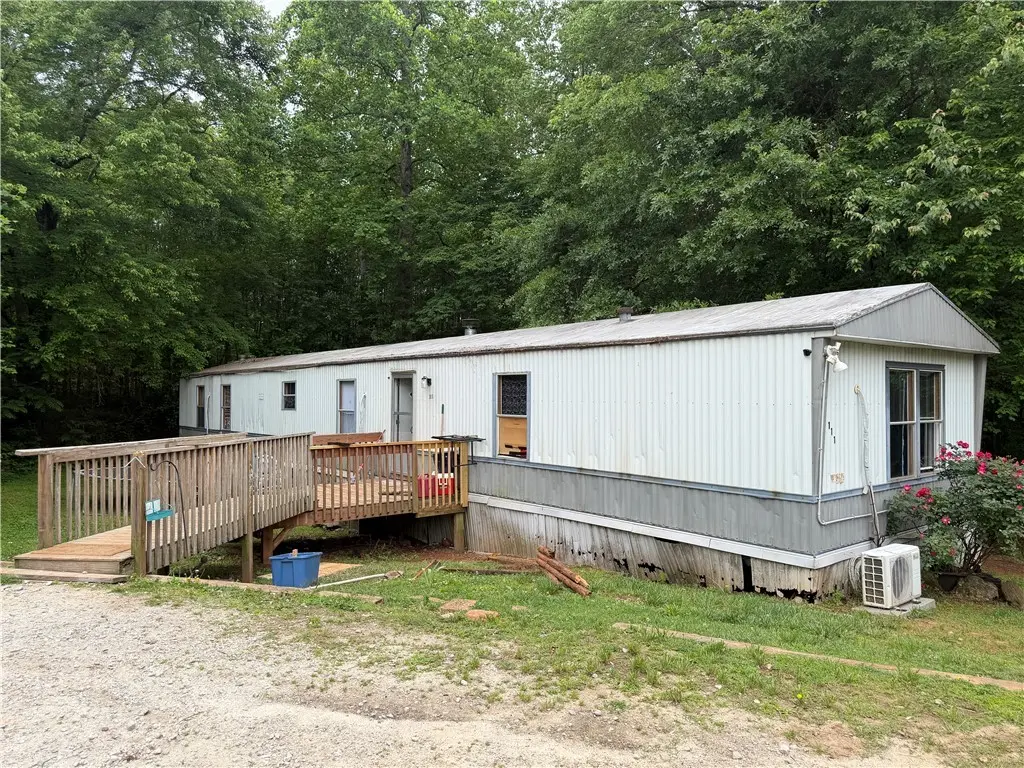
Listing remarks
Calling all Investors. .. .. Great Cash Flow Opportunity!! One single family home and three mobile homes. Three of the units are rented. One of the mobile homes is being renovated, which is currently vacant, but is just about ready to rent. There are three parcels totaling @ 2.09 acres. So there are options to adding additional income by bringing in other units if so desired. There are only two water meters in place. Potential income is $4,300 monthly.
Key facts
- 2.09 acre lot
- Listed 28 days
Property features AI
Finance
- Financial info: Lease term commonly offered: twelve months
Exterior
- Utilities: Public water available; Septic tank sewer
- Home design: Single-story building
- Construction: Aluminum siding; Wood siding; Metal roof; Building is 31–50 years old
- Exterior features: Not in a subdivision; Outside city limits; Approximately 2.09 acres
Interior
- Kitchen: Oven; Range; Refrigerator
- Bedrooms: Total of 14 units (multi-unit property)
- Heating & cooling: Central heating; Electric heating; Heat pump; Central air conditioning; Electric cooling; Forced air; Heat pump cooling
- Interior features: Central heating and cooling; Individual heating controls
Neighborhood map
What this means for you Summary
Snapshot
- This is a condo listed at $425k. Condition is rated fair.
Deal economics
- At list price, monthly cash flow is $-2k ($-22k/yr) — negative.
- To cash-flow at today's rent, offer at most $154k (63.7% below list).
- To meet the 1% rule (rent ≥ 1% of price), the offer needs to be $135k (68.2% below list).
- Recommended offer: $135k (68.2% below list) — sets the bar for 1% rule.
Location & tenants
- Location reads: area grade F — affects rentability + tenant quality, not the cash-flow math above.
- Pickens 01 (rural): math 42% / reading 50% proficiency, ranked #21 of 80 in SC (top 26%) — families likely to look elsewhere, expect single-tenant / working-renter base with shorter leases.
- Market conditions: 153 active listings in the ZIP; 1,440 units permitted in Pickens County in 2024 (245 in 5+ unit buildings).
Forward outlook
- Local home prices are declining (-3.0%/yr); year-one equity from $3k of loan paydown is wiped out by about $13k of value loss. Plan a longer hold.
- Pickens County population projected at +6% by 2050 — modest demand growth; plan on rents tracking national, not racing it.
Negotiation context
- It's been on market 28 days — a 2% lower offer ($419k) is reasonable based on typical stale-listing flexibility.
Risks & watch-outs
- Climate carrying-cost: moderate wildfire risk; extreme-heat days projected 7→17/yr by 2055 (HVAC capex compounding) — expect insurance premiums to compound above CPI over the hold.
Questions for the listing agent
- What do current leases actually rent for vs. the listed asking? Can we see a recent rent roll and the last 12 months of T-12 income?
- Have any recent inspections been done? Can we get a copy of the seller's disclosures and any deferred-maintenance estimates?
- Any open or pending special assessments — roof, HVAC, plumbing, elevator, façade? What's the per-unit balance and payoff schedule, and is the seller paying it off at close or rolling it to the buyer?
- Is there a deadline driving the sale (1031 exchange, divorce, estate, relocation)? That informs how much negotiation room exists.
- The area grade is low — what's the realistic commute time and amenity access for the typical tenant pool here? Any planned neighborhood developments (good or bad) we should know about?
- What's the average days-on-market for RENTAL listings here right now (not sales)? A rising rental-DOM trend means longer vacancies and softer asking-rent achievability than the comps imply.
- What's the recent tenant-quality profile in this submarket — average credit score on applications, eviction rate, late-payment / NSF rate, and stable-employment percentage? A property-management company in the area should have these aggregated.
- How much new apartment / multifamily construction is in the pipeline within 1–3 miles? Heavy new supply (>2% of stock underway) typically softens rents 12–24 months out; light construction supports rent growth.
Investment metrics
- 1% rule
- 0.32% ✗
- Cap rate
- 1.01%
- Cash-on-cash
- -18.86%
- DSCR
- 0.16
- GRM
- 26.2
CMA / ARV
No comps found within radius.
Projected returns pro-forma
-3.0% appreciation · 3.0% rent growth · sell at horizon
- IRR
- -54.7%
- Equity multiple
- -0.58×
- Total profit
- $-187,939
- Equity at exit
- $63,369
- IRR
- —
- Equity multiple
- -1.66×
- Total profit
- $-316,919
- Equity at exit
- $36,746
Cash invested: $119,000 (down + closing). Projections, not guarantees.
Landlord ↔ Tenant lean methodology
- Overall (STATE)
- 90 Strongly Landlord-Friendly
- State South Carolina
- 90 Strongly Landlord-Friendly · R+6
- County
- — inherits STATE
- City
- — inherits STATE
ZIP-level market 29630
- Home prices YoY
- -15.3%
- Active inventory
- 153
- Price-to-rent
- 26.2×
Monthly cashflow live
- Estimated rent
- $1,351 medium interval (Pro) →
- Mortgage (P&I)
- −$2,229
- Tax est. 1.5%
- −$531 /mo · $6,375/yr
- Insurance
- −$177
- HOA
- −$0
- Vacancy / Maint / Mgmt
- −$284
- Net cashflow
- $-1,870
Break-even live
UW: 25.0% down · 7.5% · 30yr · 1.5% tax · 5.0% vac · 8.0% maint · 8.0% mgmt
Financing live
Cash to close
- Down payment
- $106,250
- Closing costs
- $12,750
- Reserves months
- —
- Total cash needed
- —
Loan-product check · same deal, 3 products live
Conventional
25% down · 7.5% · 30yr
- Down + closing
- —
- Monthly P&I
- —
- Monthly cashflow
- —
- DSCR
- —
- Eligible?
- —
Personal DTI + credit; lowest rate.
DSCR
20% down · 8.5% · 30yr
- Down + closing
- —
- Monthly P&I
- —
- Monthly cashflow
- —
- DSCR
- —
- Eligible?
- —
No personal income docs; deal must DSCR.
Hard money
10% down · 12.0% · 12mo
- Down + closing
- —
- Monthly P&I
- —
- Monthly cashflow
- —
- DSCR
- —
- Eligible?
- —
Short-term bridge; refi at stabilization.
HOA detail condo
- Monthly dues
- $0 · $0/yr
- Likely covers
- water
- Assessments
- None detected in remarks — confirm with the listing agent.
Listing history 15 events
-
2026-06-18days on market $425,000 Active 28 DOM
-
2026-06-17days on market $425,000 Active 27 DOM
-
2026-06-16days on market $425,000 Active 26 DOM
-
2026-06-15days on market $425,000 Active 25 DOM
-
2026-06-13days on market $425,000 Active 23 DOM
-
2026-06-10days on market $425,000 Active 20 DOM
-
2026-06-09days on market $425,000 Active 19 DOM
-
2026-06-08days on market $425,000 Active 18 DOM
-
2026-06-07days on market $425,000 Active 17 DOM
-
2026-06-05days on market $425,000 Active 14 DOM
-
2026-06-03days on market $425,000 Active 13 DOM
-
2026-06-03days on market $425,000 Active 12 DOM
-
2026-06-01days on market $425,000 Active 11 DOM
-
2026-05-31days on market $425,000 Active 10 DOM
-
2026-05-21$425,000 Active
ⓘ Source: listings_history table (triggers on properties + properties_extension) + one-shot
backfill from property_details.listing_events for pre-trigger history.
Climate risk First Street
- Flood 1/10 Low FEMA zone X (unshaded) · 0% chance over 30 yrs
- Wildfire 5/10 Major
- Heat 5/10 Major 7 d/yr ≥105°F today · 17 d/yr by 30 yrs out
- Wind 2/10 Low 0% chance of damaging wind over 30 yrs
- Air quality 3/10 Moderate 3 unhealthy d/yr today · 4 by 30 yrs out
Nearby sold comps map
Loading sold comps map…
Walkable amenities ~0.75 mi
Loading nearby amenities…
Taxation est. · year 1
- Rental income
- $16,211
- − Mortgage interest
- −$23,807
- − Property taxes
- −$6,375
- − Insurance
- −$2,125
- − Repairs & maintenance
- −$1,297
- − Management
- −$1,297
- − Depreciation
- −$12,364
- Taxable loss
- −$31,053
- Est. tax savings @ 24.0%
- +$7,453
- After-tax cash flow
- $-14,985/yr
For passive investors: Depreciation is non-cash, so a rental often shows a tax loss while cash-flowing — sheltering income. Rental losses are passive: they offset passive income freely, and up to $25,000/yr can offset ordinary (W-2) income if you actively participate and your MAGI is under $100k (phasing out to $0 by $150k); unused losses carry forward. On sale, claimed depreciation is recaptured at up to 25%, and gains may owe capital-gains tax (a 1031 exchange can defer both). Figures are a year-1 estimate at your 24.0% rate — not tax advice; consult a CPA.
Condition & rehab AI · 14 photos
The property presents as a moderate renovation opportunity with average condition. It requires some cosmetic updates and maintenance to improve its resale and rental value.
Repairs flagged
- Minor Kitchen cabinets — Worn appearance, but not damaged.
- Moderate Exterior siding — Visible wear and faded paint.
- Minor Landscaping — Sparse and overgrown.
Value-add opportunities
- Both Paint and touch up interior walls — Fresh paint and touch-ups can significantly improve the home's appearance and appeal to buyers/renters.
- Both Landscaping and curb appeal — A well-maintained exterior can enhance the home's curb appeal and attract more potential buyers/renters.
- Both Deep clean and organize kitchen and bathrooms — A clean and organized interior can make the home more inviting and appealing to potential buyers/renters.
Renovation cost estimate screening
| Repair item | Severity | Est. cost |
|---|---|---|
| Kitchen cabinets · Worn appearance, but not damaged. | Minor | $500–3,000 |
| Exterior siding · Visible wear and faded paint. | Moderate | $3,000–15,000 |
| Landscaping · Sparse and overgrown. | Minor | $500–3,000 |
| Total estimated repair cost · 3 items | $4,000–21,000 |
Value-add ROI direction
- Both Paint and touch up interior walls — Fresh paint and touch-ups can significantly improve the home's appearance and appeal to buyers/renters. ↑
- Both Landscaping and curb appeal — A well-maintained exterior can enhance the home's curb appeal and attract more potential buyers/renters. ↑
- Both Deep clean and organize kitchen and bathrooms — A clean and organized interior can make the home more inviting and appealing to potential buyers/renters. ↑
ⓘ Cost ranges are severity-bucket heuristics (US national rule-of-thumb). Get contractor quotes + a written scope before underwriting a rehab budget.
Schools (NCES district)
- District
- Pickens 01
- NCES district ID
- 4503330
- Math proficiency
- 42% ▼ -11.00%
- Reading proficiency
- 50% ▼ -2.00%
- Median HH income
- $42,534
- Composite
- 38.73/100
- National rank
- #4130
- State rank
- #21 of 80 in SC
Livability — Cateechee
No livability data for this city. (Only ~50 U.S. cities are tracked.)
Census & demographics
- County
- Pickens County · 102,825 people
- Metro
- Greenville-Anderson, SC
- Population (ZIP)
- 15,982
- Household income
- $55,264
- Rent vs Own
- Severe rent burden
- 803.0
Population outlook (Pickens County) Hauer SSP2
- Today (2025)
- 126,530 people
- By 2030
- 128,780 · +1.8%
- By 2040
- 132,151 · +4.4%
- By 2050
- 133,800 · +5.7%
- By 2075
- 137,594 · +8.7%
- By 2100
- 139,784 · +10.5%
Race, ethnicity, and origin ACS 2023
- Neighborhood character
- Predominantly White (77%)
- Race & ethnicity
- White 77% Two or more races 8% Hispanic / Latino 6% Black 6% Asian 5%
- Hispanic origin (detail)
- Mexican 2% Cuban 2%
- Common ancestry
- Lithuanian 4% Slovak 3% Serbian 2%
- Foreign-born
- 6% · Canada, China, Dominican Republic
- Languages at home
- 91% English-only · Spanish 4% Chinese 2% Other Indo-European 2%
Political lean MEDSL · Pickens
- 2024 margin
- Solid R (+52.7) · D 23.0% · R 75.6% · Other 1.4%
- 2008→2024 swing
- -6.4pp toward R · 2008: -46.2pp · 2024: -52.7pp
- All cycles
- 2024: R+52.7 2020: R+50.9 2016: R+52.7 2012: R+49.0 2008: R+46.2
Not yet ingested
- Civics
- —
Market trends
- HPI YoY
- ▼ -53.24%
- Current HPI
- 293.5998
- Rent YoY
- —
- Metro
- Greenville-Anderson, SC
- State GDP YoY
- ▲ 4.51%
- F500 in state
- 2
Industry mix (Fortune 500 HQ in SC)
| Industry | F500 HQs | Revenue |
|---|---|---|
| Packaging | 1 | $7B |
|
||
Price history
1 event — show timeline
- 2026-05-21 Listed $425,000 WUMLS
Cash-flow waterfall
monthlySold comps — $/sqft
last 12 mo · ≤1 miLoading sold comps…