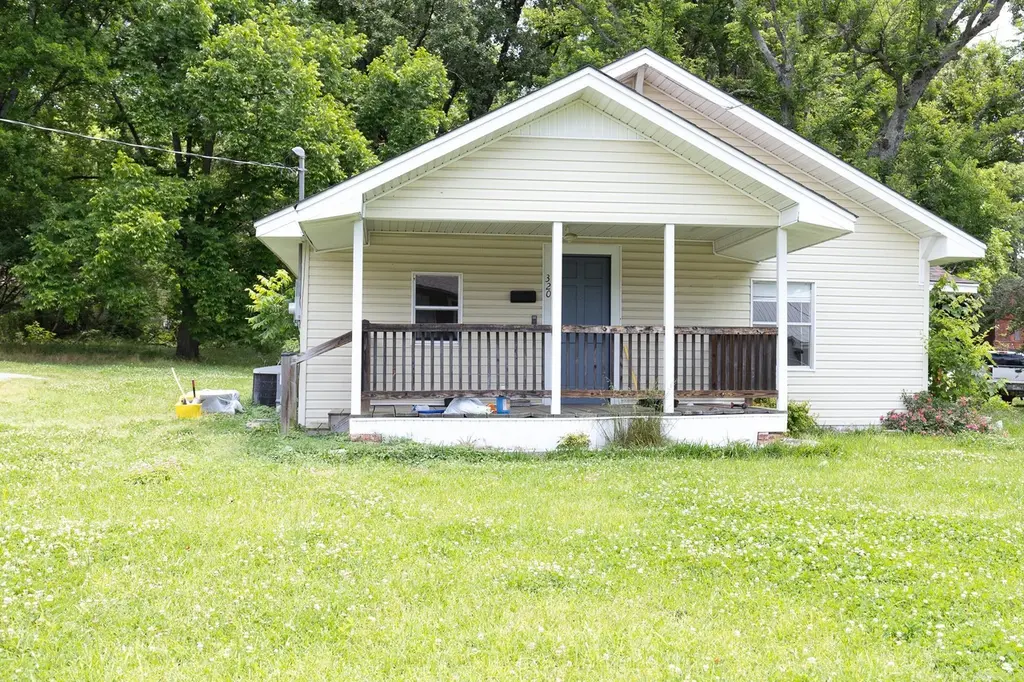
320 S Border · Benton, AR
Flood risk 1/10 · Minimal
- FEMA flood zone
- X (unshaded)
- Chance of flooding over 30 yrs
- 0.0%
- Est. flood insurance / yr
- $507 – $1,088
Fire risk 3/10 · Minor
- Est. fire insurance / yr
- $1,499 – $2,785
Heat risk 6/10 · Moderate
- Hot days now (above 110°F)
- 7 days/yr
- Hot days in 30 yrs
- 20 days/yr
Wind risk 4/10 · Minor
- Chance of severe wind over 30 yrs
- 11.0%
Air-quality risk 2/10 · Minimal
- Unhealthy air days now
- 0 days/yr
- Unhealthy air days in 30 yrs
- 1 days/yr
Risk factors via First Street. Map © Google.
Why this score? — see what drove the C+ grade
The composite is a weighted blend of 9 inputs, each scored 0–100. Each bar is that input's sub-score; the figure is the points it added to the 100-point composite (weight × sub-score).
- Cash flow +24.0/30.0
- ARV discount +14.1/15.0
- DSCR +7.7/10.0
- 1% rule +4.9/10.0
- Schools +4.1/10.0
- Livability +3.3/5.0
- Rent growth +2.7/5.0
- Condition / age +2.5/5.0
- Appreciation +0.0/10.0
$95,000
🖨 Deal sheet 📄 Offer letter ✓ Due diligence
Listing remarks MLS
Remodeled Home within walking distance to schools. Features two bedrooms one bath, Vinyl Plank floors, new cabinets, rolling island in the kitchen and a big covered front porch sitting on a half acre lot.
Key facts
- Room to build
- Remodeled
- New roof
Tags
Property features AI
Finance
- Financial info: Cash or in-house financing available
Exterior
- Utilities: Public sewer; Public water; Co-op electric; Natural gas
- Home design: Single-family property; Approx. 896 square feet; Sits on about 0.56 acre
- Construction: Metal/vinyl siding; Architectural shingle roof; Crawl space foundation; Built with conventional construction
- Exterior features: Front porch; Paved road access; Not in a subdivision; Inside city limits
Interior
- Kitchen: Free-standing stove; Gas range; Dishwasher; Pantry
- Flooring: Luxury vinyl flooring
- Bathrooms: 1 full bathroom
- Heating & cooling: Central gas heat; Central electric cooling
- Interior features: Washer connection; Electric dryer connection
- Laundry & utility: Washer hookup; Electric dryer hookup
Neighborhood map
What this means for you Summary
Snapshot
- This is a 2-bed/1.0-bath single-family listed at $95k.
Deal economics
- At list price, monthly cash flow is $186 ($2k/yr) — positive.
- The deal already cash-flows at list — no discount required.
- To meet the 1% rule (rent ≥ 1% of price), the offer needs to be $94k (1.1% below list).
- Recommended offer: $94k (1.1% below list) — sets the bar for 1% rule.
- Cap rate 8.6% vs local median 4.5% in Benton — top-decile yield for the area; either an underpriced asset or a hidden risk that comps aren't pricing in. Stress-test before assuming the spread holds.
Location & tenants
- Location reads 66/100 on livability (#119 in AR) — a middle-class / working-renter tenant base. Strengths: cost of living A+, housing A+; Watch: crime D, amenities F, commute F.
- Benton School District (suburban): math 51% / reading 43% proficiency, ranked #25 of 238 in AR (top 10%) — families likely to look elsewhere, expect single-tenant / working-renter base with shorter leases.
- Market conditions: Rents flat; 195 active listings in the ZIP; 11 comparable units currently listed for rent nearby; rentals lingering (median 44d on market — plan ~5-8 weeks vacancy on turnover, expect pricing pressure); 55% of comp listings sitting > 30 days — soft ceiling on asking rent; 446 units permitted in Saline County in 2024 (0 in 5+ unit buildings).
- This rent is only 17% of the median local income ($66k/yr) — well below the 30% rent-burden line; pricing power to push rent on renewal without tenant pushback.
Forward outlook
- Local home prices are declining (-3.0%/yr); year-one equity from $657 of loan paydown is wiped out by about $3k of value loss. Plan a longer hold.
- Saline County population projected at +39% by 2050 — long-run rental-demand tailwind backs the buy-and-hold thesis.
Negotiation context
- Only 6 days on market — expect competitive offers; lowballing is unlikely to land.
- 2 sale attempts since 4y ago with the ask held roughly flat each time — persistent listings suggest the price (not the market) is what's stuck; bring a comps-based counter.
Risks & watch-outs
- Watch-outs: built in 1944 — expect roof / HVAC / electrical / plumbing capex.
- Climate carrying-cost: extreme-heat days projected 7→20/yr by 2055 (HVAC capex compounding) — expect insurance premiums to compound above CPI over the hold.
Questions for the listing agent
- Built in 1944 — when were the roof, HVAC, electrical panel, plumbing, and water heater last replaced?
- Is there a deadline driving the sale (1031 exchange, divorce, estate, relocation)? That informs how much negotiation room exists.
- Crime grade is D in this area — have there been break-ins, vandalism, or insurance claims at this property in the last 3 years? What carrier currently insures it and at what premium?
- What's the average days-on-market for RENTAL listings here right now (not sales)? A rising rental-DOM trend means longer vacancies and softer asking-rent achievability than the comps imply.
- What's the recent tenant-quality profile in this submarket — average credit score on applications, eviction rate, late-payment / NSF rate, and stable-employment percentage? A property-management company in the area should have these aggregated.
- How much new for-sale + rental construction is in the pipeline within 1–3 miles? Heavy new supply typically softens prices + rents 12–24 months out; constrained supply supports both.
Investment metrics
- 1% rule
- 0.99% ✗
- Cap rate
- 8.64%
- Cash-on-cash
- 8.37%
- DSCR
- 1.37
- GRM
- 8.4
CMA / ARV
- ARV (median comp)
- $111,346
- List price
- $95,000
- Delta
- -14.68%
- Verdict
- UNDERPRICED
- Comps
- 20 within 1.0 mi
Show comp detail 12 sales within ~0.75 mi
| Address | Dist | Beds/Ba | Sqft | Sold | Price | $/sf | Match |
|---|---|---|---|---|---|---|---|
| 320 S Border | 0.00mi | 2/1.0 | 896 (0%) | 0mo | $95,000 | $106 | 100 |
| 152 Border Cir | 0.38mi | 2/1.0 | 884 (-1%) | 2mo | $145,000 | $164 | 78 |
| 205 S Third St | 0.36mi | 2/1.0 | 858 (-4%) | 6mo | $50,500 | $59 | 71 |
| 707 Schley St | 0.27mi | 2/2.0 | 968 (+8%) | 1mo | $169,900 | $176 | 69 |
| 308 S Third St | 0.32mi | 2/2.0 | 852 (-5%) | 6mo | $138,500 | $163 | 68 |
| 419 Pearson St | 0.57mi | 2/2.0 | 884 (-1%) | 1mo | $127,600 | $144 | 66 |
| 821 Tulane St | 0.29mi | 3/1.0 (+1) | 1,000 (+12%) | 4mo | $142,000 | $142 | 59 |
| 412 E South St | 0.48mi | 2/1.0 | 960 (+7%) | 10mo | $155,000 | $161 | 58 |
| 820 Adrian St | 0.71mi | 2/1.0 | 850 (-5%) | 2mo | $115,000 | $135 | 56 |
| 1007 Montclair St | 0.40mi | 3/1.0 (+1) | 1,026 (+14%) | 6mo | $130,000 | $127 | 47 |
| 720 Oakwood Dr | 0.75mi | 2/1.0 | 768 (-14%) | 6mo | $118,000 | $154 | 36 |
| 817 Dalewood | 0.73mi | 3/1.0 (+1) | 1,025 (+14%) | 6mo | $145,000 | $141 | 32 |
Match score weights: distance 35% · size 25% · config 20% · recency 20%. Top-matched comps best support the ARV.
Projected returns pro-forma
-3.0% appreciation · 0.73% rent growth · sell at horizon
- IRR
- -5.9%
- Equity multiple
- 0.79×
- Total profit
- $-5,719
- Equity at exit
- $14,165
- IRR
- 1.1%
- Equity multiple
- 1.07×
- Total profit
- $1,824
- Equity at exit
- $8,214
Cash invested: $26,600 (down + closing). Projections, not guarantees.
Landlord ↔ Tenant lean methodology
- Overall (STATE)
- 92 Strongly Landlord-Friendly
- State Arkansas
- 92 Strongly Landlord-Friendly · R+14
- County
- — inherits STATE
- City
- — inherits STATE
ZIP-level market 72015
- Home prices YoY
- -11.1%
- Rents YoY
- 0.7%
- Active inventory
- 195
- Price-to-rent
- 8.4×
Monthly cashflow live
- Estimated rent
- $939 high interval (Pro) →
- Mortgage (P&I)
- −$498
- Tax from tax record
- −$19 /mo · $223/yr
- Insurance
- −$40
- HOA
- −$0
- Vacancy / Maint / Mgmt
- −$197
- Net cashflow
- $186
Break-even live
UW: 25.0% down · 7.5% · 30yr · 1.5% tax · 5.0% vac · 8.0% maint · 8.0% mgmt
Financing live
Cash to close
- Down payment
- $23,750
- Closing costs
- $2,850
- Reserves months
- —
- Total cash needed
- —
Loan-product check · same deal, 3 products live
Conventional
25% down · 7.5% · 30yr
- Down + closing
- —
- Monthly P&I
- —
- Monthly cashflow
- —
- DSCR
- —
- Eligible?
- —
Personal DTI + credit; lowest rate.
DSCR
20% down · 8.5% · 30yr
- Down + closing
- —
- Monthly P&I
- —
- Monthly cashflow
- —
- DSCR
- —
- Eligible?
- —
No personal income docs; deal must DSCR.
Hard money
10% down · 12.0% · 12mo
- Down + closing
- —
- Monthly P&I
- —
- Monthly cashflow
- —
- DSCR
- —
- Eligible?
- —
Short-term bridge; refi at stabilization.
Rent comps 11 comps
| Address | Beds | Baths | Sqft | Rent | $/sqft | DOM | Units | Dist |
|---|---|---|---|---|---|---|---|---|
| 305 S Border St Unit G Benton, AR | 2.0 | 1.0 | 750 | $795 | $1.06 | 43d | 1 | 0.04mi |
| 301 S Border St Unit H Benton, AR | 2.0 | 1.0 | 750 | $795 | $1.06 | 23d | 1 | 0.06mi |
| 301 S Border St Unit H Benton, AR | 2.0 | 1.0 | 750 | $795 | $1.06 | 43d | 1 | 0.06mi |
| 303 S Border St Unit G Benton, AR | 2.0 | 1.0 | 750 | $795 | $1.06 | 43d | 1 | 0.06mi |
| 1303 Gray St Benton, AR | 2.0 | 1.5 | 1050 | $1,200 | $1.14 | 14d | 1 | 0.34mi |
| 40 Hiland Pl Unit B Benton, AR | 2.0 | 1.0 | 780 | $923 | $1.18 | 23d | 1 | 0.66mi |
| 724 S Main Benton, AR | 2.0 | 1.0 | 868 | $1,195 | $1.38 | 43d | 1 | 0.73mi |
| 624 Denton Benton, AR | 2.0 | 1.0 | 1092 | $1,200 | $1.10 | 43d | 1 | 0.74mi |
| 715 Oakwood Benton, AR | 1.0 | 1.0 | 650 | $900 | $1.38 | 43d | 1 | 0.79mi |
| 1500 Glory Cv Benton, AR | 3.0 | 2.0 | 1124 | $1,200 | $1.07 | 14d | 1 | 1.29mi |
| 907 Denver Benton, AR | 3.0 | 1.0 | 980 | $1,200 | $1.22 | 23d | 1 | 1.44mi |
Listing history 6 events
-
2026-05-14$95,000 New Listing 289-char remark
-
2022-03-31soldstatus $101,000
-
2022-03-21status Under Contract 204-char remark
Show marketing remark (204 chars)
Remodeled Home within walking distance to schools. Features two bedrooms one bath, Vinyl Plank floors, new cabinets, rolling island in the kitchen and a big covered front porch sitting on a half acre lot.
-
2022-03-21soldstatus $101,000 Sold 204-char remark
Show marketing remark (204 chars)
Remodeled Home within walking distance to schools. Features two bedrooms one bath, Vinyl Plank floors, new cabinets, rolling island in the kitchen and a big covered front porch sitting on a half acre lot.
-
2022-02-24historical Take Backups 204-char remark
Show marketing remark (204 chars)
Remodeled Home within walking distance to schools. Features two bedrooms one bath, Vinyl Plank floors, new cabinets, rolling island in the kitchen and a big covered front porch sitting on a half acre lot.
-
2022-02-14$99,900 New Listing 204-char remark
Show marketing remark (204 chars)
Remodeled Home within walking distance to schools. Features two bedrooms one bath, Vinyl Plank floors, new cabinets, rolling island in the kitchen and a big covered front porch sitting on a half acre lot.
ⓘ Source: listings_history table (triggers on properties + properties_extension) + one-shot
backfill from property_details.listing_events for pre-trigger history.
Tax reassessment forecast AR · Resets to sale price
- Current annual tax
- $223 · $19/mo
- Projected year-2 tax
- $608 · $51/mo
- Expected delta
- +$385/yr (+$32/mo · 172.8%)
ⓘ Screening estimate from a state-policy table — verify with the county assessor before closing.
Climate risk First Street
- Flood 1/10 Low FEMA zone X (unshaded) · 0% chance over 30 yrs
- Wildfire 3/10 Moderate
- Heat 6/10 Major 7 d/yr ≥110°F today · 20 d/yr by 30 yrs out
- Wind 4/10 Moderate 11% chance of damaging wind over 30 yrs
- Air quality 2/10 Low 0 unhealthy d/yr today · 1 by 30 yrs out
Nearby sold comps map
Loading sold comps map…
Walkable amenities ~0.75 mi
Loading nearby amenities…
Taxation est. · year 1
- Rental income
- $11,270
- − Mortgage interest
- −$5,321
- − Property taxes
- −$223
- − Insurance
- −$475
- − Repairs & maintenance
- −$902
- − Management
- −$902
- − Depreciation
- −$2,764
- Taxable income
- $684
- Est. tax owed @ 24.0%
- −$164
- After-tax cash flow
- $2,063/yr
For passive investors: Depreciation is non-cash, so a rental often shows a tax loss while cash-flowing — sheltering income. Rental losses are passive: they offset passive income freely, and up to $25,000/yr can offset ordinary (W-2) income if you actively participate and your MAGI is under $100k (phasing out to $0 by $150k); unused losses carry forward. On sale, claimed depreciation is recaptured at up to 25%, and gains may owe capital-gains tax (a 1031 exchange can defer both). Figures are a year-1 estimate at your 24.0% rate — not tax advice; consult a CPA.
Schools (NCES district)
- District
- Benton School District
- NCES district ID
- 0502960
- Math proficiency
- 51% ▼ -10.00%
- Reading proficiency
- 43% ▼ -10.00%
- Median HH income
- $51,870
- Composite
- 40.52/100
- National rank
- #3707
- State rank
- #25 of 238 in AR
Livability — Benton
- Score
- 66/100
- State rank
- #119
- US rank
- #11460
Category grades
Schools grade is shown separately in the Schools card above.
Census & demographics
- Census place
- Benton, AR
- County
- Saline County · 77,216 people
- City population
- 58,767
- Metro
- Little Rock-North Little Rock-Conway, AR
- Population (ZIP)
- 28,712
- Household income
- $66,107
- Rent vs Own
- Severe rent burden
- 439.0
Population outlook (Saline County) Hauer SSP2
- Today (2025)
- 140,141 people
- By 2030
- 151,233 · +7.9%
- By 2040
- 173,100 · +23.5%
- By 2050
- 194,368 · +38.7%
- By 2075
- 245,295 · +75.0%
- By 2100
- 279,117 · +99.2%
Race, ethnicity, and origin ACS 2023
- Neighborhood character
- Predominantly White (79%)
- Race & ethnicity
- White 79% Black 10% Two or more races 6% Hispanic / Latino 5%
- Common ancestry
- Slovak 3% Italian 2% Lithuanian 1%
- Foreign-born
- 2% · Canada, Vietnam
- Languages at home
- 97% English-only · Spanish 3% Vietnamese 0%
Political lean MEDSL · Saline
- 2024 margin
- Solid R (+40.1) · D 28.8% · R 69.0% · Other 2.2%
- 2008→2024 swing
- +0.8pp no change · 2008: -41.0pp · 2024: -40.1pp
- All cycles
- 2024: R+40.1 2020: R+41.2 2016: R+43.5 2012: R+42.7 2008: R+41.0
Not yet ingested
- Civics
- —
Market trends
- HPI YoY
- ▼ -29.11%
- Current HPI
- 234.4644
- Rent YoY
- ▲ 0.73%
- Metro
- Little Rock-North Little Rock-Conway, AR
- State GDP YoY
- ▲ 3.80%
- F500 in state
- 10
Industry mix (Fortune 500 HQ in AR)
| Industry | F500 HQs | Revenue |
|---|---|---|
| Retail | 1 | $681B |
|
||
| Food / Agriculture | 1 | $53B |
|
||
| Retail / Energy | 1 | $22B |
|
||
| Transportation / Logistics | 1 | $12B |
|
||
| Energy | 1 | $4B |
|
||
Price history
-4.9% since first listed9 events — show timeline
- 2026-06-09 Listing Removed — CARMLS
- 2026-06-08 Sold (MLS) $95,000 CARMLS
- 2026-05-20 Pending — CARMLS
- 2026-05-14 Listed $95,000 CARMLS
- 2022-03-31 Sold (Public Records) $101,000 Public Records
- 2022-03-21 Pending — CARMLS
- 2022-03-21 Sold (MLS) $101,000 CARMLS
- 2022-02-24 Contingent — CARMLS
- 2022-02-14 Listed $99,900 CARMLS
Property tax history
-6.9%/yrLatest (2025): $223 · -31.0% YoY. Source: county tax records.
Cash-flow waterfall
monthlySold comps — $/sqft
last 12 mo · ≤1 miLoading sold comps…