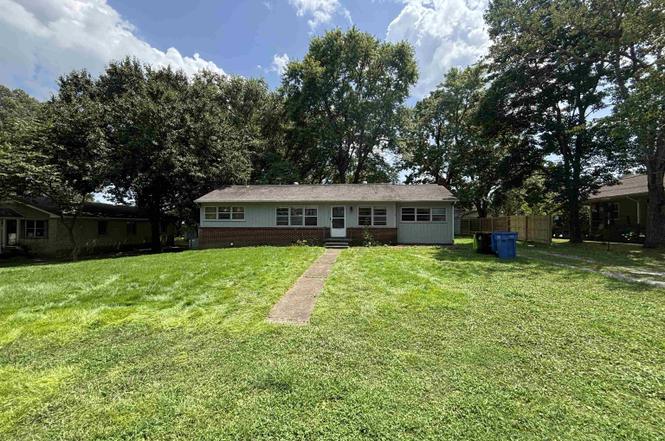
1015 W 4th Street St · Fulton, KY
Flood risk 1/10 · Minimal
- FEMA flood zone
- X (unshaded)
- Chance of flooding over 30 yrs
- 0.0%
- Est. flood insurance / yr
- $507 – $1,088
Fire risk 3/10 · Minor
- Est. fire insurance / yr
- $839 – $1,559
Heat risk 6/10 · Moderate
- Hot days now (above 107°F)
- 7 days/yr
- Hot days in 30 yrs
- 21 days/yr
Wind risk 4/10 · Minor
- Chance of severe wind over 30 yrs
- 8.0%
Air-quality risk 1/10 · Minimal
- Unhealthy air days now
- 0 days/yr
- Unhealthy air days in 30 yrs
- 0 days/yr
Risk factors via First Street. Map © Google.
Why this score? — see what drove the B grade
The composite is a weighted blend of 9 inputs, each scored 0–100. Each bar is that input's sub-score; the figure is the points it added to the 100-point composite (weight × sub-score).
- Cash flow +29.7/30.0
- DSCR +10.0/10.0
- 1% rule +8.4/10.0
- ARV discount +7.5/15.0
- Appreciation +5.1/10.0
- Livability +3.4/5.0
- Schools +2.7/10.0
- Rent growth +2.5/5.0
- Condition / age +2.5/5.0
$89,900
🖨 Deal sheet 📄 Offer letter ✓ Due diligence
Listing remarks
Nice home is located on a quiet street close to many amenities. Three bedrooms, with a possibility of 4 bedrooms. Clean with great rental possibility. The living room is large and inviting, with extra space for office area. Large rear back yard. Storage shed does NOT remain with property. Call today to set up your tour!
Key facts
- Large rear back yard
- Storage shed
- 0.34 acre lot
Tags
Property features AI
Exterior
- Utilities: Public water; Public sewer
- Home design: Single-family residence; Single-story
- Construction: Brick and wood siding exterior; Asphalt roof; Crawl space foundation; Built on a 150 x 100 lot
- Exterior features: Level lot; Paved road access; Shed(s) / storage
Interior
- Flooring: Carpet; Laminate
- Bathrooms: 1 full bathroom
- Heating & cooling: Central heating (Natural Gas); Central air conditioning
- Interior features: Storm windows; Fireplace (1) — note: no specific fireplace features listed
Neighborhood map
What this means for you Summary
Snapshot
- This is a 3-bed/1.0-bath other listed at $90k.
Deal economics
- At list price, monthly cash flow is $328 ($4k/yr) — positive.
- The deal already cash-flows at list — no discount required.
- Meets the 1% rule at list price ($1k rent vs $90k).
- Recommended offer: $79k (12.0% below list) — sets the bar for market timing.
- Cap rate 10.7% vs local median 5.4% in Fulton — top-decile yield for the area; either an underpriced asset or a hidden risk that comps aren't pricing in. Stress-test before assuming the spread holds.
Location & tenants
- Location reads 68/100 on livability (#204 in KY) — a middle-class / working-renter tenant base. Strengths: cost of living A+, health & safety A+; Watch: housing D+, amenities D, schools F.
- Fulton Independent (town): math 25% / reading 35% proficiency, ranked #170 of 173 in KY (top 98%) — families likely to look elsewhere, expect single-tenant / working-renter base with shorter leases; 73% free/reduced lunch — lower-income household profile, screen leases tightly.
- Market conditions: 45 active listings in the ZIP.
Forward outlook
- In year one you build about $781 of equity ($622 loan paydown + $159 appreciation (0.2% local appreciation)).
- Fulton County population projected at -24% by 2050 — secular population decline; favor cash flow + early exit over multi-decade hold.
- At projected returns (0.2% appreciation + 3.0% rent growth), your $25k cash investment doubles in ~5 years — after that, you're playing with house money.
Negotiation context
- It's been on market 330 days — a 12% lower offer ($79k) is reasonable based on typical stale-listing flexibility.
- Current owner paid $20k; list at $90k implies a 344% gain — meaningful room to come down on a strong offer.
Risks & watch-outs
- Climate carrying-cost: extreme-heat days projected 7→21/yr by 2055 (HVAC capex compounding) — expect insurance premiums to compound above CPI over the hold.
Questions for the listing agent
- It's been on market 330 days. Have you received any prior offers? Is the seller open to a 12% concession, seller financing, or rate buy-down credit?
- Built in 1970 — when were the roof, HVAC, electrical panel, plumbing, and water heater last replaced?
- Why hasn't it sold? Are there any deal-killer items the seller is aware of (foundation, flood, title, zoning, code violations)?
- Is there a deadline driving the sale (1031 exchange, divorce, estate, relocation)? That informs how much negotiation room exists.
- Schools are F-rated, which usually means shorter tenancies and higher turnover. Who's the typical renter profile here, and what's been the actual vacancy rate?
- What's the average days-on-market for RENTAL listings here right now (not sales)? A rising rental-DOM trend means longer vacancies and softer asking-rent achievability than the comps imply.
- What's the recent tenant-quality profile in this submarket — average credit score on applications, eviction rate, late-payment / NSF rate, and stable-employment percentage? A property-management company in the area should have these aggregated.
- How much new for-sale + rental construction is in the pipeline within 1–3 miles? Heavy new supply typically softens prices + rents 12–24 months out; constrained supply supports both.
Investment metrics
- 1% rule
- 1.34% ✓
- Cap rate
- 10.67%
- Cash-on-cash
- 15.63%
- DSCR
- 1.70
- GRM
- 6.2
CMA / ARV
No comps found within radius.
Projected returns pro-forma
0.18% appreciation · 3.0% rent growth · sell at horizon
- IRR
- 15.5%
- Equity multiple
- 1.76×
- Total profit
- $19,021
- Equity at exit
- $26,902
- IRR
- 19.9%
- Equity multiple
- 3.23×
- Total profit
- $56,175
- Equity at exit
- $32,982
Cash invested: $25,172 (down + closing). Projections, not guarantees.
Landlord ↔ Tenant lean methodology
- Overall (STATE)
- 83 Strongly Landlord-Friendly
- State Kentucky
- 83 Strongly Landlord-Friendly · R+16
- County
- — inherits STATE
- City
- — inherits STATE
ZIP-level market 42041
- Home prices YoY
- 0.1%
- Active inventory
- 45
- Price-to-rent
- 6.2×
Monthly cashflow live
- Estimated rent
- $1,201 medium interval (Pro) →
- Mortgage (P&I)
- −$471
- Tax est. 1.5%
- −$112 /mo · $1,348/yr
- Insurance
- −$37
- HOA
- −$0
- Vacancy / Maint / Mgmt
- −$252
- Net cashflow
- $328
Break-even live
UW: 25.0% down · 7.5% · 30yr · 1.5% tax · 5.0% vac · 8.0% maint · 8.0% mgmt
Financing live
Cash to close
- Down payment
- $22,475
- Closing costs
- $2,697
- Reserves months
- —
- Total cash needed
- —
Loan-product check · same deal, 3 products live
Conventional
25% down · 7.5% · 30yr
- Down + closing
- —
- Monthly P&I
- —
- Monthly cashflow
- —
- DSCR
- —
- Eligible?
- —
Personal DTI + credit; lowest rate.
DSCR
20% down · 8.5% · 30yr
- Down + closing
- —
- Monthly P&I
- —
- Monthly cashflow
- —
- DSCR
- —
- Eligible?
- —
No personal income docs; deal must DSCR.
Hard money
10% down · 12.0% · 12mo
- Down + closing
- —
- Monthly P&I
- —
- Monthly cashflow
- —
- DSCR
- —
- Eligible?
- —
Short-term bridge; refi at stabilization.
Listing history 19 events
-
2026-06-18days on market $89,900 Active 330 DOM
-
2026-06-17days on market $89,900 Active 329 DOM
-
2026-06-16days on market $89,900 Active 328 DOM
-
2026-06-15days on market $89,900 Active 327 DOM
-
2026-06-13days on market $89,900 Active 325 DOM
-
2026-06-12days on market $89,900 Active 324 DOM
-
2026-06-09days on market $89,900 Active 321 DOM
-
2026-06-08days on market $89,900 Active 320 DOM
-
2026-06-07days on market $89,900 Active 319 DOM
-
2026-06-05days on market $89,900 Active 317 DOM
-
2026-06-04days on market $89,900 Active 315 DOM
-
2026-06-02days on market $89,900 Active 314 DOM
-
2026-06-01days on market $89,900 Active 313 DOM
-
2026-05-31days on market $89,900 Active 312 DOM
-
2026-05-31days on market $89,900 Active 311 DOM
-
2026-04-29price $89,900
-
2026-01-19price $99,750
-
2025-07-23$118,500 Active
-
1993-12-01soldstatus $20,250
ⓘ Source: listings_history table (triggers on properties + properties_extension) + one-shot
backfill from property_details.listing_events for pre-trigger history.
Climate risk First Street
- Flood 1/10 Low FEMA zone X (unshaded) · 0% chance over 30 yrs
- Wildfire 3/10 Moderate
- Heat 6/10 Major 7 d/yr ≥107°F today · 21 d/yr by 30 yrs out
- Wind 4/10 Moderate 8% chance of damaging wind over 30 yrs
- Air quality 1/10 Low 0 unhealthy d/yr today · 0 by 30 yrs out
Nearby sold comps map
Loading sold comps map…
Walkable amenities ~0.75 mi
Loading nearby amenities…
Taxation est. · year 1
- Rental income
- $14,418
- − Mortgage interest
- −$5,036
- − Property taxes
- −$1,348
- − Insurance
- −$450
- − Repairs & maintenance
- −$1,153
- − Management
- −$1,153
- − Depreciation
- −$2,615
- Taxable income
- $2,662
- Est. tax owed @ 24.0%
- −$639
- After-tax cash flow
- $3,296/yr
For passive investors: Depreciation is non-cash, so a rental often shows a tax loss while cash-flowing — sheltering income. Rental losses are passive: they offset passive income freely, and up to $25,000/yr can offset ordinary (W-2) income if you actively participate and your MAGI is under $100k (phasing out to $0 by $150k); unused losses carry forward. On sale, claimed depreciation is recaptured at up to 25%, and gains may owe capital-gains tax (a 1031 exchange can defer both). Figures are a year-1 estimate at your 24.0% rate — not tax advice; consult a CPA.
Schools (NCES district)
- District
- Fulton Independent
- NCES district ID
- 2102070
- Math proficiency
- 25% ▬ 0.00%
- Reading proficiency
- 35% ▬ 0.00%
- Median HH income
- $29,755
- Composite
- 27.09/100
- National rank
- #12479
- State rank
- #170 of 173 in KY
Livability — Fulton
- Score
- 68/100
- State rank
- #204
- US rank
- #10052
Category grades
Schools grade is shown separately in the Schools card above.
Census & demographics
- Census place
- Fulton, KY
- Population (ZIP)
- 4,584
Population outlook (Fulton County) Hauer SSP2
- Today (2025)
- 5,425 people
- By 2030
- 5,042 · -7.1%
- By 2040
- 4,456 · -17.9%
- By 2050
- 4,120 · -24.1%
- By 2075
- 4,003 · -26.2%
- By 2100
- 4,258 · -21.5%
Race, ethnicity, and origin ACS 2023
- Neighborhood character
- Predominantly White (71%)
- Race & ethnicity
- White 71% Black 18% Two or more races 8% Hispanic / Latino 3% Pacific Islander 1%
- Common ancestry
- Portuguese 2% Serbian 2% Scandinavian 2%
- Foreign-born
- 1%
- Languages at home
- 97% English-only · Spanish 2% Other Indo-European 1%
Political lean MEDSL · Fulton
- 2024 margin
- Solid R (+39.9) · D 29.6% · R 69.5%
- 2008→2024 swing
- -29.5pp toward R · 2008: -10.3pp · 2024: -39.9pp
- All cycles
- 2024: R+39.9 2020: R+33.5 2016: R+32.5 2012: R+16.2 2008: R+10.3
Not yet ingested
- Civics
- —
Market trends
- HPI YoY
- ▲ 0.18%
- Current HPI
- 174.9435
- Rent YoY
- —
- Metro
- —
- State GDP YoY
- ▲ 1.81%
- F500 in state
- 4
Industry mix (Fortune 500 HQ in KY)
| Industry | F500 HQs | Revenue |
|---|---|---|
| Healthcare | 1 | $118B |
|
||
| Food / Beverage | 1 | $7B |
|
||
Price history
+344.0% since first listed4 events — show timeline
- 2026-04-29 Price Changed $89,900 RRAR as distributed by MLS GRID
- 2026-01-19 Price Changed $99,750 RRAR as distributed by MLS GRID
- 2025-07-23 Listed $118,500 RRAR as distributed by MLS GRID
- 1993-12-01 Sold (Public Records) $20,250 Public Records
Property tax history
-8.1%/yrLatest (2025): $154 · -70.5% YoY. Source: county tax records.
Cash-flow waterfall
monthlySold comps — $/sqft
last 12 mo · ≤1 miLoading sold comps…