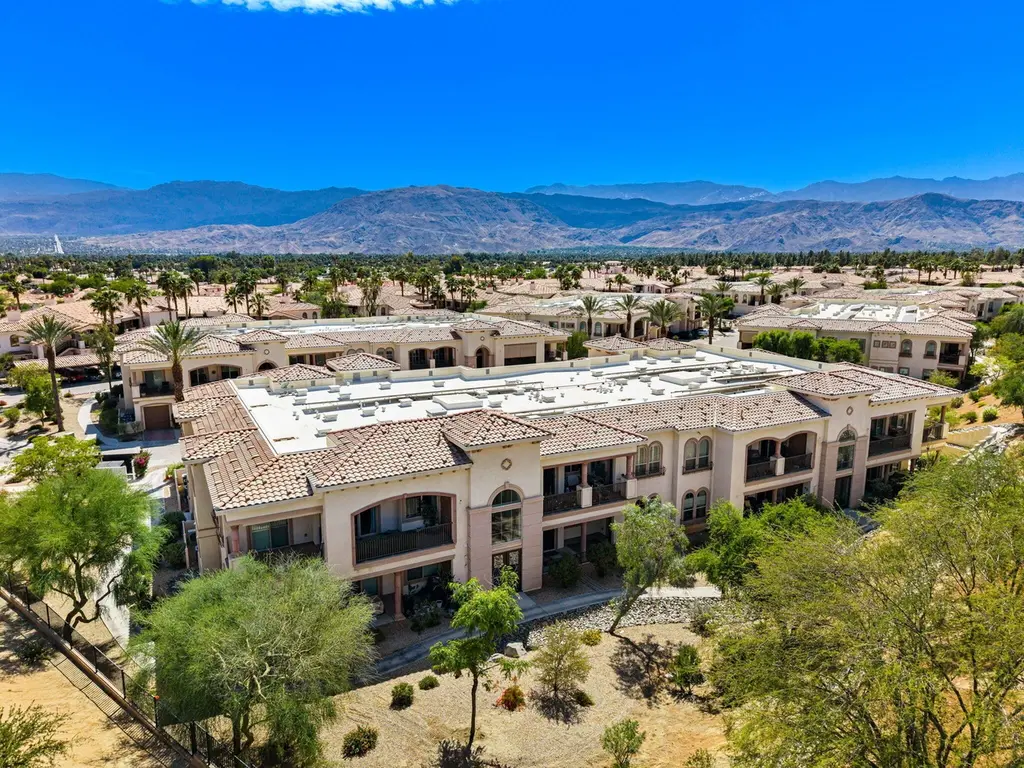
2203 Via Calderia #2203 · Palm Desert, CA
Flood risk 4/10 · Minor
- FEMA flood zone
- X (unshaded)
- Chance of flooding over 30 yrs
- 0.22%
- Est. flood insurance / yr
- $507 – $1,088
Fire risk 1/10 · Minimal
- Est. fire insurance / yr
- $659 – $1,223
Heat risk 9/10 · Severe
- Hot days now (above 114°F)
- 7 days/yr
- Hot days in 30 yrs
- 19 days/yr
Wind risk 1/10 · Minimal
- Chance of severe wind over 30 yrs
- —
Air-quality risk 4/10 · Minor
- Unhealthy air days now
- 5 days/yr
- Unhealthy air days in 30 yrs
- 7 days/yr
Risk factors via First Street. Map © Google.
Why this score? — see what drove the D grade
The composite is a weighted blend of 9 inputs, each scored 0–100. Each bar is that input's sub-score; the figure is the points it added to the 100-point composite (weight × sub-score).
- Cash flow +11.1/30.0
- ARV discount +7.5/15.0
- 1% rule +7.4/10.0
- Condition / age +4.0/5.0
- Schools +3.8/10.0
- DSCR +3.2/10.0
- Rent growth +2.9/5.0
- Livability +2.6/5.0
- Appreciation +0.0/10.0
$299,900
🖨 Deal sheet (PDF) 📄 Offer letter ✓ Due diligence
Listing remarks
Welcome to Via Portofino in Palm Desert, a premier 55+ Community! This ground-level, upgraded 1 bedroom, 2 bathroom home offers a bright, open layout with soaring ceilings, plenty of natural light throughout, and modern finishes. Open floorplan, including a versatile den, ideal for a home office or additional living space, along with a private patio for outdoor relaxation. The custom kitchen includes quartz countertops, a large island, and stainless steel appliances. The primary suite offers a dual vanity, a custom walk-in shower and a spacious walk-in closet, . Enjoy a spacious two-car garage! HOA fees include water, internet, premium cable TV, and earthquake insurance. Low utilities due t
Key facts
- Custom kitchen
- Quartz countertops
- Private patio
Tags
Property features AI
Finance
- Other: Disclosures include CC&R, planned development, and homeowners association documents
- Financial info: Listing terms: cash or cash to new loan; Short term rentals not allowed; Will not consider lease
- HOA & community: Monthly association dues (approx. $991); Association covers building & grounds, trash, maintenance, insurance (including earthquake), cable TV; Community amenities include clubhouse, fitness center, bocce ball court, billiard/card rooms, recreation/meeting rooms, banquet facilities, guest parking, fire pit, elevators, management, maintenance grounds, controlled access; Senior community
Exterior
- Parking: Attached garage with 2 spaces; Direct entrance; Garage door opener
- Security: Controlled access (gated community); Concierge
- Utilities: Water provided by Coachella Valley Water District; Sewer connected and paid; Cable TV available
- Home design: Mediterranean style condominium; One story (ground level); Attached property; Updated / remodeled condition; Tile roof; Stucco exterior
- Construction: Stucco construction; Tile roof; In-ground gunite community pool and spa; Built (year source: assessor)
- Exterior features: Gated community; Covered, enclosed concrete slab patio; Sprinkler system; Community pool and heated in-ground spa
Interior
- Kitchen: Island; Quartz counters; Remodeled kitchen; Gas range; Gas oven; Microwave; Refrigerator; Dishwasher; Disposal
- Bedrooms: Master suite with walk-in closet
- Flooring: Carpet; Tile
- Bathrooms: Remodeled bath(s) with double vanity(s) and tile shower; One 3/4 bath; One 1/4 bath
- Heating & cooling: Central heating (forced air) with natural gas; Central air conditioning; Ceiling fan(s)
- Interior features: High ceilings (9 ft+); Recessed lighting; Open floorplan; Laundry-closet stack; Blinds and shutters
- Laundry & utility: Stacked washer and dryer in closet; Dryer; Washer
Neighborhood map
What this means for you Summary
Snapshot
- This is a 1-bed/1.5-bath condo listed at $300k. Condition is rated good.
Deal economics
- At list price, monthly cash flow is $-122 ($-1k/yr) — negative.
- To cash-flow at today's rent, offer at most $282k (5.9% below list).
- Meets the 1% rule at list price ($4k rent vs $300k).
- Recommended offer: $282k (5.9% below list) — sets the bar for cash-flow.
- Cap rate 5.8% vs local median 3.4% in Palm Desert — top-decile yield for the area; either an underpriced asset or a hidden risk that comps aren't pricing in. Stress-test before assuming the spread holds.
Location & tenants
- Location reads 51/100 on livability (#1,050 in CA) — a working-class tenant base; expect higher turnover. Strengths: employment B+, housing B; Watch: crime D, amenities F, commute F.
- Desert Sands Unified (suburban): math 31% / reading 56% proficiency, ranked #199 of 517 in CA (top 38%) — families likely to look elsewhere, expect single-tenant / working-renter base with shorter leases.
- Zoned schools: James Earl Carter Elementary (516 students, 53% FRL); Colonel Mitchell Paige Middle (math 10% / reading 10%, grade F, #474 of 498 statewide, top 99%, 436 students, 74% FRL); Palm Desert High (math 42% / reading 67%, grade C-, #256 of 1,170 statewide, top 24%, 2,050 students, 57% FRL).
- Market conditions: Rents rising (+1.6%/yr); 551 active listings in the ZIP; 40 comparable units currently listed for rent nearby; rentals lingering (median 45d on market — plan ~5-8 weeks vacancy on turnover, expect pricing pressure); 72% of comp listings sitting > 30 days — soft ceiling on asking rent; 9,195 units permitted in Riverside County in 2024 (1,512 in 5+ unit buildings).
- At $3,724/mo this rent would consume 64% of the median local household income ($70k/yr) (locally 1734% of renters already pay >50% of income on rent) — very limited rent-growth headroom before tenants either downsize or default.
Forward outlook
- Local home prices are declining (-3.0%/yr); year-one equity from $2k of loan paydown is wiped out by about $9k of value loss. Plan a longer hold.
- Riverside County population projected at +22% by 2050 — long-run rental-demand tailwind backs the buy-and-hold thesis.
Negotiation context
- It's been on market 55 days — a 3% lower offer ($291k) is reasonable based on typical stale-listing flexibility.
Risks & watch-outs
- Watch-outs: HOA is 27% of rent.
- Climate carrying-cost: extreme-heat days projected 7→19/yr by 2055 (HVAC capex compounding) — expect insurance premiums to compound above CPI over the hold.
Questions for the listing agent
- What do current leases actually rent for vs. the listed asking? Can we see a recent rent roll and the last 12 months of T-12 income?
- It's been on market 55 days. Have you received any prior offers? Is the seller open to a 6% concession, seller financing, or rate buy-down credit?
- What does the HOA fee cover, when was the last increase, and are there any pending special assessments or reserve-fund shortfalls?
- Any open or pending special assessments — roof, HVAC, plumbing, elevator, façade? What's the per-unit balance and payoff schedule, and is the seller paying it off at close or rolling it to the buyer?
- Is there a deadline driving the sale (1031 exchange, divorce, estate, relocation)? That informs how much negotiation room exists.
- Schools are A-rated — typically a magnet for longer-tenancy family renters. What's the average tenant stay here, and is there a school-zone premium baked into asking?
- Crime grade is D in this area — have there been break-ins, vandalism, or insurance claims at this property in the last 3 years? What carrier currently insures it and at what premium?
- The area grade is low — what's the realistic commute time and amenity access for the typical tenant pool here? Any planned neighborhood developments (good or bad) we should know about?
- What's the average days-on-market for RENTAL listings here right now (not sales)? A rising rental-DOM trend means longer vacancies and softer asking-rent achievability than the comps imply.
- What's the recent tenant-quality profile in this submarket — average credit score on applications, eviction rate, late-payment / NSF rate, and stable-employment percentage? A property-management company in the area should have these aggregated.
- How much new apartment / multifamily construction is in the pipeline within 1–3 miles? Heavy new supply (>2% of stock underway) typically softens rents 12–24 months out; light construction supports rent growth.
Investment metrics
- 1% rule
- 1.24% ✓
- Cap rate
- 5.81%
- Cash-on-cash
- -1.74%
- DSCR
- 0.92
- GRM
- 6.7
CMA / ARV
No comps found within radius.
Projected returns pro-forma
-3.0% appreciation · 1.6% rent growth · sell at horizon
- IRR
- -21.3%
- Equity multiple
- 0.28×
- Total profit
- $-60,854
- Equity at exit
- $44,716
- IRR
- -19.9%
- Equity multiple
- 0.04×
- Total profit
- $-80,906
- Equity at exit
- $25,930
Cash invested: $83,972 (down + closing). Projections, not guarantees.
Landlord ↔ Tenant lean methodology
- Overall (STATE)
- 18 Strongly Tenant-Friendly
- State California
- 18 Strongly Tenant-Friendly · D+13
- County
- — inherits STATE
- City
- — inherits STATE
ZIP-level market 92260
- Rents YoY
- 1.6%
- Active inventory
- 551
- Price-to-rent
- 6.7×
Monthly cashflow live
- Estimated rent
- $3,724 high interval (Pro) →
- Mortgage (P&I)
- −$1,573
- Tax est. 1.5%
- −$375 /mo · $4,498/yr
- Insurance
- −$125
- HOA
- −$991
- Vacancy / Maint / Mgmt
- −$782
- Net cashflow
- $-122
Break-even live
Sensitivity live
| Price | -10% $86 | -5% $-18 | +0% $-122 | +5% $-225 | +10% $-329 |
|---|---|---|---|---|---|
| Rent | -10% $-416 | -5% $-269 | +0% $-122 | +5% $25 | +10% $173 |
| Rate | -1.0pp $29 | -0.5pp $-45 | base $-122 | +0.5pp $-199 | +1.0pp $-278 |
UW: 25.0% down · 7.5% · 30yr · 1.5% tax · 5.0% vac · 8.0% maint · 8.0% mgmt
Financing live
Cash to close
- Down payment
- $74,975
- Closing costs
- $8,997
- Reserves months
- —
- Total cash needed
- —
Loan-product check · same deal, 3 products live
Conventional
25% down · 7.5% · 30yr
- Down + closing
- —
- Monthly P&I
- —
- Monthly cashflow
- —
- DSCR
- —
- Eligible?
- —
Personal DTI + credit; lowest rate.
DSCR
20% down · 8.5% · 30yr
- Down + closing
- —
- Monthly P&I
- —
- Monthly cashflow
- —
- DSCR
- —
- Eligible?
- —
No personal income docs; deal must DSCR.
Hard money
10% down · 12.0% · 12mo
- Down + closing
- —
- Monthly P&I
- —
- Monthly cashflow
- —
- DSCR
- —
- Eligible?
- —
Short-term bridge; refi at stabilization.
Rent comps 40 comps
| Address | Beds | Baths | Sqft | Rent | $/sqft | DOM | Units | Dist |
|---|---|---|---|---|---|---|---|---|
| 40445 Portola Ave Palm Desert, CA | 1.0–2.0 | 1.0–2.0 | 975 | $2,100 | $2.15 | 0d | 16 | 0.15mi |
| 1 Marbella Ln Palm Desert, CA | 2.0 | 2.0 | 1080 | $4,500 | $4.17 | 45d | 1 | 0.32mi |
| 191 Winterhaven Cir Palm Desert, CA | 2.0 | 1.5 | 1250 | $2,800 | $2.24 | 45d | 1 | 0.34mi |
| 166 Wimbledon Ct Palm Desert, CA | 2.0 | 2.0 | 1250 | $3,200 | $2.56 | 45d | 1 | 0.37mi |
| 74300 Country Club Dr Apt 5001 Palm Desert, CA | 2.0 | 2.0 | 1099 | $7,120 | $6.48 | 45d | 1 | 0.45mi |
| 74300 Country Club Dr Unit 366 Palm Desert, CA | 2.0 | 2.0 | 1140 | $7,170 | $6.29 | 45d | 1 | 0.45mi |
| 73373 Country Club Dr Palm Desert, CA | 1.0–2.0 | 1.0–2.0 | 852 | $1,830 | $2.15 | 45d | 1 | 0.46mi |
| 150 Willow Lake Dr Palm Desert, CA | 2.0 | 2.0 | 1138 | $2,500 | $2.20 | 45d | 1 | 0.47mi |
| 206 Lakecrest Ln Palm Desert, CA | 2.0 | 2.0 | 1138 | $2,300 | $2.02 | 13d | 1 | 0.51mi |
| 365 San Remo St Palm Desert, CA | 2.0 | 2.0 | 1303 | $5,500 | $4.22 | 45d | 1 | 0.56mi |
| 336 Villena Way Palm Desert, CA | 2.0 | 2.0 | 1303 | $5,500 | $4.22 | 45d | 1 | 0.58mi |
| 337 Villena Way Palm Desert, CA | 2.0 | 2.0 | 1303 | $5,000 | $3.84 | 45d | 1 | 0.62mi |
| 430 S Sierra Madre Palm Desert, CA | 2.0 | 2.0 | 1303 | $5,500 | $4.22 | 45d | 1 | 0.67mi |
| 248 Strada Fortuna Palm Desert, CA | 2.0 | 2.0 | 1400 | $2,500 | $1.79 | 45d | 1 | 0.76mi |
| 205 Las Lomas Palm Desert, CA | 2.0 | 2.0 | 1457 | $6,000 | $4.12 | 45d | 1 | 0.79mi |
| 314 Gran Via Ct Palm Desert, CA | 2.0 | 1.5 | 1303 | $4,700 | $3.61 | 45d | 1 | 0.83mi |
| 38520 Poppet Canyon Dr Palm Desert, CA | 2.0 | 2.0 | 1392 | $3,700 | $2.66 | 45d | 1 | 0.92mi |
| 347 Gran Via Palm Desert, CA | 2.0 | 2.0 | 1303 | $5,500 | $4.22 | 45d | 1 | 0.94mi |
| 74401 Hovley Lane East Palm Desert, CA | 1.0–3.0 | 1.0–2.0 | 1042 | $2,066 | $1.98 | 0d | 22 | 1.00mi |
| 320 Paseo Primavera Palm Desert, CA | 2.0 | 2.0 | 1303 | $3,000 | $2.30 | 45d | 1 | 1.02mi |
| 240 Santa Barbara Cir Palm Desert, CA | 2.0 | 2.0 | 1457 | $6,000 | $4.12 | 25d | 1 | 1.04mi |
| 73075 Buck Springs Dr Palm Desert, CA | 2.0 | 2.0 | 1440 | $1,950 | $1.35 | 45d | 1 | 1.05mi |
| 203 Serena Dr Palm Desert, CA | 2.0 | 2.0 | 1303 | $3,000 | $2.30 | 4d | 1 | 1.08mi |
| 221 Serena Dr Palm Desert, CA | 2.0 | 2.0 | 1347 | $5,500 | $4.08 | 45d | 1 | 1.10mi |
| 242 Serena Dr Palm Desert, CA | 2.0 | 2.0 | 1347 | $5,300 | $3.93 | 45d | 1 | 1.11mi |
| 280 Tolosa Cir Palm Desert, CA | 2.0 | 2.0 | 1347 | $6,000 | $4.45 | 25d | 1 | 1.12mi |
| 280 Tolosa Cir Palm Desert, CA | 2.0 | 2.0 | 1347 | $6,000 | $4.45 | 45d | 1 | 1.12mi |
| 281 Tolosa Cir Palm Desert, CA | 2.0 | 2.0 | 1303 | $5,500 | $4.22 | 45d | 1 | 1.15mi |
| 21 Don Quixote Dr Rancho Mirage, CA | 2.0 | 2.0 | 1270 | $4,000 | $3.15 | 25d | 1 | 1.21mi |
| 74036 Mercury Cir W Palm Desert, CA | 2.0 | 2.0 | 1440 | $2,800 | $1.94 | 45d | 1 | 1.27mi |
| 291 Serena Dr Palm Desert, CA | 2.0 | 1.5 | 1303 | $5,300 | $4.07 | 45d | 1 | 1.28mi |
| 68 El Toro Dr Rancho Mirage, CA | 2.0 | 2.0 | 1381 | $4,000 | $2.90 | 25d | 1 | 1.29mi |
| 289 Castellana N Palm Desert, CA | 2.0 | 2.0 | 1457 | $3,000 | $2.06 | 25d | 1 | 1.29mi |
| 781 Montana Vista Dr Palm Desert, CA | 2.0 | 2.0 | 1330 | $6,000 | $4.51 | 45d | 1 | 1.31mi |
| 101 Avellino Cir Palm Desert, CA | 2.0 | 2.0 | 1500 | $3,000 | $2.00 | 23d | 1 | 1.34mi |
| 235 Via Rengo Palm Desert, CA | 2.0 | 2.0 | 1042 | $2,600 | $2.50 | 45d | 1 | 1.39mi |
| 257 Calle del Verano Palm Desert, CA | 2.0 | 2.0 | 1303 | $5,300 | $4.07 | 45d | 1 | 1.39mi |
| 259 Calle del Verano Palm Desert, CA | 2.0 | 2.0 | 1303 | $5,200 | $3.99 | 45d | 1 | 1.39mi |
| 116 Avellino Cir Palm Desert, CA | 2.0 | 2.0 | 1426 | $6,200 | $4.35 | 45d | 1 | 1.39mi |
| 36 El Toro Dr Rancho Mirage, CA | 2.0 | 2.0 | 1270 | $4,000 | $3.15 | 25d | 1 | 1.40mi |
HOA detail condo
- Monthly dues
- $991 · $11,892/yr
- Likely covers
- waterinternetcable
- Assessments
- None detected in remarks — confirm with the listing agent.
Listing history 17 events
-
2026-06-21days on market $299,900 Active 55 DOM
-
2026-06-18days on market $299,900 Active 52 DOM
-
2026-06-17days on market $299,900 Active 51 DOM
-
2026-06-16days on market $299,900 Active 50 DOM
-
2026-06-15days on market $299,900 Active 49 DOM
-
2026-06-13days on market $299,900 Active 47 DOM
-
2026-06-09days on market $299,900 Active 43 DOM
-
2026-06-08days on market $299,900 Active 42 DOM
-
2026-06-07days on market $299,900 Active 41 DOM
-
2026-06-04days on market $299,900 Active 38 DOM
-
2026-06-03days on market $299,900 Active 37 DOM
-
2026-06-02days on market $299,900 Active 36 DOM
-
2026-06-01days on market $299,900 Active 35 DOM
-
2026-05-31days on market $299,900 Active 34 DOM
-
2026-05-09price $299,900 1210-char remark
-
2026-05-08price $314,990 1210-char remark
-
2026-03-31$319,500 Active 1210-char remark
ⓘ Source: listings_history table (triggers on properties + properties_extension) + one-shot
backfill from property_details.listing_events for pre-trigger history.
Climate risk First Street
- Flood 4/10 Moderate FEMA zone X (unshaded) · 22% chance over 30 yrs
- Wildfire 1/10 Low
- Heat 9/10 Extreme 7 d/yr ≥114°F today · 19 d/yr by 30 yrs out
- Wind 1/10 Low
- Air quality 4/10 Moderate 5 unhealthy d/yr today · 7 by 30 yrs out
Nearby sold comps map
Loading sold comps map…
Walkable amenities ~0.75 mi
Loading nearby amenities…
Taxation est. · year 1
- Rental income
- $44,687
- − Mortgage interest
- −$16,799
- − Property taxes
- −$4,498
- − Insurance
- −$1,500
- − Repairs & maintenance
- −$3,575
- − Management
- −$3,575
- − HOA
- −$11,892
- − Depreciation
- −$8,724
- Taxable loss
- −$5,877
- Est. tax savings @ 24.0%
- +$1,410
- After-tax cash flow
- $-50/yr
For passive investors: Depreciation is non-cash, so a rental often shows a tax loss while cash-flowing — sheltering income. Rental losses are passive: they offset passive income freely, and up to $25,000/yr can offset ordinary (W-2) income if you actively participate and your MAGI is under $100k (phasing out to $0 by $150k); unused losses carry forward. On sale, claimed depreciation is recaptured at up to 25%, and gains may owe capital-gains tax (a 1031 exchange can defer both). Figures are a year-1 estimate at your 24.0% rate — not tax advice; consult a CPA.
Condition & rehab AI · 6 photos
This well-maintained and updated condo in Via Portofino offers a good condition with a good ROI potential for both resale and rental.
Value-add opportunities
- Both Painting the interior walls — Fresh paint can enhance the overall appearance and value of the home.
- Both Landscaping improvements — Enhanced landscaping can improve curb appeal and attract more potential buyers/tenants.
- Rental Upgrading the ceiling fans — Modern ceiling fans can improve air circulation and comfort in the living areas.
Renovation cost estimate screening
Value-add ROI direction
- Both Painting the interior walls — Fresh paint can enhance the overall appearance and value of the home. ↑
- Both Landscaping improvements — Enhanced landscaping can improve curb appeal and attract more potential buyers/tenants. ↑
- Rental Upgrading the ceiling fans — Modern ceiling fans can improve air circulation and comfort in the living areas. ↑
ⓘ Cost ranges are severity-bucket heuristics (US national rule-of-thumb). Get contractor quotes + a written scope before underwriting a rehab budget.
Schools (NCES district)
- District
- Desert Sands Unified
- NCES district ID
- 0611110
- Math proficiency
- 31% ▼ -4.00%
- Reading proficiency
- 56% ▲ 7.00%
- Median HH income
- $54,957
- Composite
- 37.77/100
- National rank
- #4346
- State rank
- #199 of 517 in CA
Livability — Palm Desert
- Score
- 51/100
- State rank
- #1050
- US rank
- #25164
Category grades
Schools grade is shown separately in the Schools card above.
Census & demographics
- Census place
- Palm Desert, CA
- County
- Riverside County · 2,287,001 people
- City population
- 58,615
- Metro
- Riverside-San Bernardino-Ontario, CA
- Population (ZIP)
- 30,523
- Household income
- $70,091
- Rent vs Own
- Severe rent burden
- 1734.0
Population outlook (Riverside County) Hauer SSP2
- Today (2025)
- 2,664,475 people
- By 2030
- 2,802,692 · +5.2%
- By 2040
- 3,050,904 · +14.5%
- By 2050
- 3,256,783 · +22.2%
- By 2075
- 3,655,058 · +37.2%
- By 2100
- 3,766,594 · +41.4%
Race, ethnicity, and origin ACS 2023
- Neighborhood character
- Majority White (61%)
- Race & ethnicity
- White 61% Hispanic / Latino 31% Two or more races 20% Asian 4% Black 2%
- Hispanic origin (detail)
- Mexican 25%
- Common ancestry
- Italian 4% Lithuanian 3% Slovak 2%
- Foreign-born
- 18% · Canada, South Korea, Vietnam
- Languages at home
- 73% English-only · Spanish 22% French/Haitian/Cajun 1% Other Indo-European 1%
Political lean MEDSL · Riverside
- 2024 margin
- Toss-up / Even · D 48.0% · R 49.3% · Other 2.6%
- 2008→2024 swing
- -3.6pp toward R · 2008: 2.3pp · 2024: -1.3pp
- All cycles
- 2024: R+1.3 2020: D+8.0 2016: D+4.3 2012: R+0.4 2008: D+2.3
Not yet ingested
- Civics
- —
Market trends
- HPI YoY
- ▼ -364.94%
- Current HPI
- 294.9425
- Rent YoY
- ▲ 1.60%
- Metro
- Riverside-San Bernardino-Ontario, CA
- State GDP YoY
- ▲ 3.21%
- F500 in state
- 116
Industry mix (Fortune 500 HQ in CA)
| Industry | F500 HQs | Revenue |
|---|---|---|
| Technology | 27 | $1,492B |
|
||
| Financial Services | 3 | $174B |
|
||
| Retail | 3 | $44B |
|
||
| Insurance | 3 | $26B |
|
||
| Media / Entertainment | 2 | $115B |
|
||
| Pharmaceuticals / Biotech | 2 | $62B |
|
||
Price history
-6.1% since first listed3 events — show timeline
- 2026-05-09 Price Changed $299,900 GPSMLS
- 2026-05-08 Price Changed $314,990 GPSMLS
- 2026-03-31 Listed $319,500 GPSMLS
Cash-flow waterfall
monthlySold comps — $/sqft
last 12 mo · ≤1 miLoading sold comps…