2730 Ozark Ave · Cabool, MO
Flood risk 1/10 · Minimal
- FEMA flood zone
- —
- Chance of flooding over 30 yrs
- 0.0%
- Est. flood insurance / yr
- —
Fire risk 3/10 · Minor
- Est. fire insurance / yr
- $1,054 – $1,958
Heat risk 5/10 · Moderate
- Hot days now (above 105°F)
- 7 days/yr
- Hot days in 30 yrs
- 20 days/yr
Wind risk 2/10 · Minimal
- Chance of severe wind over 30 yrs
- 1.0%
Air-quality risk 1/10 · Minimal
- Unhealthy air days now
- 0 days/yr
- Unhealthy air days in 30 yrs
- 0 days/yr
Risk factors via First Street. Map © Google.
Why this score? — see what drove the F grade
The composite is a weighted blend of 9 inputs, each scored 0–100. Each bar is that input's sub-score; the figure is the points it added to the 100-point composite (weight × sub-score).
- Appreciation +9.7/10.0
- ARV discount +7.5/15.0
- Cash flow +4.4/30.0
- Livability +3.4/5.0
- Rent growth +2.5/5.0
- Schools +2.5/10.0
- Condition / age +2.5/5.0
- 1% rule +0.0/10.0
- DSCR +0.0/10.0
$259,900
🖨 Deal sheet (PDF) 📄 Offer letter ✓ Due diligence
Listing remarks MLS
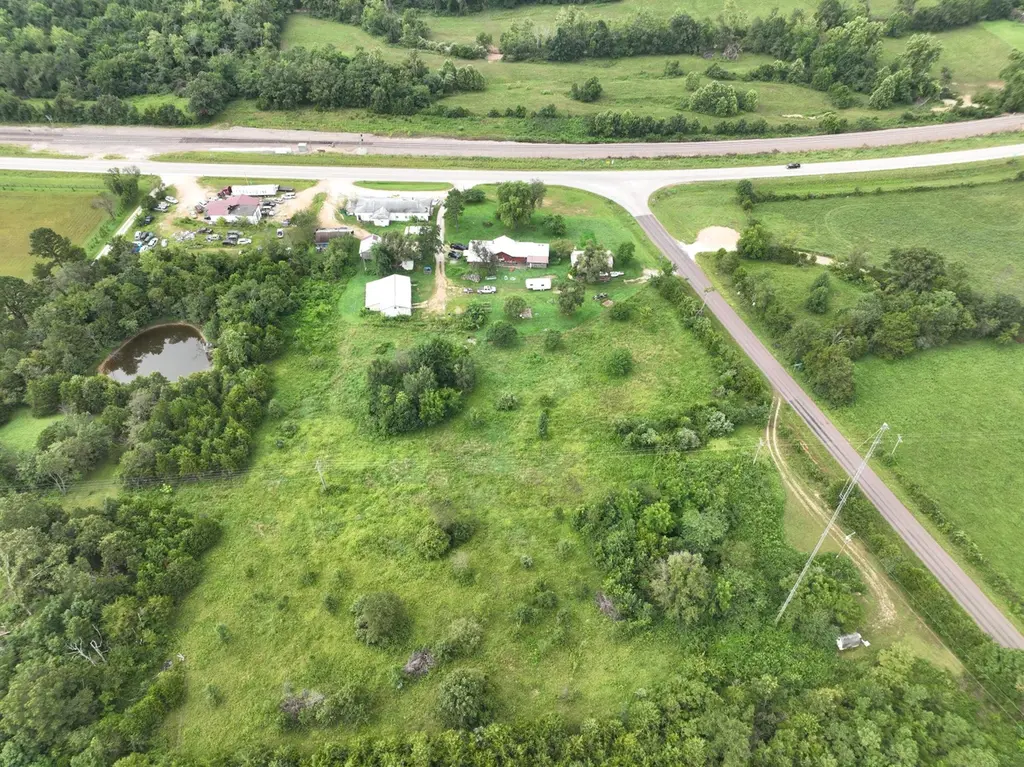
Group of rentals with nice cash flow located on the corner of Business Hwy 60 and State Hwy M within the City Limits of Cabool, Mo. Includes 7.18 acres with all Utilities available for future development. Property was once a thriving Restaurant (since converted into multifamily) surrounded by small road houses that are fully occupied. At some point there was a nice single family home built there with cedar siding and several shop buildings that have also been converted to rentals. 5+ acres are separately deeded and would be ideal for Multifamily Development. This can also be purchased with an additional group of single family homes also located in Cabool. Mls # . Please do NOT disturb Tennants.
Key facts
- Utilities available
- 7.18 acres
- Cedar siding
Tags
Neighborhood map
What this means for you Summary
Snapshot
- This is a 3-bed/8.0-bath other listed at $260k.
Deal economics
- At list price, monthly cash flow is $-684 ($-8k/yr) — negative.
- To cash-flow at today's rent, offer at most $139k (46.5% below list).
- To meet the 1% rule (rent ≥ 1% of price), the offer needs to be $119k (54.1% below list).
- Recommended offer: $119k (54.1% below list) — sets the bar for 1% rule.
Location & tenants
- Location reads 67/100 on livability (#218 in MO) — a middle-class / working-renter tenant base. Strengths: cost of living A+, crime A, housing A-; Watch: amenities F, commute F, employment F.
- Cabool R-IV (rural): math 22% / reading 39% proficiency, ranked #275 of 324 in MO (top 85%) — families likely to look elsewhere, expect single-tenant / working-renter base with shorter leases.
- Zoned schools: Cabool Elem. (math 27% / reading 37%, grade F, #761 of 1,115 statewide, top 72%, 340 students, 98% FRL); Cabool Middle (math 21% / reading 40%, grade F, #283 of 391 statewide, top 74%, 222 students, 100% FRL); Cabool High (math 15% / reading 34%, grade F, #436 of 521 statewide, top 85%, 207 students, 100% FRL) — zoned schools average 99% FRL vs 57% district-wide (42 pts higher); higher-poverty schools than district average — tighter screening recommended.
- Market conditions: 63 active listings in the ZIP; 10 units permitted in Texas County in 2024 (5 in 5+ unit buildings).
Forward outlook
- In year one you build about $26k of equity ($2k loan paydown + $25k appreciation (9.5% local appreciation)).
- Texas County population projected at -11% by 2050 — secular population decline; favor cash flow + early exit over multi-decade hold.
- By year 2, paydown + projected appreciation supports a ~$42k cash-out refi (75% LTV) — recoverable capital for the next deal without selling this one.
Negotiation context
- It's been on market 227 days — a 12% lower offer ($229k) is reasonable based on typical stale-listing flexibility.
Risks & watch-outs
- Climate carrying-cost: extreme-heat days projected 7→20/yr by 2055 (HVAC capex compounding) — expect insurance premiums to compound above CPI over the hold.
Questions for the listing agent
- What do current leases actually rent for vs. the listed asking? Can we see a recent rent roll and the last 12 months of T-12 income?
- It's been on market 227 days. Have you received any prior offers? Is the seller open to a 54% concession, seller financing, or rate buy-down credit?
- Built in 1962 — when were the roof, HVAC, electrical panel, plumbing, and water heater last replaced?
- Why hasn't it sold? Are there any deal-killer items the seller is aware of (foundation, flood, title, zoning, code violations)?
- Is there a deadline driving the sale (1031 exchange, divorce, estate, relocation)? That informs how much negotiation room exists.
- Schools are D-rated, which usually means shorter tenancies and higher turnover. Who's the typical renter profile here, and what's been the actual vacancy rate?
- The area grade is low — what's the realistic commute time and amenity access for the typical tenant pool here? Any planned neighborhood developments (good or bad) we should know about?
- What's the average days-on-market for RENTAL listings here right now (not sales)? A rising rental-DOM trend means longer vacancies and softer asking-rent achievability than the comps imply.
- What's the recent tenant-quality profile in this submarket — average credit score on applications, eviction rate, late-payment / NSF rate, and stable-employment percentage? A property-management company in the area should have these aggregated.
- How much new for-sale + rental construction is in the pipeline within 1–3 miles? Heavy new supply typically softens prices + rents 12–24 months out; constrained supply supports both.
Investment metrics
- 1% rule
- 0.46% ✗
- Cap rate
- 3.14%
- Cash-on-cash
- -11.27%
- DSCR
- 0.50
- GRM
- 18.1
CMA / ARV
No comps found within radius.
Projected returns pro-forma
9.46% appreciation · 3.0% rent growth · sell at horizon
- IRR
- 15.1%
- Equity multiple
- 2.21×
- Total profit
- $88,364
- Equity at exit
- $223,969
- IRR
- 14.8%
- Equity multiple
- 5.01×
- Total profit
- $292,019
- Equity at exit
- $472,569
Cash invested: $72,772 (down + closing). Projections, not guarantees.
Landlord ↔ Tenant lean methodology
- Overall (STATE)
- 81 Strongly Landlord-Friendly
- State Missouri
- 81 Strongly Landlord-Friendly · R+10
- County
- — inherits STATE
- City
- — inherits STATE
ZIP-level market 65689
- Home prices YoY
- 4.2%
- Active inventory
- 63
- Price-to-rent
- 18.1×
Monthly cashflow live
- Estimated rent
- $1,194 medium interval (Pro) →
- Mortgage (P&I)
- −$1,363
- Tax from tax record
- −$156 /mo · $1,869/yr
- Insurance
- −$108
- HOA
- −$0
- Vacancy / Maint / Mgmt
- −$251
- Net cashflow
- $-684
Break-even live
Sensitivity live
| Price | -10% $-536 | -5% $-610 | +0% $-684 | +5% $-757 | +10% $-831 |
|---|---|---|---|---|---|
| Rent | -10% $-778 | -5% $-731 | +0% $-684 | +5% $-636 | +10% $-589 |
| Rate | -1.0pp $-553 | -0.5pp $-617 | base $-684 | +0.5pp $-751 | +1.0pp $-819 |
UW: 25.0% down · 7.5% · 30yr · 1.5% tax · 5.0% vac · 8.0% maint · 8.0% mgmt
Financing live
Cash to close
- Down payment
- $64,975
- Closing costs
- $7,797
- Reserves months
- —
- Total cash needed
- —
Loan-product check · same deal, 3 products live
Conventional
25% down · 7.5% · 30yr
- Down + closing
- —
- Monthly P&I
- —
- Monthly cashflow
- —
- DSCR
- —
- Eligible?
- —
Personal DTI + credit; lowest rate.
DSCR
20% down · 8.5% · 30yr
- Down + closing
- —
- Monthly P&I
- —
- Monthly cashflow
- —
- DSCR
- —
- Eligible?
- —
No personal income docs; deal must DSCR.
Hard money
10% down · 12.0% · 12mo
- Down + closing
- —
- Monthly P&I
- —
- Monthly cashflow
- —
- DSCR
- —
- Eligible?
- —
Short-term bridge; refi at stabilization.
Listing history 3 events
-
2026-06-01days on market $259,900 Active 227 DOM
-
2026-05-31days on market $259,900 Active 226 DOM
-
2025-10-17$259,900 Active 703-char remark
Show marketing remark (703 chars)
Group of rentals with nice cash flow located on the corner of Business Hwy 60 and State Hwy M within the City Limits of Cabool, Mo. Includes 7.18 acres with all Utilities available for future development. Property was once a thriving Restaurant (since converted into multifamily) surrounded by small road houses that are fully occupied. At some point there was a nice single family home built there with cedar siding and several shop buildings that have also been converted to rentals. 5+ acres are separately deeded and would be ideal for Multifamily Development. This can also be purchased with an additional group of single family homes also located in Cabool. Mls # . Please do NOT disturb Tennants.
ⓘ Source: listings_history table (triggers on properties + properties_extension) + one-shot
backfill from property_details.listing_events for pre-trigger history.
Tax reassessment forecast MO · Resets to sale price
- Current annual tax
- $1,869 · $156/mo
- Projected year-2 tax
- $2,521 · $210/mo
- Expected delta
- +$652/yr (+$54/mo · 34.9%)
ⓘ Screening estimate from a state-policy table — verify with the county assessor before closing.
Climate risk First Street
- Flood 1/10 Low 0% chance over 30 yrs
- Wildfire 3/10 Moderate
- Heat 5/10 Major 7 d/yr ≥105°F today · 20 d/yr by 30 yrs out
- Wind 2/10 Low 100% chance of damaging wind over 30 yrs
- Air quality 1/10 Low 0 unhealthy d/yr today · 0 by 30 yrs out
Nearby sold comps map
Loading sold comps map…
Walkable amenities ~0.75 mi
Loading nearby amenities…
Taxation est. · year 1
- Rental income
- $14,330
- − Mortgage interest
- −$14,558
- − Property taxes
- −$1,869
- − Insurance
- −$1,300
- − Repairs & maintenance
- −$1,146
- − Management
- −$1,146
- − Depreciation
- −$7,561
- Taxable loss
- −$13,251
- Est. tax savings @ 24.0%
- +$3,180
- After-tax cash flow
- $-5,023/yr
For passive investors: Depreciation is non-cash, so a rental often shows a tax loss while cash-flowing — sheltering income. Rental losses are passive: they offset passive income freely, and up to $25,000/yr can offset ordinary (W-2) income if you actively participate and your MAGI is under $100k (phasing out to $0 by $150k); unused losses carry forward. On sale, claimed depreciation is recaptured at up to 25%, and gains may owe capital-gains tax (a 1031 exchange can defer both). Figures are a year-1 estimate at your 24.0% rate — not tax advice; consult a CPA.
Schools (NCES district)
- District
- Cabool R-IV
- NCES district ID
- 2906430
- Math proficiency
- 22% ▼ -7.00%
- Reading proficiency
- 39% ▲ 1.00%
- Median HH income
- $32,537
- Composite
- 24.88/100
- National rank
- #7584
- State rank
- #275 of 324 in MO
Livability — Cabool
- Score
- 67/100
- State rank
- #218
- US rank
- #10822
Category grades
Schools grade is shown separately in the Schools card above.
Census & demographics
- Census place
- Cabool, MO
- City population
- 4,273
- Population (ZIP)
- 4,273
Population outlook (Texas County) Hauer SSP2
- Today (2025)
- 24,648 people
- By 2030
- 23,981 · -2.7%
- By 2040
- 22,840 · -7.3%
- By 2050
- 21,832 · -11.4%
- By 2075
- 19,481 · -21.0%
- By 2100
- 16,634 · -32.5%
Race, ethnicity, and origin ACS 2023
- Neighborhood character
- Predominantly White (86%)
- Race & ethnicity
- White 86% Two or more races 7% Hispanic / Latino 4% Asian 2%
- Common ancestry
- Romanian 4% Iranian 2% Lithuanian 1%
- Foreign-born
- 2% · Canada
- Languages at home
- 97% English-only · Spanish 3%
Political lean MEDSL · Texas
- 2024 margin
- Solid R (+71.7) · D 13.8% · R 85.5%
- 2008→2024 swing
- -36.7pp toward R · 2008: -35.1pp · 2024: -71.7pp
- All cycles
- 2024: R+71.7 2020: R+68.6 2016: R+65.4 2012: R+44.1 2008: R+35.1
Not yet ingested
- Civics
- —
Market trends
- HPI YoY
- ▲ 9.46%
- Current HPI
- 232.9575
- Rent YoY
- —
- Metro
- —
- State GDP YoY
- ▲ 1.84%
- F500 in state
- 20
Industry mix (Fortune 500 HQ in MO)
| Industry | F500 HQs | Revenue |
|---|---|---|
| Healthcare | 1 | $163B |
|
||
| Insurance | 1 | $21B |
|
||
| Industrial Technology | 1 | $17B |
|
||
| Retail | 1 | $16B |
|
||
| Industrial Distribution | 1 | $10B |
|
||
| Utilities | 1 | $9B |
|
||
Price history
1 event — show timeline
- 2025-10-17 Listed $259,900 SOMO
Property tax history
+6.1%/yrLatest (2025): $1,869 · +1.5% YoY. Source: county tax records.
Cash-flow waterfall
monthlySold comps — $/sqft
last 12 mo · ≤1 miLoading sold comps…