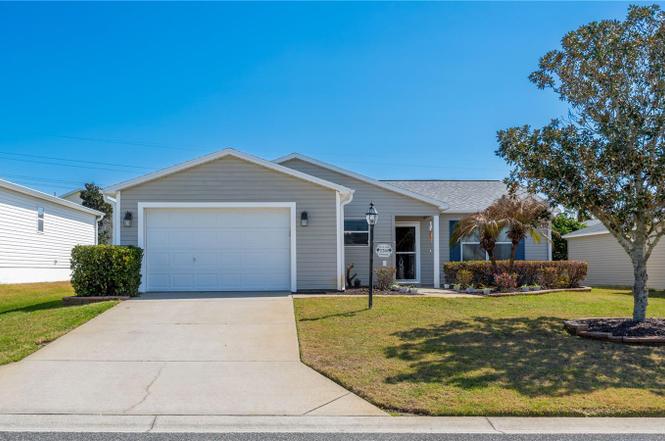
2201 Balsa Ct · The Villages, FL
Flood risk 1/10 · Minimal
- FEMA flood zone
- X (unshaded)
- Chance of flooding over 30 yrs
- 0.0%
- Est. flood insurance / yr
- $507 – $1,088
Fire risk 4/10 · Minor
- Est. fire insurance / yr
- $947 – $1,759
Heat risk 9/10 · Severe
- Hot days now (above 108°F)
- 7 days/yr
- Hot days in 30 yrs
- 23 days/yr
Wind risk 9/10 · Severe
- Chance of severe wind over 30 yrs
- 99.0%
Air-quality risk 3/10 · Minor
- Unhealthy air days now
- 2 days/yr
- Unhealthy air days in 30 yrs
- 3 days/yr
Risk factors via First Street. Map © Google.
Why this score? — see what drove the D grade
The composite is a weighted blend of 9 inputs, each scored 0–100. Each bar is that input's sub-score; the figure is the points it added to the 100-point composite (weight × sub-score).
- Cash flow +12.5/30.0
- ARV discount +7.4/15.0
- Schools +5.2/10.0
- DSCR +3.7/10.0
- 1% rule +3.5/10.0
- Rent growth +3.5/5.0
- Livability +3.5/5.0
- Condition / age +2.5/5.0
- Appreciation +0.0/10.0
$310,000
🖨 Deal sheet (PDF) 📄 Offer letter ✓ Due diligence
Listing remarks
Under contract-accepting backup offers. TAKING BACK UP OFFERS. Welcome to this beautifully updated Corpus Christi model home in The Villages, located in the highly desirable Village of Amelia. This 3-bedroom, 2-bath home in The Villages is being offered TURNKEY, making it a perfect move-in ready opportunity for buyers looking for homes for sale in The Villages under $350K. This well-maintained home has been thoughtfully upgraded and improved, including a NEW ROOF (2024), HVAC system (2023), stainless steel appliances (2021), QUARTZ countertops (2021), and luxury vinyl plank flooring (2021) in the living room. Additional upgrades include fresh interior paint, updated fans and light fixtures,
Key facts
- Quartz countertops
- Solar tube
- Hvac system
Tags
Property features AI
Finance
- Other: Turnkey (furnished); Irrigation equipment; Lot approximately 0.12 acres; Asphalt road access
- HOA & community: Street lights; Senior community; CDD present
Exterior
- Parking: Attached garage (1 car)
- Utilities: Public water; Public sewer; Cable available; Electricity connected; Sewer connected; Water connected
- Home design: Single-family residence; One level; Faces west
- Construction: Vinyl siding; Shingle roof; Slab foundation; Builder model: Corpus Christi; Built with a total building area of approximately 1761 sq ft
- Exterior features: Exterior lighting; Sliding doors; Sprinkler (metered)
Interior
- Kitchen: Dishwasher; Disposal; Microwave; Range; Refrigerator; Solid surface counters
- Bedrooms: 3 bedrooms
- Flooring: Ceramic tile
- Bathrooms: 2 full bathrooms
- Heating & cooling: Central heating (electric); Central air
- Interior features: Ceiling fans; Open floorplan; Solid surface counters; Split bedroom layout; Thermostat; Vaulted ceilings; Walk-in closets
- Laundry & utility: Laundry in garage; Washer; Dryer; Electric water heater
Neighborhood map
What this means for you Summary
Snapshot
- This is a 3-bed/2.0-bath single-family listed at $310k.
Deal economics
- At list price, monthly cash flow is $-44 ($-532/yr) — negative.
- To cash-flow at today's rent, offer at most $302k (2.5% below list).
- To meet the 1% rule (rent ≥ 1% of price), the offer needs to be $264k (14.8% below list).
- Recommended offer: $264k (14.8% below list) — sets the bar for 1% rule.
- Cap rate 6.1% vs local median 5.0% in The Villages — meaningfully above typical; check what's discounted (condition, days-on-market, listing class) to confirm the premium yield is real.
Location & tenants
- Location reads 70/100 on livability (#431 in FL) — a middle-class / working-renter tenant base. Strengths: crime A+, housing A, employment B+; Watch: amenities F, commute F, health & safety F.
- Sumter (rural): math 61% / reading 61% proficiency, ranked #11 of 73 in FL (top 15%) — acceptable for families but not a draw, mixed tenant base, ~2y average lease.
- Zoned schools: Wildwood Elementary School (math 49% / reading 52%, grade D+, #1,055 of 2,144 statewide, top 50%, 940 students, 76% FRL); South Sumter Middle School (math 55% / reading 54%, grade B-, #183 of 571 statewide, top 34%, 897 students, 61% FRL) — zoned schools average 68% FRL vs 51% district-wide (18 pts higher); higher-poverty schools than district average — tighter screening recommended.
- Market conditions: Rents rising (+3.9%/yr); 551 active listings in the ZIP; 4 comparable units currently listed for rent nearby; rentals at typical pace (median 23d on market — plan ~3-4 weeks tenant-placement turnaround); 3,961 units permitted in Sumter County in 2024 (248 in 5+ unit buildings).
- This rent runs 43% of the median local income ($74k/yr) — at the standard rent-burdened threshold; future hikes will face affordability resistance.
Forward outlook
- Local home prices are declining (-3.0%/yr); year-one equity from $2k of loan paydown is wiped out by about $9k of value loss. Plan a longer hold.
- Sumter County population projected at +45% by 2050 — long-run rental-demand tailwind backs the buy-and-hold thesis.
Negotiation context
- It's been on market 70 days — a 6% lower offer ($291k) is reasonable based on typical stale-listing flexibility.
- Current owner paid $195k; list at $310k implies a 59% gain — meaningful room to come down on a strong offer.
Risks & watch-outs
- Climate carrying-cost: severe wind risk, 99% chance of damaging wind over 30y; extreme-heat days projected 7→23/yr by 2055 (HVAC capex compounding) — expect insurance premiums to compound above CPI over the hold.
Questions for the listing agent
- What do current leases actually rent for vs. the listed asking? Can we see a recent rent roll and the last 12 months of T-12 income?
- It's been on market 70 days. Have you received any prior offers? Is the seller open to a 15% concession, seller financing, or rate buy-down credit?
- Why hasn't it sold? Are there any deal-killer items the seller is aware of (foundation, flood, title, zoning, code violations)?
- Is there a deadline driving the sale (1031 exchange, divorce, estate, relocation)? That informs how much negotiation room exists.
- Schools are A-rated — typically a magnet for longer-tenancy family renters. What's the average tenant stay here, and is there a school-zone premium baked into asking?
- The area grade is low — what's the realistic commute time and amenity access for the typical tenant pool here? Any planned neighborhood developments (good or bad) we should know about?
- What's the average days-on-market for RENTAL listings here right now (not sales)? A rising rental-DOM trend means longer vacancies and softer asking-rent achievability than the comps imply.
- What's the recent tenant-quality profile in this submarket — average credit score on applications, eviction rate, late-payment / NSF rate, and stable-employment percentage? A property-management company in the area should have these aggregated.
- How much new for-sale + rental construction is in the pipeline within 1–3 miles? Heavy new supply typically softens prices + rents 12–24 months out; constrained supply supports both.
Investment metrics
- 1% rule
- 0.85% ✗
- Cap rate
- 6.12%
- Cash-on-cash
- -0.61%
- DSCR
- 0.97
- GRM
- 9.8
CMA / ARV
- ARV (on-the-fly)
- $309,250
- Comps found
- 12
Show comp detail 12 sales within ~0.75 mi
| Address | Dist | Beds/Ba | Sqft | Sold | Price | $/sf | Match |
|---|---|---|---|---|---|---|---|
| 2082 Harston Trl | 0.29mi | 2/2.0 (-1) | 1,187 (-4%) | 4mo | $310,000 | $261 | 71 |
| 506 Arbella Loop | 0.31mi | 3/2.0 | 1,392 (+12%) | 2mo | $366,000 | $263 | 63 |
| 2076 Harston Trl | 0.31mi | 3/2.0 | 1,392 (+12%) | 7mo | $350,000 | $251 | 59 |
| 445 Keyhole St | 0.39mi | 3/2.0 | 1,392 (+12%) | 2mo | $330,000 | $237 | 59 |
| 585 Lacy Pl | 0.69mi | 2/2.0 (-1) | 1,196 (-3%) | 2mo | $321,500 | $269 | 56 |
| 2020 Harston Trl | 0.45mi | 3/2.0 | 1,392 (+12%) | 6mo | $375,000 | $269 | 54 |
| 287 Mercer Way | 0.57mi | 3/2.0 | 1,392 (+12%) | 1mo | $253,000 | $182 | 52 |
| 438 Grovewood Pl | 0.58mi | 3/2.0 | 1,397 (+13%) | 4mo | $325,000 | $233 | 48 |
| 2457 Fosgate Pl | 0.60mi | 2/2.0 (-1) | 1,132 (-8%) | 6mo | $263,000 | $232 | 48 |
| 2512 Jessup St | 0.59mi | 3/2.0 | 1,392 (+12%) | 5mo | $325,000 | $233 | 47 |
| 552 Audrey Ln | 0.60mi | 3/2.0 | 1,397 (+13%) | 6mo | $349,900 | $250 | 46 |
| 594 Lacy Pl | 0.68mi | 3/2.0 | 1,397 (+13%) | 2mo | $342,000 | $245 | 46 |
Match score weights: distance 35% · size 25% · config 20% · recency 20%. Top-matched comps best support the ARV.
Projected returns pro-forma
-3.0% appreciation · 3.92% rent growth · sell at horizon
- IRR
- -16.3%
- Equity multiple
- 0.42×
- Total profit
- $-50,556
- Equity at exit
- $46,222
- IRR
- -6.4%
- Equity multiple
- 0.57×
- Total profit
- $-37,212
- Equity at exit
- $26,803
Cash invested: $86,800 (down + closing). Projections, not guarantees.
Landlord ↔ Tenant lean methodology
- Overall (STATE)
- 87 Strongly Landlord-Friendly
- State Florida
- 87 Strongly Landlord-Friendly · R+3
- County
- — inherits STATE
- City
- — inherits STATE
ZIP-level market 32162
- Home prices YoY
- -6.9%
- Rents YoY
- 3.9%
- Active inventory
- 551
- Price-to-rent
- 9.8×
Monthly cashflow live
- Estimated rent
- $2,641 medium interval (Pro) →
- Mortgage (P&I)
- −$1,626
- Tax from tax record
- −$375 /mo · $4,506/yr
- Insurance
- −$129
- HOA
- −$0
- Vacancy / Maint / Mgmt
- −$555
- Net cashflow
- $-44
Break-even live
Sensitivity live
| Price | -10% $131 | -5% $43 | +0% $-44 | +5% $-132 | +10% $-220 |
|---|---|---|---|---|---|
| Rent | -10% $-253 | -5% $-149 | +0% $-44 | +5% $60 | +10% $164 |
| Rate | -1.0pp $112 | -0.5pp $35 | base $-44 | +0.5pp $-125 | +1.0pp $-206 |
UW: 25.0% down · 7.5% · 30yr · 1.5% tax · 5.0% vac · 8.0% maint · 8.0% mgmt
Financing live
Cash to close
- Down payment
- $77,500
- Closing costs
- $9,300
- Reserves months
- —
- Total cash needed
- —
Loan-product check · same deal, 3 products live
Conventional
25% down · 7.5% · 30yr
- Down + closing
- —
- Monthly P&I
- —
- Monthly cashflow
- —
- DSCR
- —
- Eligible?
- —
Personal DTI + credit; lowest rate.
DSCR
20% down · 8.5% · 30yr
- Down + closing
- —
- Monthly P&I
- —
- Monthly cashflow
- —
- DSCR
- —
- Eligible?
- —
No personal income docs; deal must DSCR.
Hard money
10% down · 12.0% · 12mo
- Down + closing
- —
- Monthly P&I
- —
- Monthly cashflow
- —
- DSCR
- —
- Eligible?
- —
Short-term bridge; refi at stabilization.
Rent comps 4 comps
| Address | Beds | Baths | Sqft | Rent | $/sqft | DOM | Units | Dist |
|---|---|---|---|---|---|---|---|---|
| 470 Oboe Way The Villages, FL | 2.0 | 2.0 | 1240 | $2,200 | $1.77 | 23d | 1 | 0.46mi |
| 445 Corbett Dr The Villages, FL | 2.0 | 2.0 | 1100 | $2,700 | $2.45 | 23d | 1 | 0.59mi |
| 3530 E Harbor Dr Fruitland Park, FL | 1.0–3.0 | 1.0–2.0 | 1061 | $2,014 | $1.90 | 0d | 36 | 1.27mi |
| 1315 Fort Lawn Loop The Villages, FL | 2.0 | 2.0 | 1392 | $4,500 | $3.23 | 23d | 1 | 1.48mi |
Listing history 7 events
-
2026-05-20status Pending
-
2026-05-13price $310,000
-
2026-05-04price $320,000
-
2026-03-11$330,000 Active
-
2015-02-03soldstatus $194,900
-
2013-07-12soldstatus $168,000
-
2011-12-01soldstatus $146,000
ⓘ Source: listings_history table (triggers on properties + properties_extension) + one-shot
backfill from property_details.listing_events for pre-trigger history.
Tax reassessment forecast FL · Resets to sale price
- Current annual tax
- $4,506 · $375/mo
- Projected year-2 tax
- $4,506 · $375/mo
- Expected delta
- $0/yr ($0/mo · 0.0%)
ⓘ Screening estimate from a state-policy table — verify with the county assessor before closing.
Climate risk First Street
- Flood 1/10 Low FEMA zone X (unshaded) · 0% chance over 30 yrs
- Wildfire 4/10 Moderate
- Heat 9/10 Extreme 7 d/yr ≥108°F today · 23 d/yr by 30 yrs out
- Wind 9/10 Extreme 99% chance of damaging wind over 30 yrs
- Air quality 3/10 Moderate 2 unhealthy d/yr today · 3 by 30 yrs out
Nearby sold comps map
Loading sold comps map…
Walkable amenities ~0.75 mi
Loading nearby amenities…
Taxation est. · year 1
- Rental income
- $31,687
- − Mortgage interest
- −$17,365
- − Property taxes
- −$4,506
- − Insurance
- −$1,550
- − Repairs & maintenance
- −$2,535
- − Management
- −$2,535
- − Depreciation
- −$9,018
- Taxable loss
- −$5,822
- Est. tax savings @ 24.0%
- +$1,397
- After-tax cash flow
- $866/yr
For passive investors: Depreciation is non-cash, so a rental often shows a tax loss while cash-flowing — sheltering income. Rental losses are passive: they offset passive income freely, and up to $25,000/yr can offset ordinary (W-2) income if you actively participate and your MAGI is under $100k (phasing out to $0 by $150k); unused losses carry forward. On sale, claimed depreciation is recaptured at up to 25%, and gains may owe capital-gains tax (a 1031 exchange can defer both). Figures are a year-1 estimate at your 24.0% rate — not tax advice; consult a CPA.
Schools (NCES district)
- District
- Sumter
- NCES district ID
- 1201800
- Math proficiency
- 61% ▼ -4.00%
- Reading proficiency
- 61% ▼ -2.00%
- Median HH income
- $48,240
- Composite
- 51.74/100
- National rank
- #1682
- State rank
- #11 of 73 in FL
Livability — The Villages
- Score
- 70/100
- State rank
- #431
- US rank
- #7363
Category grades
Schools grade is shown separately in the Schools card above.
Census & demographics
- Census place
- The Villages, FL
- County
- Sumter County · 110,591 people
- City population
- 83,973
- Metro
- The Villages, FL
- Population (ZIP)
- 55,424
- Household income
- $74,119
- Rent vs Own
- Severe rent burden
- 987.0
Population outlook (Sumter County) Hauer SSP2
- Today (2025)
- 161,172 people
- By 2030
- 180,083 · +11.7%
- By 2040
- 209,892 · +30.2%
- By 2050
- 234,186 · +45.3%
- By 2075
- 284,602 · +76.6%
- By 2100
- 317,039 · +96.7%
Race, ethnicity, and origin ACS 2023
- Neighborhood character
- Predominantly White (95%)
- Race & ethnicity
- White 95% Two or more races 2% Hispanic / Latino 2% Asian 1% Black 1%
- Common ancestry
- Romanian 7% Slovak 4% Lithuanian 4%
- Foreign-born
- 5% · Canada
- Languages at home
- 96% English-only · Spanish 1% Tagalog/Filipino 1%
Political lean MEDSL · Sumter
- 2024 margin
- Solid R (+37.6) · D 30.9% · R 68.6%
- 2008→2024 swing
- -10.6pp toward R · 2008: -27.0pp · 2024: -37.6pp
- All cycles
- 2024: R+37.6 2020: R+36.1 2016: R+39.2 2012: R+34.9 2008: R+27.0
Not yet ingested
- Civics
- —
Market trends
- HPI YoY
- ▼ -16.16%
- Current HPI
- 218.1956
- Rent YoY
- ▲ 3.92%
- Metro
- The Villages, FL
- State GDP YoY
- ▲ 3.28%
- F500 in state
- 36
Industry mix (Fortune 500 HQ in FL)
| Industry | F500 HQs | Revenue |
|---|---|---|
| Industrial Technology | 2 | $29B |
|
||
| Insurance | 2 | $17B |
|
||
| Retail | 1 | $60B |
|
||
| Technology Distribution | 1 | $58B |
|
||
| Homebuilding | 1 | $35B |
|
||
| Technology Manufacturing | 1 | $35B |
|
||
Price history
+112.3% since first listed7 events — show timeline
- 2026-05-20 Pending — Stellar MLS as Distributed by MLS Grid
- 2026-05-13 Price Changed $310,000 Stellar MLS as Distributed by MLS Grid
- 2026-05-04 Price Changed $320,000 Stellar MLS as Distributed by MLS Grid
- 2026-03-11 Listed $330,000 Stellar MLS as Distributed by MLS Grid
- 2015-02-03 Sold (Public Records) $194,900 Public Records
- 2013-07-12 Sold (Public Records) $168,000 Public Records
- 2011-12-01 Sold (Public Records) $146,000 Public Records
Property tax history
+3.2%/yrLatest (2025): $4,506 · -0.7% YoY. Source: county tax records.
Cash-flow waterfall
monthlySold comps — $/sqft
last 12 mo · ≤1 miLoading sold comps…