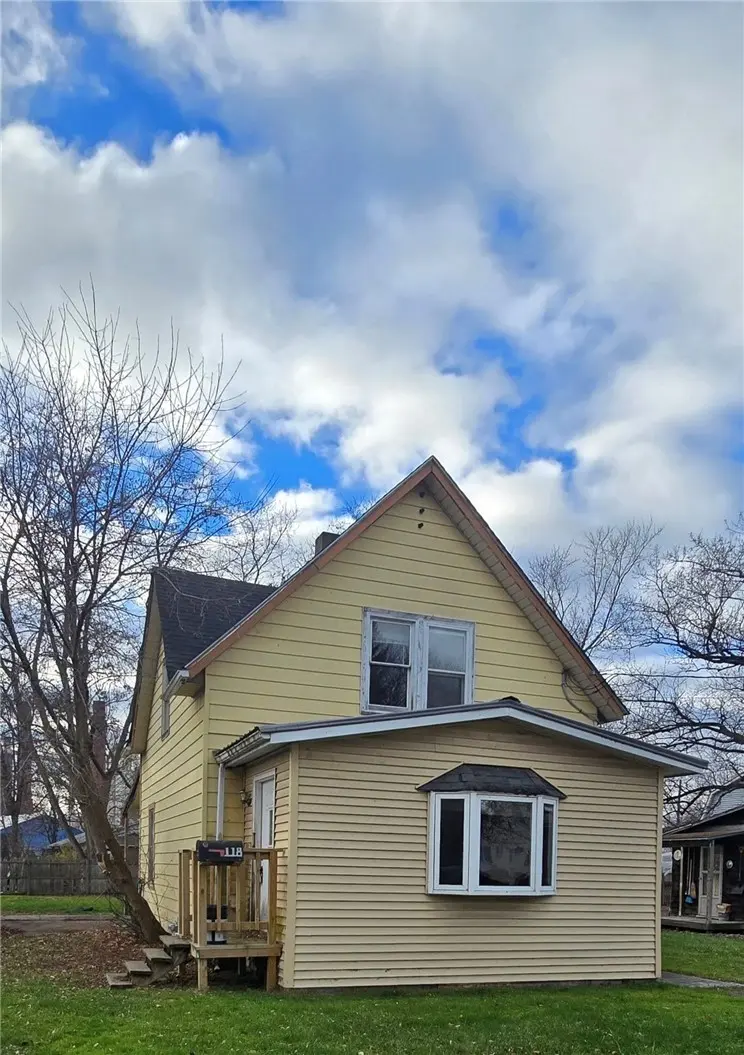
118 Hope · Elmira Heights, NY
Flood risk 1/10 · Minimal
- FEMA flood zone
- X
- Chance of flooding over 30 yrs
- 0.0%
- Est. flood insurance / yr
- $473 – $860
Fire risk 2/10 · Minimal
- Est. fire insurance / yr
- $691 – $1,283
Heat risk 3/10 · Minor
- Hot days now (above 96°F)
- 7 days/yr
- Hot days in 30 yrs
- 16 days/yr
Wind risk 1/10 · Minimal
- Chance of severe wind over 30 yrs
- 1.0%
Air-quality risk 1/10 · Minimal
- Unhealthy air days now
- 0 days/yr
- Unhealthy air days in 30 yrs
- 0 days/yr
Risk factors via First Street. Map © Google.
Why this score? — see what drove the A- grade
The composite is a weighted blend of 9 inputs, each scored 0–100. Each bar is that input's sub-score; the figure is the points it added to the 100-point composite (weight × sub-score).
- Cash flow +30.0/30.0
- ARV discount +15.0/15.0
- 1% rule +10.0/10.0
- DSCR +10.0/10.0
- Appreciation +6.9/10.0
- Schools +3.6/10.0
- Livability +3.6/5.0
- Rent growth +2.5/5.0
- Condition / age +2.5/5.0
$59,500
🖨 Deal sheet 📄 Offer letter ✓ Due diligence
Listing remarks MLS
Welcome to this two-bedroom, 1.5-bathroom house located in the Elmira Heights School District. Ideal for first-time homebuyers or use as a rental investment. This home offers comfort and convenience in a cozy package. Features include : Two spacious bedrooms; One full bathroom and one half bath for added convenience; First-floor laundry room for easy access. Detached garage in the back.
Key facts
- Detached garage
- 5,532 sq ft lot
- Garage
Tags
Neighborhood map
What this means for you Summary
Snapshot
- This is a 2-bed/1.5-bath single-family listed at $60k.
Deal economics
- At list price, monthly cash flow is $479 ($6k/yr) — positive.
- The deal already cash-flows at list — no discount required.
- Meets the 1% rule at list price ($1k rent vs $60k).
Location & tenants
- Location reads 72/100 on livability (#338 in NY) — a middle-class / working-renter tenant base. Strengths: cost of living A+, housing A+, health & safety A+; Watch: employment D, amenities F, commute F.
- Elmira Heights Central School District (suburban): math 39% / reading 46% proficiency, ranked #496 of 590 in NY (top 84%) — families likely to look elsewhere, expect single-tenant / working-renter base with shorter leases.
- Market conditions: 26 active listings in the ZIP; 5 comparable units currently listed for rent nearby; rentals lingering (median 44d on market — plan ~5-8 weeks vacancy on turnover, expect pricing pressure); 100% of comp listings sitting > 30 days — soft ceiling on asking rent; 91 units permitted in Chemung County in 2024 (63 in 5+ unit buildings).
Forward outlook
- In year one you build about $3k of equity ($411 loan paydown + $2k appreciation (3.8% local appreciation)).
- Chemung County population projected at -17% by 2050 — secular population decline; favor cash flow + early exit over multi-decade hold.
- At projected returns (3.8% appreciation + 3.0% rent growth), your $17k cash investment doubles in ~2 years — after that, you're playing with house money.
Negotiation context
- Only 1 days on market — expect competitive offers; lowballing is unlikely to land.
- 4 sale attempts since 25y ago; this cycle's ask has dropped $20k (26%) from the opening price — seller is motivated, your offer sets the floor, not the list.
- Current owner paid $26k; list at $60k implies a 125% gain — meaningful room to come down on a strong offer.
Risks & watch-outs
- Watch-outs: built in 1920 — expect roof / HVAC / electrical / plumbing capex.
Questions for the listing agent
- Built in 1920 — when were the roof, HVAC, electrical panel, plumbing, and water heater last replaced?
- Is there a deadline driving the sale (1031 exchange, divorce, estate, relocation)? That informs how much negotiation room exists.
- What's the average days-on-market for RENTAL listings here right now (not sales)? A rising rental-DOM trend means longer vacancies and softer asking-rent achievability than the comps imply.
- What's the recent tenant-quality profile in this submarket — average credit score on applications, eviction rate, late-payment / NSF rate, and stable-employment percentage? A property-management company in the area should have these aggregated.
- How much new for-sale + rental construction is in the pipeline within 1–3 miles? Heavy new supply typically softens prices + rents 12–24 months out; constrained supply supports both.
Investment metrics
- 1% rule
- 1.89% ✓
- Cap rate
- 15.96%
- Cash-on-cash
- 34.52%
- DSCR
- 2.54
- GRM
- 4.4
CMA / ARV
- ARV (median comp)
- $94,485
- List price
- $59,500
- Delta
- -31.74%
- Verdict
- UNDERPRICED
- Comps
- 20 within 1.0 mi
Show comp detail 8 sales within ~0.75 mi
| Address | Dist | Beds/Ba | Sqft | Sold | Price | $/sf | Match |
|---|---|---|---|---|---|---|---|
| 107 Harrison St | 0.18mi | 2/1.0 | 784 (-7%) | 7mo | $120,000 | $153 | 73 |
| 109 Garfield St | 0.07mi | 2/1.0 | 936 (+12%) | 10mo | $89,900 | $96 | 67 |
| 211 Kendall Pl | 0.33mi | 2/1.0 | 775 (-8%) | 12mo | $80,000 | $103 | 60 |
| 128 Lynwood Ave | 0.12mi | 2/1.0 | 945 (+13%) | 19mo | $122,000 | $129 | 56 |
| 138 Mccauley Ave | 0.47mi | 2/1.0 | 736 (-12%) | 3mo | $68,000 | $92 | 53 |
| 209 Kendall Pl | 0.33mi | 2/1.0 | 754 (-10%) | 20mo | $47,000 | $62 | 49 |
| 275 W 10th St | 0.43mi | 3/1.0 (+1) | 960 (+14%) | 6mo | $90,000 | $94 | 44 |
| 277 W 10th St | 0.74mi | 3/1.0 (+1) | 744 (-11%) | 12mo | $79,000 | $106 | 30 |
Match score weights: distance 35% · size 25% · config 20% · recency 20%. Top-matched comps best support the ARV.
Projected returns pro-forma
3.8% appreciation · 3.0% rent growth · sell at horizon
- IRR
- 41.5%
- Equity multiple
- 3.42×
- Total profit
- $40,261
- Equity at exit
- $29,473
- IRR
- 40.6%
- Equity multiple
- 6.85×
- Total profit
- $97,529
- Equity at exit
- $47,661
Cash invested: $16,660 (down + closing). Projections, not guarantees.
Landlord ↔ Tenant lean methodology
- Overall (STATE)
- 15 Strongly Tenant-Friendly
- State New York
- 15 Strongly Tenant-Friendly · D+10
- County
- — inherits STATE
- City
- — inherits STATE
ZIP-level market 14903
- Home prices YoY
- 1.6%
- Active inventory
- 26
- Price-to-rent
- 4.4×
Monthly cashflow live
- Estimated rent
- $1,127 high interval (Pro) →
- Mortgage (P&I)
- −$312
- Tax est. 1.5%
- −$74 /mo · $892/yr
- Insurance
- −$25
- HOA
- −$0
- Vacancy / Maint / Mgmt
- −$237
- Net cashflow
- $479
Break-even live
UW: 25.0% down · 7.5% · 30yr · 1.5% tax · 5.0% vac · 8.0% maint · 8.0% mgmt
Financing live
Cash to close
- Down payment
- $14,875
- Closing costs
- $1,785
- Reserves months
- —
- Total cash needed
- —
Loan-product check · same deal, 3 products live
Conventional
25% down · 7.5% · 30yr
- Down + closing
- —
- Monthly P&I
- —
- Monthly cashflow
- —
- DSCR
- —
- Eligible?
- —
Personal DTI + credit; lowest rate.
DSCR
20% down · 8.5% · 30yr
- Down + closing
- —
- Monthly P&I
- —
- Monthly cashflow
- —
- DSCR
- —
- Eligible?
- —
No personal income docs; deal must DSCR.
Hard money
10% down · 12.0% · 12mo
- Down + closing
- —
- Monthly P&I
- —
- Monthly cashflow
- —
- DSCR
- —
- Eligible?
- —
Short-term bridge; refi at stabilization.
Rent comps 5 comps
| Address | Beds | Baths | Sqft | Rent | $/sqft | DOM | Units | Dist |
|---|---|---|---|---|---|---|---|---|
| 2146 College Ave Unit 2C Loft Elmira, NY | 1.0 | 1.0 | 750 | $1,145 | $1.53 | 44d | 1 | 0.53mi |
| 258 E 14th St Elmira, NY | 2.0 | 1.0 | 1100 | $1,200 | $1.09 | 44d | 1 | 0.59mi |
| 200-202 Robinwood Ave Elmira Heights, NY | 1.0 | 1.0 | 700 | $995 | $1.42 | 44d | 1 | 0.64mi |
| 263 W 13th St Unit Lower Elmira Heights, NY | 3.0 | 1.0 | 900 | $1,241 | $1.38 | 44d | 1 | 0.78mi |
| 1056 Walnut St Unit 4 Elmira, NY | 1.0 | 1.0 | 750 | $995 | $1.33 | 44d | 1 | 1.32mi |
Listing history 13 events
-
2026-06-17pricedays on market $59,500 Active 1 DOM
-
2026-04-15price $64,500 390-char remark
Show marketing remark (390 chars)
Welcome to this two-bedroom, 1.5-bathroom house located in the Elmira Heights School District. Ideal for first-time homebuyers or use as a rental investment. This home offers comfort and convenience in a cozy package. Features include : Two spacious bedrooms; One full bathroom and one half bath for added convenience; First-floor laundry room for easy access. Detached garage in the back.
-
2026-03-23price $68,500 390-char remark
Show marketing remark (390 chars)
Welcome to this two-bedroom, 1.5-bathroom house located in the Elmira Heights School District. Ideal for first-time homebuyers or use as a rental investment. This home offers comfort and convenience in a cozy package. Features include : Two spacious bedrooms; One full bathroom and one half bath for added convenience; First-floor laundry room for easy access. Detached garage in the back.
-
2025-11-24$80,000 Active 390-char remark
Show marketing remark (390 chars)
Welcome to this two-bedroom, 1.5-bathroom house located in the Elmira Heights School District. Ideal for first-time homebuyers or use as a rental investment. This home offers comfort and convenience in a cozy package. Features include : Two spacious bedrooms; One full bathroom and one half bath for added convenience; First-floor laundry room for easy access. Detached garage in the back.
-
2025-07-09historical
-
2025-01-09$80,000 Active
-
2008-08-05historical
-
2007-09-28$69,900
-
2002-06-18soldstatus $26,500
-
2002-06-12soldstatus $24,000
-
2001-07-16$32,900
-
2001-06-26soldstatus $28,388
-
1997-07-21soldstatus $42,700
ⓘ Source: listings_history table (triggers on properties + properties_extension) + one-shot
backfill from property_details.listing_events for pre-trigger history.
Climate risk First Street
- Flood 1/10 Low FEMA zone X · 0% chance over 30 yrs
- Wildfire 2/10 Low
- Heat 3/10 Moderate 7 d/yr ≥96°F today · 16 d/yr by 30 yrs out
- Wind 1/10 Low 100% chance of damaging wind over 30 yrs
- Air quality 1/10 Low 0 unhealthy d/yr today · 0 by 30 yrs out
Nearby sold comps map
Loading sold comps map…
Walkable amenities ~0.75 mi
Loading nearby amenities…
Taxation est. · year 1
- Rental income
- $13,525
- − Mortgage interest
- −$3,333
- − Property taxes
- −$892
- − Insurance
- −$298
- − Repairs & maintenance
- −$1,082
- − Management
- −$1,082
- − Depreciation
- −$1,731
- Taxable income
- $5,107
- Est. tax owed @ 24.0%
- −$1,226
- After-tax cash flow
- $4,525/yr
For passive investors: Depreciation is non-cash, so a rental often shows a tax loss while cash-flowing — sheltering income. Rental losses are passive: they offset passive income freely, and up to $25,000/yr can offset ordinary (W-2) income if you actively participate and your MAGI is under $100k (phasing out to $0 by $150k); unused losses carry forward. On sale, claimed depreciation is recaptured at up to 25%, and gains may owe capital-gains tax (a 1031 exchange can defer both). Figures are a year-1 estimate at your 24.0% rate — not tax advice; consult a CPA.
Schools (NCES district)
- District
- Elmira Heights Central School District
- NCES district ID
- 3610590
- Math proficiency
- 39% ▼ -10.00%
- Reading proficiency
- 46% ▲ 7.00%
- Median HH income
- $42,753
- Composite
- 35.85/100
- National rank
- #4821
- State rank
- #496 of 590 in NY
Livability — Elmira Heights
- Score
- 72/100
- State rank
- #338
- US rank
- #5747
Category grades
Schools grade is shown separately in the Schools card above.
Census & demographics
- Census place
- Elmira Heights, NY
- Population (ZIP)
- 7,140
Population outlook (Chemung County) Hauer SSP2
- Today (2025)
- 82,931 people
- By 2030
- 80,356 · -3.1%
- By 2040
- 74,745 · -9.9%
- By 2050
- 69,012 · -16.8%
- By 2075
- 55,689 · -32.8%
- By 2100
- 41,428 · -50.0%
Race, ethnicity, and origin ACS 2023
- Neighborhood character
- Predominantly White (81%)
- Race & ethnicity
- White 81% Black 7% Two or more races 6% Hispanic / Latino 5% Asian 1%
- Common ancestry
- Romanian 5% Slovak 2% Lithuanian 2%
- Foreign-born
- 3% · Canada
- Languages at home
- 97% English-only · Spanish 1% Other Asian/Pacific 1%
Political lean MEDSL · Chemung
- 2024 margin
- R (+16.8) · D 41.6% · R 58.4%
- 2008→2024 swing
- -15.6pp toward R · 2008: -1.2pp · 2024: -16.8pp
- All cycles
- 2024: R+16.8 2020: R+13.4 2016: R+20.0 2012: R+2.9 2008: R+1.2
Not yet ingested
- Civics
- —
Market trends
- HPI YoY
- ▲ 3.80%
- Current HPI
- 234.7884
- Rent YoY
- —
- Metro
- —
- State GDP YoY
- ▲ 2.60%
- F500 in state
- 92
Industry mix (Fortune 500 HQ in NY)
| Industry | F500 HQs | Revenue |
|---|---|---|
| Financial Services | 10 | $950B |
|
||
| Consumer Goods | 9 | $162B |
|
||
| Insurance | 4 | $225B |
|
||
| Telecommunications | 2 | $144B |
|
||
| Pharmaceuticals | 2 | $112B |
|
||
| Media / Entertainment | 2 | $69B |
|
||
Price history
+51.1% since first listed12 events — show timeline
- 2026-04-15 Price Changed $64,500 UNYREIS
- 2026-03-23 Price Changed $68,500 UNYREIS
- 2025-11-24 Listed $80,000 UNYREIS
- 2025-07-09 Listing Removed — UNYREIS
- 2025-01-09 Listed $80,000 UNYREIS
- 2008-08-05 Listing Removed — UNYREIS
- 2007-09-28 Listed $69,900 UNYREIS
- 2002-06-18 Sold (Public Records) $26,500 Public Records
- 2002-06-12 Sold (MLS) $24,000 UNYREIS
- 2001-07-16 Listed $32,900 UNYREIS
- 2001-06-26 Sold (Public Records) $28,388 Public Records
- 1997-07-21 Sold (Public Records) $42,700 Public Records
Property tax history
+1.3%/yrLatest (2025): $3,073 · +2.5% YoY. Source: county tax records.
Cash-flow waterfall
monthlySold comps — $/sqft
last 12 mo · ≤1 miLoading sold comps…