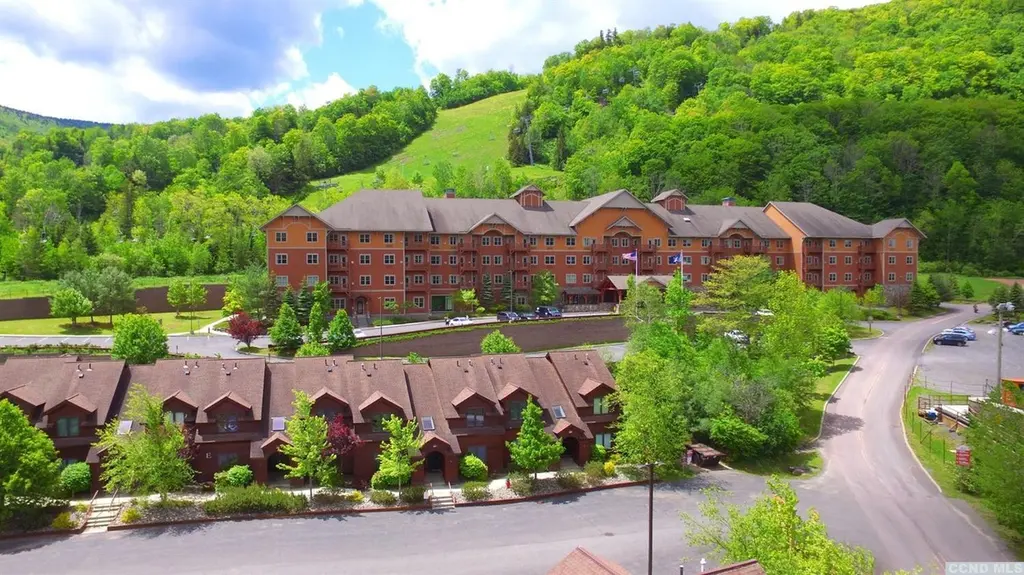
62 Liftside Dr Unit 306/08 F Week 1 · Hunter, NY
Flood risk 1/10 · Minimal
- FEMA flood zone
- X (unshaded)
- Chance of flooding over 30 yrs
- 0.0%
- Est. flood insurance / yr
- $473 – $860
Fire risk 3/10 · Minor
- Est. fire insurance / yr
- $691 – $1,283
Heat risk 2/10 · Minimal
- Hot days now (above 87°F)
- 9 days/yr
- Hot days in 30 yrs
- 21 days/yr
Wind risk 3/10 · Minor
- Chance of severe wind over 30 yrs
- 5.0%
Air-quality risk 2/10 · Minimal
- Unhealthy air days now
- 0 days/yr
- Unhealthy air days in 30 yrs
- 1 days/yr
Risk factors via First Street. Map © Google.
Why this score? — see what drove the C grade
The composite is a weighted blend of 9 inputs, each scored 0–100. Each bar is that input's sub-score; the figure is the points it added to the 100-point composite (weight × sub-score).
- Cash flow +15.0/30.0
- ARV discount +15.0/15.0
- 1% rule +5.0/10.0
- DSCR +5.0/10.0
- Schools +4.6/10.0
- Condition / age +3.8/5.0
- Livability +3.0/5.0
- Appreciation +2.6/10.0
- Rent growth +2.5/5.0
$24,000
🖨 Deal sheet (PDF) 📄 Offer letter ✓ Due diligence
Listing remarks MLS
Beautiful valley views at this Kaatskill Mountain Club part time deeded ownership for 13 full weeks per year. This means you get a full week one week every four weeks. Schedule is rotated each year. Two beds, two bathrooms and two pull out couches. Central air, heat and gas fireplace. Carefree lifestyle right on the slopes of Hunter Mountain. Restaurant, bar, heated outdoor pool, Jacuzzis, gym, sauna, steam room, and more right on the premises. Two units with connecting door. Use one, rent one, use both, rent both. 24/7 staff in place. What could be easier. When you purchase an Epic Pass it is usable at all other Vail Resorts. Optional RCI vacation exchanges. Floor Plan F. Week 1. HOA fee includes utilities and amenities. Stock photos units may vary slightly. This is a fractional interest condominium, please contact listing agent for further details.
Key facts
- Sauna
- Steam room
- Heated outdoor pool
Tags
Neighborhood map
What this means for you Summary
Snapshot
- This is a 2-bed/2.0-bath single-family listed at $24k. Condition is rated good.
Deal economics
- At list price, monthly cash flow is $239 ($3k/yr) — positive.
- The deal already cash-flows at list — no discount required.
- Meets the 1% rule at list price ($1k rent vs $24k).
- Recommended offer: $21k (12.0% below list) — sets the bar for market timing.
- Cap rate 18.2% vs local median 1.6% in Hunter — top-decile yield for the area; either an underpriced asset or a hidden risk that comps aren't pricing in. Stress-test before assuming the spread holds.
Location & tenants
- Location reads 60/100 on livability (#971 in NY) — a middle-class / working-renter tenant base. Strengths: health & safety A+; Watch: housing D+, crime F, amenities F.
- Hunter-Tannersville Central School District (rural): math 55% / reading 50% proficiency, ranked #425 of 755 in NY (top 56%) — acceptable for families but not a draw, mixed tenant base, ~2y average lease.
- Market conditions: 114 active listings in the ZIP; 97 units permitted in Greene County in 2024 (0 in 5+ unit buildings).
Forward outlook
- Local home prices are declining (-3.0%/yr); year-one equity from $166 of loan paydown is wiped out by about $720 of value loss. Plan a longer hold.
- Greene County population projected at -22% by 2050 — secular population decline; favor cash flow + early exit over multi-decade hold.
- At projected returns (-3.0% appreciation + 3.0% rent growth), your $7k cash investment doubles in ~3 years — after that, you're playing with house money.
Negotiation context
- It's been on market 406 days — a 12% lower offer ($21k) is reasonable based on typical stale-listing flexibility.
Risks & watch-outs
- Watch-outs: HOA is 40% of rent.
Questions for the listing agent
- It's been on market 406 days. Have you received any prior offers? Is the seller open to a 12% concession, seller financing, or rate buy-down credit?
- What does the HOA fee cover, when was the last increase, and are there any pending special assessments or reserve-fund shortfalls?
- Why hasn't it sold? Are there any deal-killer items the seller is aware of (foundation, flood, title, zoning, code violations)?
- Is there a deadline driving the sale (1031 exchange, divorce, estate, relocation)? That informs how much negotiation room exists.
- Crime grade is F in this area — have there been break-ins, vandalism, or insurance claims at this property in the last 3 years? What carrier currently insures it and at what premium?
- What's the average days-on-market for RENTAL listings here right now (not sales)? A rising rental-DOM trend means longer vacancies and softer asking-rent achievability than the comps imply.
- What's the recent tenant-quality profile in this submarket — average credit score on applications, eviction rate, late-payment / NSF rate, and stable-employment percentage? A property-management company in the area should have these aggregated.
- How much new for-sale + rental construction is in the pipeline within 1–3 miles? Heavy new supply typically softens prices + rents 12–24 months out; constrained supply supports both.
Investment metrics
- 1% rule
- 4.36% ✓
- Cap rate
- 18.22%
- Cash-on-cash
- 42.60%
- DSCR
- 2.90
- GRM
- 1.9
CMA / ARV
- ARV (median comp)
- $30,496
- List price
- $24,000
- Delta
- -21.30%
- Verdict
- UNDERPRICED
- Comps
- 20 within 1.0 mi
Show comp detail 7 sales within ~0.75 mi
| Address | Dist | Beds/Ba | Sqft | Sold | Price | $/sf | Match |
|---|---|---|---|---|---|---|---|
| 62 - 233F Liftside Dr Unit all 4 | 0.04mi | 2/2.0 | 831 (0%) | 12mo | $75,000 | $90 | 88 |
| 62 Liftside Dr Unit 306F4 | 0.00mi | 2/2.0 | 831 (0%) | 17mo | $22,500 | $27 | 86 |
| 62 - 232234F1 Liftside Dr Unit Week1 | 0.04mi | 2/2.0 | 831 (0%) | 23mo | $20,000 | $24 | 79 |
| 73 Liftside Dr Unit B-6 | 0.06mi | 1/1.0 (-1) | 788 (-5%) | 11mo | $285,000 | $362 | 71 |
| 73 Liftside Dr Unit B10 | 0.06mi | 1/1.0 (-1) | 788 (-5%) | 23mo | $297,500 | $378 | 60 |
| 82 Liftside Unit A-10 | 0.10mi | 1/1.0 (-1) | 750 (-10%) | 18mo | $327,500 | $437 | 56 |
| 167 Pine Ln | 0.65mi | 3/1.0 (+1) | 924 (+11%) | 18mo | $591,000 | $640 | 27 |
Match score weights: distance 35% · size 25% · config 20% · recency 20%. Top-matched comps best support the ARV.
Projected returns pro-forma
-3.0% appreciation · 3.0% rent growth · sell at horizon
- IRR
- 39.9%
- Equity multiple
- 2.72×
- Total profit
- $11,581
- Equity at exit
- $3,578
- IRR
- 46.5%
- Equity multiple
- 5.58×
- Total profit
- $30,770
- Equity at exit
- $2,075
Cash invested: $6,720 (down + closing). Projections, not guarantees.
Landlord ↔ Tenant lean methodology
- Overall (STATE)
- 15 Strongly Tenant-Friendly
- State New York
- 15 Strongly Tenant-Friendly · D+10
- County
- — inherits STATE
- City
- — inherits STATE
ZIP-level market 12442
- Home prices YoY
- -1.1%
- Active inventory
- 114
- Price-to-rent
- 1.9×
Monthly cashflow live
- Estimated rent
- $1,047 medium interval (Pro) →
- Mortgage (P&I)
- −$126
- Tax est. 1.5%
- −$30 /mo · $360/yr
- Insurance
- −$10
- HOA
- −$423
- Vacancy / Maint / Mgmt
- −$220
- Net cashflow
- $239
Break-even live
Sensitivity live
| Price | -10% $255 | -5% $247 | +0% $239 | +5% $230 | +10% $222 |
|---|---|---|---|---|---|
| Rent | -10% $156 | -5% $197 | +0% $239 | +5% $280 | +10% $321 |
| Rate | -1.0pp $251 | -0.5pp $245 | base $239 | +0.5pp $232 | +1.0pp $226 |
UW: 25.0% down · 7.5% · 30yr · 1.5% tax · 5.0% vac · 8.0% maint · 8.0% mgmt
Financing live
Cash to close
- Down payment
- $6,000
- Closing costs
- $720
- Reserves months
- —
- Total cash needed
- —
Loan-product check · same deal, 3 products live
Conventional
25% down · 7.5% · 30yr
- Down + closing
- —
- Monthly P&I
- —
- Monthly cashflow
- —
- DSCR
- —
- Eligible?
- —
Personal DTI + credit; lowest rate.
DSCR
20% down · 8.5% · 30yr
- Down + closing
- —
- Monthly P&I
- —
- Monthly cashflow
- —
- DSCR
- —
- Eligible?
- —
No personal income docs; deal must DSCR.
Hard money
10% down · 12.0% · 12mo
- Down + closing
- —
- Monthly P&I
- —
- Monthly cashflow
- —
- DSCR
- —
- Eligible?
- —
Short-term bridge; refi at stabilization.
HOA detail
- Monthly dues
- $423 · $5,076/yr
- Likely covers
- gaspoolgym
Listing history 17 events
-
2026-06-19days on market $24,000 Active 406 DOM
-
2026-06-18days on market $24,000 Active 405 DOM
-
2026-06-17days on market $24,000 Active 404 DOM
-
2026-06-16days on market $24,000 Active 403 DOM
-
2026-06-15days on market $24,000 Active 402 DOM
-
2026-06-14days on market $24,000 Active 400 DOM
-
2026-06-12days on market $24,000 Active 399 DOM
-
2026-06-09days on market $24,000 Active 396 DOM
-
2026-06-08days on market $24,000 Active 395 DOM
-
2026-06-07days on market $24,000 Active 394 DOM
-
2026-06-05days on market $24,000 Active 391 DOM
-
2026-06-03days on market $24,000 Active 390 DOM
-
2026-06-02days on market $24,000 Active 389 DOM
-
2026-06-01days on market $24,000 Active 388 DOM
-
2026-05-31days on market $24,000 Active 387 DOM
-
2026-05-30days on market $24,000 Active 386 DOM
-
2024-11-29$24,000 Active 862-char remark
Show marketing remark (862 chars)
Beautiful valley views at this Kaatskill Mountain Club part time deeded ownership for 13 full weeks per year. This means you get a full week one week every four weeks. Schedule is rotated each year. Two beds, two bathrooms and two pull out couches. Central air, heat and gas fireplace. Carefree lifestyle right on the slopes of Hunter Mountain. Restaurant, bar, heated outdoor pool, Jacuzzis, gym, sauna, steam room, and more right on the premises. Two units with connecting door. Use one, rent one, use both, rent both. 24/7 staff in place. What could be easier. When you purchase an Epic Pass it is usable at all other Vail Resorts. Optional RCI vacation exchanges. Floor Plan F. Week 1. HOA fee includes utilities and amenities. Stock photos units may vary slightly. This is a fractional interest condominium, please contact listing agent for further details.
ⓘ Source: listings_history table (triggers on properties + properties_extension) + one-shot
backfill from property_details.listing_events for pre-trigger history.
Climate risk First Street
- Flood 1/10 Low FEMA zone X (unshaded) · 0% chance over 30 yrs
- Wildfire 3/10 Moderate
- Heat 2/10 Low 9 d/yr ≥87°F today · 21 d/yr by 30 yrs out
- Wind 3/10 Moderate 5% chance of damaging wind over 30 yrs
- Air quality 2/10 Low 0 unhealthy d/yr today · 1 by 30 yrs out
Nearby sold comps map
Loading sold comps map…
Walkable amenities ~0.75 mi
Loading nearby amenities…
Taxation est. · year 1
- Rental income
- $12,568
- − Mortgage interest
- −$1,344
- − Property taxes
- −$360
- − Insurance
- −$120
- − Repairs & maintenance
- −$1,005
- − Management
- −$1,005
- − HOA
- −$5,076
- − Depreciation
- −$698
- Taxable income
- $2,959
- Est. tax owed @ 24.0%
- −$710
- After-tax cash flow
- $2,153/yr
For passive investors: Depreciation is non-cash, so a rental often shows a tax loss while cash-flowing — sheltering income. Rental losses are passive: they offset passive income freely, and up to $25,000/yr can offset ordinary (W-2) income if you actively participate and your MAGI is under $100k (phasing out to $0 by $150k); unused losses carry forward. On sale, claimed depreciation is recaptured at up to 25%, and gains may owe capital-gains tax (a 1031 exchange can defer both). Figures are a year-1 estimate at your 24.0% rate — not tax advice; consult a CPA.
Condition & rehab AI · 13 photos
This property is in good condition with a well-maintained exterior and interior. It offers a carefree lifestyle with amenities such as a heated outdoor pool and sauna. The property is move-in ready and would benefit from minor updates to the flooring and smart home technology to further increase its value.
Value-add opportunities
- Resale Update the flooring to modern hardwood or tile for a more contemporary look and improved durability. — Updating the flooring can enhance the home's curb appeal and make it more appealing to potential buyers.
- Rental Install smart home technology for energy efficiency and convenience. — Smart home technology can attract renters who value convenience and energy efficiency.
Renovation cost estimate screening
Value-add ROI direction
- Resale Update the flooring to modern hardwood or tile for a more contemporary look and improved durability. — Updating the flooring can enhance the home's curb appeal and make it more appealing to potential buyers. ↑
- Rental Install smart home technology for energy efficiency and convenience. — Smart home technology can attract renters who value convenience and energy efficiency. ↑
ⓘ Cost ranges are severity-bucket heuristics (US national rule-of-thumb). Get contractor quotes + a written scope before underwriting a rehab budget.
Schools (NCES district)
- District
- Hunter-Tannersville Central School District
- NCES district ID
- 3615060
- Math proficiency
- 55% ▲ 5.00%
- Reading proficiency
- 50% ▬ 0.00%
- Median HH income
- $43,719
- Composite
- 46.19/100
- National rank
- #5442
- State rank
- #425 of 755 in NY
Livability — Hunter
- Score
- 60/100
- State rank
- #971
- US rank
- #18992
Category grades
Schools grade is shown separately in the Schools card above.
Census & demographics
- Census place
- Hunter, NY
- Population (ZIP)
- 425
Population outlook (Greene County) Hauer SSP2
- Today (2025)
- 44,963 people
- By 2030
- 43,126 · -4.1%
- By 2040
- 38,756 · -13.8%
- By 2050
- 34,913 · -22.4%
- By 2075
- 28,156 · -37.4%
- By 2100
- 22,296 · -50.4%
Race, ethnicity, and origin ACS 2023
- Neighborhood character
- Predominantly White (90%)
- Race & ethnicity
- White 90% Hispanic / Latino 8% Two or more races 2% Pacific Islander 1%
- Hispanic origin (detail)
- Puerto Rican 6%
- Common ancestry
- Romanian 15% Scotch-Irish 8% Subsaharan African 4%
- Foreign-born
- 7% · Canada
- Languages at home
- 86% English-only · Spanish 7% Russian/Polish/Slavic 4% German/W. Germanic 2%
Political lean MEDSL · Greene
- 2024 margin
- R (+17.0) · D 41.5% · R 58.5%
- 2008→2024 swing
- -7.1pp toward R · 2008: -9.9pp · 2024: -17.0pp
- All cycles
- 2024: R+17.0 2020: R+15.6 2016: R+27.4 2012: R+11.1 2008: R+9.9
Not yet ingested
- Civics
- —
Market trends
- HPI YoY
- ▼ -4.82%
- Current HPI
- 454.3942
- Rent YoY
- —
- Metro
- —
- State GDP YoY
- ▲ 2.60%
- F500 in state
- 92
Industry mix (Fortune 500 HQ in NY)
| Industry | F500 HQs | Revenue |
|---|---|---|
| Financial Services | 10 | $950B |
|
||
| Consumer Goods | 9 | $162B |
|
||
| Insurance | 4 | $225B |
|
||
| Telecommunications | 2 | $144B |
|
||
| Pharmaceuticals | 2 | $112B |
|
||
| Media / Entertainment | 2 | $69B |
|
||
Price history
1 event — show timeline
- 2024-11-29 Listed $24,000 HVCRMLS
Cash-flow waterfall
monthlySold comps — $/sqft
last 12 mo · ≤1 miLoading sold comps…