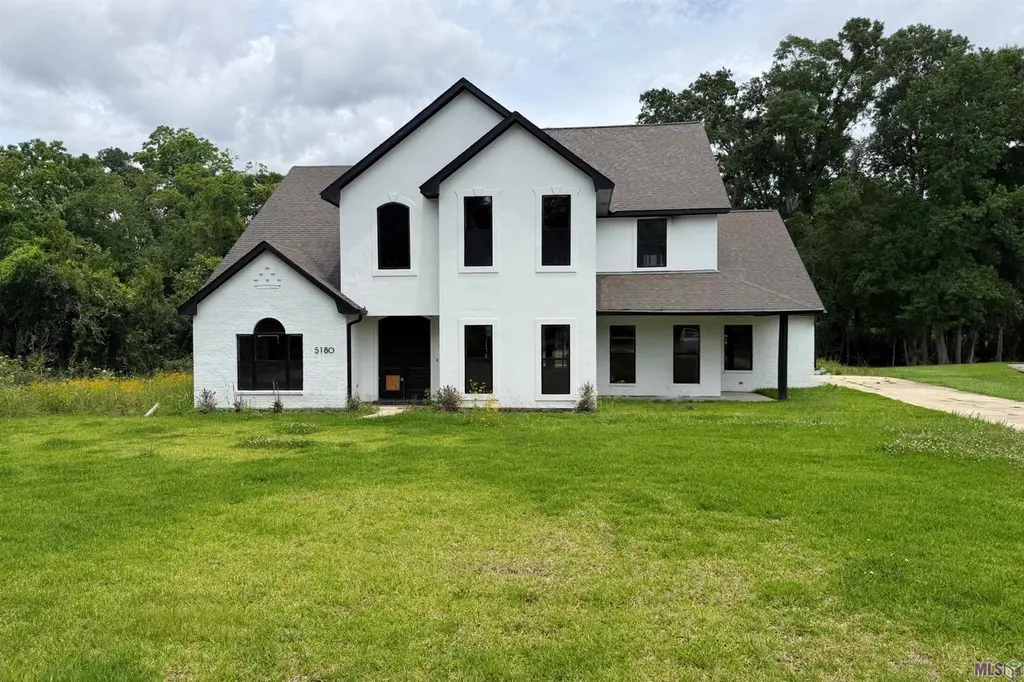
5180 E Chalet Ct · Baton Rouge, LA
Flood risk 7/10 · Major
- FEMA flood zone
- X
- Chance of flooding over 30 yrs
- 0.99%
- Est. flood insurance / yr
- $507 – $1,088
Fire risk 1/10 · Minimal
- Est. fire insurance / yr
- $1,269 – $2,357
Heat risk 8/10 · Major
- Hot days now (above 108°F)
- 7 days/yr
- Hot days in 30 yrs
- 20 days/yr
Wind risk 9/10 · Severe
- Chance of severe wind over 30 yrs
- 99.0%
Air-quality risk 2/10 · Minimal
- Unhealthy air days now
- 1 days/yr
- Unhealthy air days in 30 yrs
- 1 days/yr
Risk factors via First Street. Map © Google.
Why this score? — see what drove the C- grade
The composite is a weighted blend of 9 inputs, each scored 0–100. Each bar is that input's sub-score; the figure is the points it added to the 100-point composite (weight × sub-score).
- Cash flow +21.5/30.0
- ARV discount +7.5/15.0
- DSCR +6.9/10.0
- 1% rule +5.8/10.0
- Livability +3.7/5.0
- Rent growth +2.9/5.0
- Condition / age +2.5/5.0
- Schools +2.4/10.0
- Appreciation +0.0/10.0
$230,000
🖨 Deal sheet 📄 Offer letter ✓ Due diligence
Listing remarks MLS
Rare opportunity in Plantation Trace off Highland Road near LSU! This 4-bedroom, 3 full bath, 2 half bath home sits on a sprawling 1.5+ acre lot and features an in-ground pool with a dedicated outdoor half bath, creating the perfect setup for entertaining and outdoor living. The home has been gutted down to the studs, offering a blank slate for investors, builders, or buyers looking to fully customize the property to their vision. The layout includes spacious common areas, a 2-car garage with an additional boat storage area, and endless possibilities to reimagine the interior. This oversized lot provided endless potential in one of Baton Rouge's most desirable areas.
Key facts
- In-ground pool
- Boat storage area
- Outdoor half bath
Tags
Property features AI
Exterior
- Parking: Garage; Driveway
- Utilities: Public water; Public sewer
- Home design: Detached single-family residence; Residential property
- Construction: Frame and brick construction; Shingle roof; Slab foundation; Built on a 1.522-acre lot
- Exterior features: Rain gutters; Covered porch/patio; Fully fenced yard; Private gunite pool
Interior
- Bathrooms: 2 full bathrooms
- Heating & cooling: Central heating; Central air conditioning
- Interior features: High ceilings; One fireplace
Neighborhood map
What this means for you Summary
Snapshot
- This is a 4-bed/2.0-bath single-family listed at $230k.
Deal economics
- At list price, monthly cash flow is $278 ($3k/yr) — positive.
- The deal already cash-flows at list — no discount required.
- Meets the 1% rule at list price ($2k rent vs $230k).
- Cap rate 8.1% vs local median 4.3% in Baton Rouge — top-decile yield for the area; either an underpriced asset or a hidden risk that comps aren't pricing in. Stress-test before assuming the spread holds.
Location & tenants
- Location reads 74/100 on livability (#24 in LA, #4,535 nationally) — a middle-class / working-renter tenant base. Strengths: commute A+, cost of living A+, health & safety A+; Watch: amenities D, crime F, employment D-.
- East Baton Rouge Parish (urban): math 22% / reading 34% proficiency, ranked #47 of 98 in LA (top 48%) — low school quality limits family demand, transient renter base, plan for 1-2y turnover; 77% free/reduced lunch — lower-income household profile, screen leases tightly.
- Market conditions: Rents rising (+1.5%/yr); 297 active listings in the ZIP; 10 comparable units currently listed for rent nearby; rentals at typical pace (median 23d on market — plan ~3-4 weeks tenant-placement turnaround); 2,252 units permitted in East Baton Rouge Parish in 2024 (440 in 5+ unit buildings).
- This rent runs 43% of the median local income ($69k/yr) — at the standard rent-burdened threshold; future hikes will face affordability resistance.
Forward outlook
- Local home prices are declining (-3.0%/yr); year-one equity from $2k of loan paydown is wiped out by about $7k of value loss. Plan a longer hold.
- East Baton Rouge County population projected at +4% by 2050 — modest demand growth; plan on rents tracking national, not racing it.
Negotiation context
- Only 3 days on market — expect competitive offers; lowballing is unlikely to land.
- 2 sale attempts with the ask held roughly flat each time — persistent listings suggest the price (not the market) is what's stuck; bring a comps-based counter.
Risks & watch-outs
- Watch-outs: flood insurance adds $66/mo.
- Climate carrying-cost: major flood risk; severe wind risk, 99% chance of damaging wind over 30y; extreme-heat days projected 7→20/yr by 2055 (HVAC capex compounding) — expect insurance premiums to compound above CPI over the hold.
Questions for the listing agent
- What's the actual annual flood-insurance premium (NFIP or private), and is the property in a SFHA with mandatory coverage?
- Is there a deadline driving the sale (1031 exchange, divorce, estate, relocation)? That informs how much negotiation room exists.
- Crime grade is F in this area — have there been break-ins, vandalism, or insurance claims at this property in the last 3 years? What carrier currently insures it and at what premium?
- What's the average days-on-market for RENTAL listings here right now (not sales)? A rising rental-DOM trend means longer vacancies and softer asking-rent achievability than the comps imply.
- What's the recent tenant-quality profile in this submarket — average credit score on applications, eviction rate, late-payment / NSF rate, and stable-employment percentage? A property-management company in the area should have these aggregated.
- How much new for-sale + rental construction is in the pipeline within 1–3 miles? Heavy new supply typically softens prices + rents 12–24 months out; constrained supply supports both.
Investment metrics
- 1% rule
- 1.08% ✓
- Cap rate
- 8.09%
- Cash-on-cash
- 6.43%
- DSCR
- 1.29
- GRM
- 7.7
CMA / ARV
- ARV (on-the-fly)
- $657,360
- Comps found
- 12
Show comp detail 12 sales within ~0.75 mi
| Address | Dist | Beds/Ba | Sqft | Sold | Price | $/sf | Match |
|---|---|---|---|---|---|---|---|
| 825 Bourbon Ave | 0.10mi | 4/2.5 | 2,587 (-6%) | 2mo | $299,900 | $116 | 83 |
| 623 Ursuline Dr | 0.22mi | 4/3.0 | 2,733 (-0%) | 10mo | $670,000 | $245 | 77 |
| 628 College Hill Dr | 0.56mi | 4/2.0 | 2,863 (+4%) | 2mo | $389,999 | $136 | 65 |
| 437 Delgado Dr | 0.40mi | 4/2.5 | 2,482 (-9%) | 6mo | $400,000 | $161 | 58 |
| 112 Burrow Rd | 0.49mi | 4/3.5 | 2,647 (-3%) | 10mo | $699,000 | $264 | 58 |
| 102 Burrow Rd | 0.48mi | 4/3.5 | 2,649 (-3%) | 10mo | $700,000 | $264 | 57 |
| 1233 Stephens Ave | 0.61mi | 4/3.0 | 2,906 (+6%) | 6mo | $775,000 | $267 | 52 |
| 3616 S Lakeshore Ave | 0.71mi | 4/2.5 | 2,960 (+8%) | 0mo | $465,000 | $157 | 51 |
| 550 Burgin Ave | 0.47mi | 4/3.5 | 2,509 (-8%) | 11mo | $465,000 | $185 | 49 |
| 1244 Pickett Ave | 0.71mi | 4/3.0 | 2,516 (-8%) | 12mo | $460,000 | $183 | 39 |
| 1180 Stanford Ave | 0.64mi | 4/4.0 | 3,030 (+11%) | 12mo | $729,000 | $241 | 34 |
| 1260 Stanford Ave | 0.69mi | 3/2.5 (-1) | 3,120 (+14%) | 13mo | $750,000 | $240 | 27 |
Match score weights: distance 35% · size 25% · config 20% · recency 20%. Top-matched comps best support the ARV.
Projected returns pro-forma
-3.0% appreciation · 1.54% rent growth · sell at horizon
- IRR
- -9.9%
- Equity multiple
- 0.64×
- Total profit
- $-23,043
- Equity at exit
- $34,294
- IRR
- -2.8%
- Equity multiple
- 0.83×
- Total profit
- $-11,198
- Equity at exit
- $19,886
Cash invested: $64,400 (down + closing). Projections, not guarantees.
Landlord ↔ Tenant lean methodology
- Overall (STATE)
- 90 Strongly Landlord-Friendly
- State Louisiana
- 90 Strongly Landlord-Friendly · R+12
- County
- — inherits STATE
- City
- — inherits STATE
ZIP-level market 70808
- Rents YoY
- 1.5%
- Active inventory
- 297
- Price-to-rent
- 7.7×
Monthly cashflow live
- Estimated rent
- $2,491 high interval (Pro) →
- Mortgage (P&I)
- −$1,206
- Tax from tax record
- −$321 /mo · $3,851/yr
- Insurance
- −$96
- Flood insurance flood zone
- −$66 /mo · $798/yr
- HOA
- −$0
- Vacancy / Maint / Mgmt
- −$523
- Net cashflow
- $278
Break-even live
UW: 25.0% down · 7.5% · 30yr · 1.5% tax · 5.0% vac · 8.0% maint · 8.0% mgmt
Financing live
Cash to close
- Down payment
- $57,500
- Closing costs
- $6,900
- Reserves months
- —
- Total cash needed
- —
Loan-product check · same deal, 3 products live
Conventional
25% down · 7.5% · 30yr
- Down + closing
- —
- Monthly P&I
- —
- Monthly cashflow
- —
- DSCR
- —
- Eligible?
- —
Personal DTI + credit; lowest rate.
DSCR
20% down · 8.5% · 30yr
- Down + closing
- —
- Monthly P&I
- —
- Monthly cashflow
- —
- DSCR
- —
- Eligible?
- —
No personal income docs; deal must DSCR.
Hard money
10% down · 12.0% · 12mo
- Down + closing
- —
- Monthly P&I
- —
- Monthly cashflow
- —
- DSCR
- —
- Eligible?
- —
Short-term bridge; refi at stabilization.
Rent comps 10 comps
| Address | Beds | Baths | Sqft | Rent | $/sqft | DOM | Units | Dist |
|---|---|---|---|---|---|---|---|---|
| 5151 Highland Rd Baton Rouge, LA | 4.0 | 1.0–4.0 | 1129 | $1,734 | $1.54 | 14d | 150 | 0.33mi |
| 5650 Highland Rd Unit C Baton Rouge, LA | 5.0 | 4.0 | 3619 | $600 | $0.17 | 43d | 1 | 0.75mi |
| 5650 Highland Rd Unit C Baton Rouge, LA | 5.0 | 4.0 | 3619 | $600 | $0.17 | 14d | 1 | 0.75mi |
| 4054 Palm St Baton Rouge, LA | 4.0 | 2.0 | 2007 | $2,500 | $1.25 | 14d | 1 | 0.96mi |
| 5618 Cottage Lake Dr Baton Rouge, LA | 3.0 | 2.0 | 2002 | $3,000 | $1.50 | 18d | 1 | 1.11mi |
| 5618 Cottage Lake Dr Baton Rouge, LA | 3.0 | 2.5 | 2002 | $3,000 | $1.50 | 43d | 1 | 1.11mi |
| 218 Lake Breeze Dr Baton Rouge, LA | 3.0 | 2.0 | 1764 | $2,450 | $1.39 | 23d | 1 | 1.16mi |
| 900 Dean Lee Dr Baton Rouge, LA | 2.0–3.0 | 2.0–3.0 | 1585 | $1,800 | $1.14 | 23d | 3 | 1.18mi |
| 900 Dean Lee Dr Baton Rouge, LA | 2.0–3.0 | 2.0–3.0 | 1585 | $1,800 | $1.14 | 43d | 3 | 1.18mi |
| 6414 Highland Rd Baton Rouge, LA | 4.0 | 3.0 | 3475 | $4,800 | $1.38 | 23d | 1 | 1.23mi |
Listing history 4 events
-
2026-06-05statusdays on market $230,000 Pending 3 DOM
-
2026-06-03days on market $230,000 Active 2 DOM
-
2026-06-02remarks 675-char remark
-
2026-06-02$230,000 Active 1 DOM
ⓘ Source: listings_history table (triggers on properties + properties_extension) + one-shot
backfill from property_details.listing_events for pre-trigger history.
Tax reassessment forecast LA · Resets to sale price
- Current annual tax
- $3,851 · $321/mo
- Projected year-2 tax
- $3,851 · $321/mo
- Expected delta
- $0/yr ($0/mo · 0.0%)
ⓘ Screening estimate from a state-policy table — verify with the county assessor before closing.
Climate risk First Street
- Flood 7/10 Severe FEMA zone X · 99% chance over 30 yrs
- Wildfire 1/10 Low
- Heat 8/10 Severe 7 d/yr ≥108°F today · 20 d/yr by 30 yrs out
- Wind 9/10 Extreme 99% chance of damaging wind over 30 yrs
- Air quality 2/10 Low 1 unhealthy d/yr today · 1 by 30 yrs out
Nearby sold comps map
Loading sold comps map…
Walkable amenities ~0.75 mi
Loading nearby amenities…
Taxation est. · year 1
- Rental income
- $29,891
- − Mortgage interest
- −$12,884
- − Property taxes
- −$3,851
- − Insurance
- −$1,948
- − Repairs & maintenance
- −$2,391
- − Management
- −$2,391
- − Depreciation
- −$6,691
- Taxable loss
- −$265
- Est. tax savings @ 24.0%
- +$64
- After-tax cash flow
- $3,405/yr
For passive investors: Depreciation is non-cash, so a rental often shows a tax loss while cash-flowing — sheltering income. Rental losses are passive: they offset passive income freely, and up to $25,000/yr can offset ordinary (W-2) income if you actively participate and your MAGI is under $100k (phasing out to $0 by $150k); unused losses carry forward. On sale, claimed depreciation is recaptured at up to 25%, and gains may owe capital-gains tax (a 1031 exchange can defer both). Figures are a year-1 estimate at your 24.0% rate — not tax advice; consult a CPA.
Schools (NCES district)
- District
- East Baton Rouge Parish
- NCES district ID
- 2200540
- Math proficiency
- 22% ▼ -36.00%
- Reading proficiency
- 34% ▼ -31.00%
- Median HH income
- $46,263
- Composite
- 24.14/100
- National rank
- #7745
- State rank
- #47 of 98 in LA
Livability — Baton Rouge
- Score
- 74/100
- State rank
- #24
- US rank
- #4535
Category grades
Schools grade is shown separately in the Schools card above.
Census & demographics
- Census place
- Baton Rouge, LA
- County
- East Baton Rouge Parish · 399,686 people
- City population
- 351,868
- Metro
- Baton Rouge, LA
- Population (ZIP)
- 35,843
- Household income
- $69,418
- Rent vs Own
- Severe rent burden
- 2545.0
Population outlook (East Baton Rouge County) Hauer SSP2
- Today (2025)
- 464,810 people
- By 2030
- 472,137 · +1.6%
- By 2040
- 480,243 · +3.3%
- By 2050
- 484,422 · +4.2%
- By 2075
- 492,069 · +5.9%
- By 2100
- 476,347 · +2.5%
Race, ethnicity, and origin ACS 2023
- Neighborhood character
- Predominantly White (66%)
- Race & ethnicity
- White 66% Black 20% Two or more races 7% Hispanic / Latino 6% Asian 5%
- Hispanic origin (detail)
- Mexican 1%
- Common ancestry
- Lithuanian 12% Slovak 2% Romanian 2%
- Foreign-born
- 8% · Canada, China, Vietnam
- Languages at home
- 90% English-only · Spanish 2% French/Haitian/Cajun 2% Other Indo-European 1%
Political lean MEDSL · East Baton Rouge
- 2024 margin
- D (+11.1) · D 54.5% · R 43.4% · Other 2.1%
- 2008→2024 swing
- +8.9pp toward D · 2008: 2.2pp · 2024: 11.1pp
- All cycles
- 2024: D+11.1 2020: D+13.1 2016: D+9.2 2012: D+5.2 2008: D+2.2
Not yet ingested
- Civics
- —
Market trends
- HPI YoY
- ▼ -351.73%
- Current HPI
- 196.4406
- Rent YoY
- ▲ 1.54%
- Metro
- Baton Rouge, LA
- State GDP YoY
- ▲ 3.29%
- F500 in state
- 10
Industry mix (Fortune 500 HQ in LA)
| Industry | F500 HQs | Revenue |
|---|---|---|
| Telecommunications | 2 | $23B |
|
||
| Utilities | 1 | $12B |
|
||
| Wholesale / Distribution | 1 | $5B |
|
||
| Advertising | 1 | $2B |
|
||
Price history
+0.0% since first listed2 events — show timeline
- 2026-06-01 Listed $230,000 GBRMLS
- 2026-06-01 Listed $230,000 AcadianaMLS
Property tax history
+2.4%/yrLatest (2025): $3,851 · +4.7% YoY. Source: county tax records.
Cash-flow waterfall
monthlySold comps — $/sqft
last 12 mo · ≤1 miLoading sold comps…