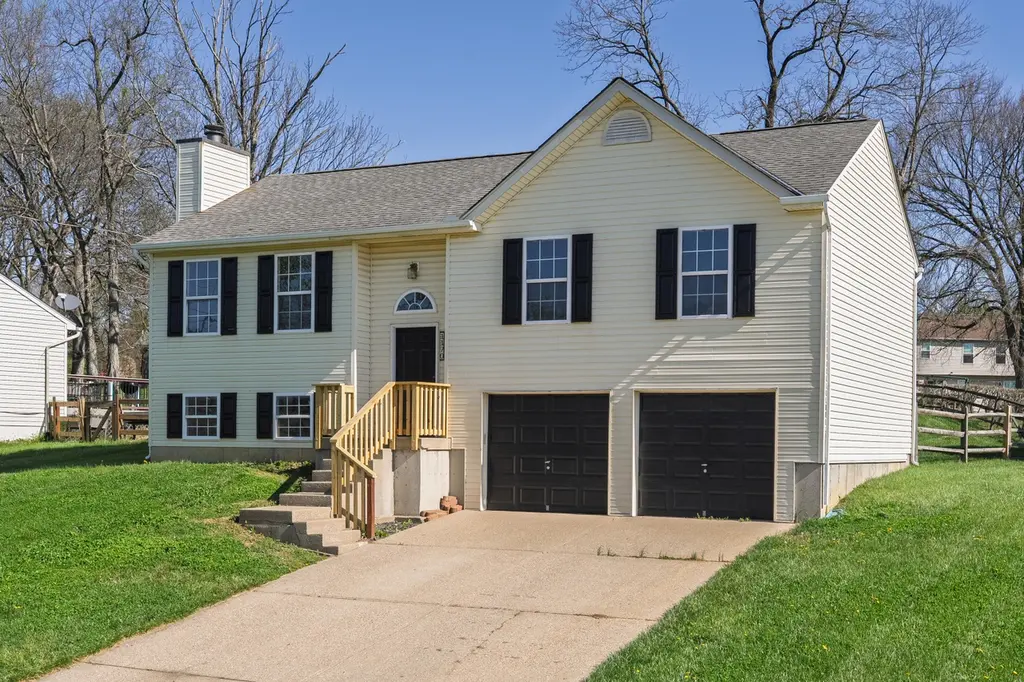
1170 Tyler Ct · Independence, KY
Flood risk 1/10 · Minimal
- FEMA flood zone
- X (unshaded)
- Chance of flooding over 30 yrs
- 0.0%
- Est. flood insurance / yr
- $507 – $1,088
Fire risk 2/10 · Minimal
- Est. fire insurance / yr
- $839 – $1,559
Heat risk 4/10 · Minor
- Hot days now (above 102°F)
- 7 days/yr
- Hot days in 30 yrs
- 19 days/yr
Wind risk 2/10 · Minimal
- Chance of severe wind over 30 yrs
- 1.0%
Air-quality risk 2/10 · Minimal
- Unhealthy air days now
- 1 days/yr
- Unhealthy air days in 30 yrs
- 3 days/yr
Risk factors via First Street. Map © Google.
Why this score? — see what drove the F grade
The composite is a weighted blend of 9 inputs, each scored 0–100. Each bar is that input's sub-score; the figure is the points it added to the 100-point composite (weight × sub-score).
- Cash flow +9.4/30.0
- Schools +4.0/10.0
- Rent growth +3.8/5.0
- Livability +3.6/5.0
- ARV discount +3.4/15.0
- DSCR +2.6/10.0
- Condition / age +2.5/5.0
- 1% rule +2.2/10.0
- Appreciation +0.0/10.0
$290,000
🖨 Deal sheet (PDF) 📄 Offer letter ✓ Due diligence
Listing remarks
Welcome to 1170 Tyler Court in Independence, an updated, move-in ready bi-level tucked at the end of a quiet cul-de-sac with no HOA fees and room to truly live. This spacious 3-bedroom, 2.5-bath home offers a fresh take on the traditional bi-level layout, featuring vaulted ceilings and an open-concept main living area that seamlessly connects the great room, dining space, and kitchen - no dividing walls, just clean sightlines and natural flow. Nearly every surface has been updated, making this home truly turnkey. You'll find new flooring, new carpet, fresh paint throughout, updated cabinetry with new paint, granite countertops, and sleek black stainless appliances that elevate the kitchen's
Key facts
- 0.29 acre lot
- 2 garage spots
- Built 1993
Property features AI
Exterior
- Parking: Attached garage; 2-car garage; Driveway; Garage faces front; Off-street parking
- Utilities: Public water; Public sewer
- Home design: Single family residence; Bi-level
- Construction: Built in 1993; Vinyl siding; Shingle roof; Poured concrete foundation
- Exterior features: Deck
Interior
- Kitchen: Electric cooktop; Electric oven; Dishwasher; Refrigerator; Kitchen (11 x 10)
- Bedrooms: Primary bedroom (11 x 14); Bedroom 2 (10.5 x 9); Bedroom 3 (9.5 x 10.5)
- Bathrooms: 2 full bathrooms; 1 half bathroom; Primary bath (5.5 x 7); Bathroom 2 (5 x 7); Bathroom 3 (9.5 x 5)
- Heating & cooling: Central air conditioning; Electric heating
- Interior features: Inoperable fireplace; Fireplace present; Entry; Dining room; Living room; Family room
- Laundry & utility: Washer; Dryer
Neighborhood map
What this means for you Summary
Snapshot
- This is a 3-bed/2.5-bath single-family listed at $290k.
Deal economics
- At list price, monthly cash flow is $-209 ($-3k/yr) — negative.
- To cash-flow at today's rent, offer at most $253k (12.7% below list).
- To meet the 1% rule (rent ≥ 1% of price), the offer needs to be $208k (28.1% below list).
- Recommended offer: $208k (28.1% below list) — sets the bar for 1% rule.
- Cap rate 5.4% vs local median 3.7% in Independence — top-decile yield for the area; either an underpriced asset or a hidden risk that comps aren't pricing in. Stress-test before assuming the spread holds.
Location & tenants
- Location reads 72/100 on livability (#130 in KY) — a middle-class / working-renter tenant base. Strengths: crime A+, employment A+, cost of living A+; Watch: amenities F, commute F, health & safety F.
- Kenton County (suburban): math 42% / reading 48% proficiency, ranked #14 of 165 in KY (top 8%) — families likely to look elsewhere, expect single-tenant / working-renter base with shorter leases.
- Zoned schools: Woodland Middle School (math 38% / reading 50%, grade D, #40 of 217 statewide, top 19%, 616 students, 48% FRL); Simon Kenton High School (math 40% / reading 44%, grade F, #32 of 254 statewide, top 13%, 1,859 students, 37% FRL).
- Market conditions: Rents rising fast (+5.4%/yr); 258 active listings in the ZIP; 4 comparable units currently listed for rent nearby; rentals at typical pace (median 26d on market — plan ~3-4 weeks tenant-placement turnaround); solid renter incomes; 699 units permitted in Kenton County in 2024 (287 in 5+ unit buildings).
Forward outlook
- Local home prices are declining (-3.0%/yr); year-one equity from $2k of loan paydown is wiped out by about $9k of value loss. Plan a longer hold.
- Kenton County population projected at +5% by 2050 — modest demand growth; plan on rents tracking national, not racing it.
Negotiation context
- Only 4 days on market — expect competitive offers; lowballing is unlikely to land.
- 2 sale attempts with the ask held roughly flat each time — persistent listings suggest the price (not the market) is what's stuck; bring a comps-based counter.
- Current owner paid $98k; list at $290k implies a 194% gain — meaningful room to come down on a strong offer.
Questions for the listing agent
- What do current leases actually rent for vs. the listed asking? Can we see a recent rent roll and the last 12 months of T-12 income?
- Is there a deadline driving the sale (1031 exchange, divorce, estate, relocation)? That informs how much negotiation room exists.
- Schools are B-rated — typically a magnet for longer-tenancy family renters. What's the average tenant stay here, and is there a school-zone premium baked into asking?
- The area grade is low — what's the realistic commute time and amenity access for the typical tenant pool here? Any planned neighborhood developments (good or bad) we should know about?
- What's the average days-on-market for RENTAL listings here right now (not sales)? A rising rental-DOM trend means longer vacancies and softer asking-rent achievability than the comps imply.
- What's the recent tenant-quality profile in this submarket — average credit score on applications, eviction rate, late-payment / NSF rate, and stable-employment percentage? A property-management company in the area should have these aggregated.
- How much new for-sale + rental construction is in the pipeline within 1–3 miles? Heavy new supply typically softens prices + rents 12–24 months out; constrained supply supports both.
Investment metrics
- 1% rule
- 0.72% ✗
- Cap rate
- 5.43%
- Cash-on-cash
- -3.09%
- DSCR
- 0.86
- GRM
- 11.6
CMA / ARV
- ARV (on-the-fly)
- $265,950
- Comps found
- 12
Show comp detail 12 sales within ~0.75 mi
| Address | Dist | Beds/Ba | Sqft | Sold | Price | $/sf | Match |
|---|---|---|---|---|---|---|---|
| 1170 Tyler Ct | 0.00mi | 3/2.5 | 1,182 (0%) | 0mo | $295,000 | $250 | 100 |
| 9826 Codyview Dr | 0.16mi | 3/3.0 | 1,241 (+5%) | 13mo | $300,000 | $242 | 71 |
| 4079 Elizabeth Dr | 0.62mi | 3/2.5 | 1,180 (-0%) | 8mo | $299,000 | $253 | 64 |
| 9897 Flagstone Dr | 0.41mi | 3/2.5 | 1,296 (+10%) | 1mo | $291,000 | $225 | 64 |
| 9831 Codyview Dr | 0.15mi | 3/3.0 | 1,350 (+14%) | 7mo | $284,900 | $211 | 62 |
| 9877 Flagstone Dr | 0.34mi | 3/1.5 | 1,020 (-14%) | 3mo | $295,000 | $289 | 55 |
| 2000 Woodcrest Dr | 0.68mi | 4/2.0 (+1) | 1,202 (+2%) | 11mo | $251,000 | $209 | 50 |
| 1262 Victory Ln | 0.50mi | 3/2.5 | 1,092 (-8%) | 17mo | $270,000 | $247 | 49 |
| 1047 Clubhouse Dr | 0.59mi | 3/1.5 | 1,260 (+7%) | 13mo | $257,500 | $204 | 47 |
| 4096 Kimberly Dr | 0.62mi | 3/2.0 | 1,300 (+10%) | 14mo | $237,500 | $183 | 41 |
| 4070 Kimberly Dr | 0.67mi | 3/1.0 | 1,080 (-9%) | 10mo | $235,000 | $218 | 40 |
| 4749 Buttonwood Dr | 0.72mi | 3/2.5 | 1,028 (-13%) | 11mo | $230,000 | $224 | 36 |
Match score weights: distance 35% · size 25% · config 20% · recency 20%. Top-matched comps best support the ARV.
Projected returns pro-forma
-3.0% appreciation · 5.37% rent growth · sell at horizon
- IRR
- -19.1%
- Equity multiple
- 0.32×
- Total profit
- $-55,289
- Equity at exit
- $43,240
- IRR
- -7.8%
- Equity multiple
- 0.46×
- Total profit
- $-43,625
- Equity at exit
- $25,074
Cash invested: $81,200 (down + closing). Projections, not guarantees.
Landlord ↔ Tenant lean methodology
- Overall (STATE)
- 83 Strongly Landlord-Friendly
- State Kentucky
- 83 Strongly Landlord-Friendly · R+16
- County
- — inherits STATE
- City
- — inherits STATE
ZIP-level market 41051
- Home prices YoY
- -32.6%
- Rents YoY
- 5.4%
- Active inventory
- 258
- Price-to-rent
- 11.6×
Monthly cashflow live
- Estimated rent
- $2,085 medium interval (Pro) →
- Mortgage (P&I)
- −$1,521
- Tax from tax record
- −$214 /mo · $2,573/yr
- Insurance
- −$121
- HOA
- −$0
- Vacancy / Maint / Mgmt
- −$438
- Net cashflow
- $-209
Break-even live
Sensitivity live
| Price | -10% $-45 | -5% $-127 | +0% $-209 | +5% $-291 | +10% $-373 |
|---|---|---|---|---|---|
| Rent | -10% $-374 | -5% $-292 | +0% $-209 | +5% $-127 | +10% $-45 |
| Rate | -1.0pp $-63 | -0.5pp $-135 | base $-209 | +0.5pp $-284 | +1.0pp $-361 |
UW: 25.0% down · 7.5% · 30yr · 1.5% tax · 5.0% vac · 8.0% maint · 8.0% mgmt
Financing live
Cash to close
- Down payment
- $72,500
- Closing costs
- $8,700
- Reserves months
- —
- Total cash needed
- —
Loan-product check · same deal, 3 products live
Conventional
25% down · 7.5% · 30yr
- Down + closing
- —
- Monthly P&I
- —
- Monthly cashflow
- —
- DSCR
- —
- Eligible?
- —
Personal DTI + credit; lowest rate.
DSCR
20% down · 8.5% · 30yr
- Down + closing
- —
- Monthly P&I
- —
- Monthly cashflow
- —
- DSCR
- —
- Eligible?
- —
No personal income docs; deal must DSCR.
Hard money
10% down · 12.0% · 12mo
- Down + closing
- —
- Monthly P&I
- —
- Monthly cashflow
- —
- DSCR
- —
- Eligible?
- —
Short-term bridge; refi at stabilization.
Rent comps 4 comps
| Address | Beds | Baths | Sqft | Rent | $/sqft | DOM | Units | Dist |
|---|---|---|---|---|---|---|---|---|
| 406 Amhurst Dr Independence, KY | 2.0 | 2.0 | 760 | $1,125 | $1.48 | 0d | 1 | 0.79mi |
| 9552 Apple Valley Dr Independence, KY | 2.0 | 2.0 | 1100 | $1,456 | $1.32 | 3d | 6 | 0.88mi |
| 1047 Alpine Ct Independence, KY | 3.0 | 2.0 | 1035 | $2,400 | $2.32 | 25d | 1 | 0.97mi |
| 3924 Trappers Ct Florence, KY | 3.0 | 1.5 | 1384 | $2,380 | $1.72 | 45d | 1 | 1.02mi |
Listing history 6 events
-
2026-05-06status Pending
-
2026-05-04status Active
-
2026-04-16status Pending
-
2026-04-14$290,000 Active
-
1994-01-11soldstatus $98,500
-
1993-08-24soldstatus $20,000
ⓘ Source: listings_history table (triggers on properties + properties_extension) + one-shot
backfill from property_details.listing_events for pre-trigger history.
Tax reassessment forecast KY · Resets to sale price
- Current annual tax
- $2,573 · $214/mo
- Projected year-2 tax
- $2,573 · $214/mo
- Expected delta
- $0/yr ($0/mo · 0.0%)
ⓘ Screening estimate from a state-policy table — verify with the county assessor before closing.
Climate risk First Street
- Flood 1/10 Low FEMA zone X (unshaded) · 0% chance over 30 yrs
- Wildfire 2/10 Low
- Heat 4/10 Moderate 7 d/yr ≥102°F today · 19 d/yr by 30 yrs out
- Wind 2/10 Low 100% chance of damaging wind over 30 yrs
- Air quality 2/10 Low 1 unhealthy d/yr today · 3 by 30 yrs out
Nearby sold comps map
Loading sold comps map…
Walkable amenities ~0.75 mi
Loading nearby amenities…
Taxation est. · year 1
- Rental income
- $25,015
- − Mortgage interest
- −$16,245
- − Property taxes
- −$2,573
- − Insurance
- −$1,450
- − Repairs & maintenance
- −$2,001
- − Management
- −$2,001
- − Depreciation
- −$8,436
- Taxable loss
- −$7,691
- Est. tax savings @ 24.0%
- +$1,846
- After-tax cash flow
- $-665/yr
For passive investors: Depreciation is non-cash, so a rental often shows a tax loss while cash-flowing — sheltering income. Rental losses are passive: they offset passive income freely, and up to $25,000/yr can offset ordinary (W-2) income if you actively participate and your MAGI is under $100k (phasing out to $0 by $150k); unused losses carry forward. On sale, claimed depreciation is recaptured at up to 25%, and gains may owe capital-gains tax (a 1031 exchange can defer both). Figures are a year-1 estimate at your 24.0% rate — not tax advice; consult a CPA.
Schools (NCES district)
- District
- Kenton County
- NCES district ID
- 2103090
- Math proficiency
- 42% ▼ -13.00%
- Reading proficiency
- 48% ▼ -14.00%
- Median HH income
- $66,183
- Composite
- 40.17/100
- National rank
- #3789
- State rank
- #14 of 165 in KY
Livability — Independence
- Score
- 72/100
- State rank
- #130
- US rank
- #6165
Category grades
Schools grade is shown separately in the Schools card above.
Census & demographics
- Census place
- Independence, KY
- County
- Kenton County · 142,881 people
- City population
- 33,054
- Metro
- Cincinnati, OH-KY-IN
- Population (ZIP)
- 33,054
- Household income
- $104,201
- Rent vs Own
- Severe rent burden
- 243.0
Population outlook (Kenton County) Hauer SSP2
- Today (2025)
- 174,205 people
- By 2030
- 177,897 · +2.1%
- By 2040
- 182,671 · +4.9%
- By 2050
- 183,543 · +5.4%
- By 2075
- 178,977 · +2.7%
- By 2100
- 159,920 · -8.2%
Race, ethnicity, and origin ACS 2023
- Neighborhood character
- Predominantly White (93%)
- Race & ethnicity
- White 93% Two or more races 3% Hispanic / Latino 2% Black 1% Asian 1%
- Common ancestry
- Italian 3% Lithuanian 3% Slovak 2%
- Foreign-born
- 3% · China, Canada
- Languages at home
- 96% English-only · Spanish 1% Chinese 1% Other Asian/Pacific 1%
Political lean MEDSL · Kenton
- 2024 margin
- Strong R (+21.7) · D 38.2% · R 59.9% · Other 1.9%
- 2008→2024 swing
- -0.9pp no change · 2008: -20.9pp · 2024: -21.7pp
- All cycles
- 2024: R+21.7 2020: R+19.3 2016: R+26.1 2012: R+24.3 2008: R+20.9
Not yet ingested
- Civics
- —
Market trends
- HPI YoY
- ▼ -105.60%
- Current HPI
- 218.492
- Rent YoY
- ▲ 5.37%
- Metro
- Cincinnati, OH-KY-IN
- State GDP YoY
- ▲ 1.81%
- F500 in state
- 4
Industry mix (Fortune 500 HQ in KY)
| Industry | F500 HQs | Revenue |
|---|---|---|
| Healthcare | 1 | $118B |
|
||
| Food / Beverage | 1 | $7B |
|
||
Price history
+1350.0% since first listed6 events — show timeline
- 2026-05-06 Pending — NKMLS
- 2026-05-04 Relisted — NKMLS
- 2026-04-16 Pending — NKMLS
- 2026-04-14 Listed $290,000 NKMLS
- 1994-01-11 Sold (Public Records) $98,500 Public Records
- 1993-08-24 Sold (Public Records) $20,000 Public Records
Property tax history
+4.1%/yrLatest (2025): $2,573 · +35.2% YoY. Source: county tax records.
Cash-flow waterfall
monthlySold comps — $/sqft
last 12 mo · ≤1 miLoading sold comps…