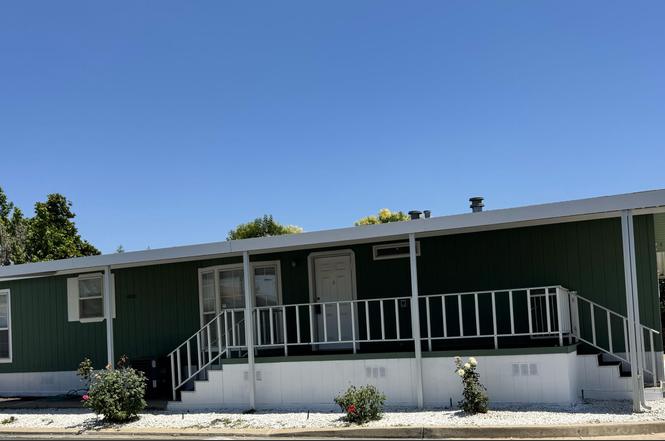
100 S Westwood St #92 · Porterville, CA
Flood risk 5/10 · Moderate
- FEMA flood zone
- X (shaded)
- Chance of flooding over 30 yrs
- 0.24%
- Est. flood insurance / yr
- $507 – $1,088
Fire risk 7/10 · Major
- Est. fire insurance / yr
- $659 – $1,223
Heat risk 8/10 · Major
- Hot days now (above 105°F)
- 7 days/yr
- Hot days in 30 yrs
- 17 days/yr
Wind risk 1/10 · Minimal
- Chance of severe wind over 30 yrs
- —
Air-quality risk 10/10 · Severe
- Unhealthy air days now
- 33 days/yr
- Unhealthy air days in 30 yrs
- 37 days/yr
Risk factors via First Street. Map © Google.
Why this score? — see what drove the B grade
The composite is a weighted blend of 9 inputs, each scored 0–100. Each bar is that input's sub-score; the figure is the points it added to the 100-point composite (weight × sub-score).
- Cash flow +30.0/30.0
- 1% rule +10.0/10.0
- DSCR +10.0/10.0
- ARV discount +7.5/15.0
- Rent growth +3.5/5.0
- Schools +3.5/10.0
- Livability +3.0/5.0
- Condition / age +2.5/5.0
- Appreciation +0.0/10.0
$69,500
🖨 Deal sheet 📄 Offer letter ✓ Due diligence
Listing remarks
This manufactured home is located in Westwood Village a gated senior community This senior (Over 55 yrs of age) park includes clubhouse, inground pool, pickleball, BBQ area. This home has been updated with new flooring throughout, new appliances, new blinds and other upgrades. It is move in ready! 3 bedrooms 2 bathrooms, open floor plan. The seller is offering 6 months paid space rent with an acceptable offer. Call Today!
Key facts
- Clubhouse
- Pickleball
- New flooring
Tags
Property features AI
Finance
- Other: Living area reported as 1,456 square feet
- Financial info: No financial details provided
- HOA & community: Park community (manufactured home in park)
Exterior
- Parking: No parking details provided
- Security: No security details provided
- Utilities: Public water; Public sewer; Natural gas available and connected; Water connected; Sewer connected; Phone connected
- Home design: Manufactured in park; Manufactured home (double wide); Updated/remodeled
- Construction: Composition roof; 26 ft by 56 ft mobile dimensions; Aluminum skirting
- Exterior features: Private and community pool access
Interior
- Kitchen: No specific appliances listed
- Bedrooms: Double wide manufactured home (bedroom count not specified)
- Flooring: No flooring details provided
- Bathrooms: 2 full bathrooms
- Heating & cooling: Central air conditioning; Forced air heating
- Interior features: Updated/remodeled interior
- Laundry & utility: No laundry details provided
Neighborhood map
What this means for you Summary
Snapshot
- This is a 3-bed/2.0-bath land listed at $70k.
Deal economics
- At list price, monthly cash flow is $911 ($11k/yr) — positive.
- The deal already cash-flows at list — no discount required.
- Meets the 1% rule at list price ($2k rent vs $70k).
- Recommended offer: $61k (12.0% below list) — sets the bar for market timing.
- Cap rate 22.0% vs local median 2.7% in Porterville — top-decile yield for the area; either an underpriced asset or a hidden risk that comps aren't pricing in. Stress-test before assuming the spread holds.
Location & tenants
- Location reads 60/100 on livability (#561 in CA) — a middle-class / working-renter tenant base. Strengths: housing A, commute A-; Watch: crime C-, cost of living D+, schools F.
- Burton Elementary (urban): math 31% / reading 42% proficiency, ranked #805 of 1,400 in CA (top 58%) — families likely to look elsewhere, expect single-tenant / working-renter base with shorter leases.
- Market conditions: Rents rising fast (+4.1%/yr); 320 active listings in the ZIP; 1 comparable units currently listed for rent nearby; 1,447 units permitted in Tulare County in 2024 (307 in 5+ unit buildings).
- This rent runs 34% of the median local income ($60k/yr) — at the standard rent-burdened threshold; future hikes will face affordability resistance.
Forward outlook
- Local home prices are declining (-3.0%/yr); year-one equity from $481 of loan paydown is wiped out by about $2k of value loss. Plan a longer hold.
- Tulare County population projected at +10% by 2050 — modest demand growth; plan on rents tracking national, not racing it.
- At projected returns (-3.0% appreciation + 4.1% rent growth), your $19k cash investment doubles in ~3 years — after that, you're playing with house money.
Negotiation context
- It's been on market 143 days — a 12% lower offer ($61k) is reasonable based on typical stale-listing flexibility.
- 10 sale attempts since 4y ago with the ask held roughly flat each time — persistent listings suggest the price (not the market) is what's stuck; bring a comps-based counter.
Risks & watch-outs
- Climate carrying-cost: moderate flood risk; major wildfire risk; extreme-heat days projected 7→17/yr by 2055 (HVAC capex compounding) — expect insurance premiums to compound above CPI over the hold.
Questions for the listing agent
- It's been on market 143 days. Have you received any prior offers? Is the seller open to a 12% concession, seller financing, or rate buy-down credit?
- Why hasn't it sold? Are there any deal-killer items the seller is aware of (foundation, flood, title, zoning, code violations)?
- Is there a deadline driving the sale (1031 exchange, divorce, estate, relocation)? That informs how much negotiation room exists.
- Schools are F-rated, which usually means shorter tenancies and higher turnover. Who's the typical renter profile here, and what's been the actual vacancy rate?
- What's the average days-on-market for RENTAL listings here right now (not sales)? A rising rental-DOM trend means longer vacancies and softer asking-rent achievability than the comps imply.
- What's the recent tenant-quality profile in this submarket — average credit score on applications, eviction rate, late-payment / NSF rate, and stable-employment percentage? A property-management company in the area should have these aggregated.
- How much new for-sale + rental construction is in the pipeline within 1–3 miles? Heavy new supply typically softens prices + rents 12–24 months out; constrained supply supports both.
Investment metrics
- 1% rule
- 2.41% ✓
- Cap rate
- 22.02%
- Cash-on-cash
- 56.15%
- DSCR
- 3.50
- GRM
- 3.5
CMA / ARV
No comps found within radius.
Projected returns pro-forma
-3.0% appreciation · 4.07% rent growth · sell at horizon
- IRR
- 55.7%
- Equity multiple
- 3.49×
- Total profit
- $48,543
- Equity at exit
- $10,363
- IRR
- 61.0%
- Equity multiple
- 7.40×
- Total profit
- $124,541
- Equity at exit
- $6,009
Cash invested: $19,460 (down + closing). Projections, not guarantees.
Landlord ↔ Tenant lean methodology
- Overall (STATE)
- 18 Strongly Tenant-Friendly
- State California
- 18 Strongly Tenant-Friendly · D+13
- County
- — inherits STATE
- City
- — inherits STATE
ZIP-level market 93257
- Rents YoY
- 4.1%
- Active inventory
- 320
- Price-to-rent
- 3.5×
Monthly cashflow live
- Estimated rent
- $1,677 medium interval (Pro) →
- Mortgage (P&I)
- −$364
- Tax from tax record
- −$21 /mo · $254/yr
- Insurance
- −$29
- HOA
- −$0
- Vacancy / Maint / Mgmt
- −$352
- Net cashflow
- $911
Break-even live
UW: 25.0% down · 7.5% · 30yr · 1.5% tax · 5.0% vac · 8.0% maint · 8.0% mgmt
Financing live
Cash to close
- Down payment
- $17,375
- Closing costs
- $2,085
- Reserves months
- —
- Total cash needed
- —
Loan-product check · same deal, 3 products live
Conventional
25% down · 7.5% · 30yr
- Down + closing
- —
- Monthly P&I
- —
- Monthly cashflow
- —
- DSCR
- —
- Eligible?
- —
Personal DTI + credit; lowest rate.
DSCR
20% down · 8.5% · 30yr
- Down + closing
- —
- Monthly P&I
- —
- Monthly cashflow
- —
- DSCR
- —
- Eligible?
- —
No personal income docs; deal must DSCR.
Hard money
10% down · 12.0% · 12mo
- Down + closing
- —
- Monthly P&I
- —
- Monthly cashflow
- —
- DSCR
- —
- Eligible?
- —
Short-term bridge; refi at stabilization.
Rent comps 1 comps
| Address | Beds | Baths | Sqft | Rent | $/sqft | DOM | Units | Dist |
|---|---|---|---|---|---|---|---|---|
| 1711 W Henderson Ave Porterville, CA | 1.0–2.0 | 1.0–2.0 | 889 | $1,700 | $1.91 | 13d | 1 | 1.27mi |
Listing history 34 events
-
2026-06-05statusdays on market $69,500 Pending 143 DOM
-
2026-06-03days on market $69,500 Active 142 DOM
-
2026-06-02days on market $69,500 Active 141 DOM
-
2026-06-01days on market $69,500 Active 140 DOM
-
2026-05-31days on market $69,500 Active 139 DOM
-
2026-05-30days on market $69,500 Active 138 DOM
-
2026-02-06price $69,500
-
2026-01-12$72,000 Active
-
2024-11-19price $89,900
-
2024-09-24$99,900 Active
-
2024-07-17price $99,900
-
2024-06-20price $105,900
-
2024-06-04price $114,900
-
2024-04-25price $115,000
-
2024-04-20price $119,000
-
2024-03-30price $120,000
-
2024-03-10$130,000 Active
-
2024-01-25soldstatus $69,000 Closed
-
2023-11-21status Pending
-
2023-11-03$75,000 Active
-
2023-08-25status Pending
-
2023-08-08historical
-
2023-04-12status Pending
-
2023-01-31status Active
-
2023-01-05status Pending
-
2022-11-14status Active
-
2022-11-10status Pending
-
2022-10-06status Active
-
2022-09-16status Pending
-
2022-08-11status Active
-
2022-08-10status Pending
-
2022-07-05status Active
-
2022-04-13historical
-
2022-03-27$75,000
ⓘ Source: listings_history table (triggers on properties + properties_extension) + one-shot
backfill from property_details.listing_events for pre-trigger history.
Tax reassessment forecast CA · Resets to sale price
- Current annual tax
- $254 · $21/mo
- Projected year-2 tax
- $528 · $44/mo
- Expected delta
- +$275/yr (+$23/mo · 108.2%)
ⓘ Screening estimate from a state-policy table — verify with the county assessor before closing.
Climate risk First Street
- Flood 5/10 Major FEMA zone X (shaded) · 24% chance over 30 yrs
- Wildfire 7/10 Severe
- Heat 8/10 Severe 7 d/yr ≥105°F today · 17 d/yr by 30 yrs out
- Wind 1/10 Low
- Air quality 10/10 Extreme 33 unhealthy d/yr today · 37 by 30 yrs out
Nearby sold comps map
Loading sold comps map…
Walkable amenities ~0.75 mi
Loading nearby amenities…
Taxation est. · year 1
- Rental income
- $20,129
- − Mortgage interest
- −$3,893
- − Property taxes
- −$254
- − Insurance
- −$348
- − Repairs & maintenance
- −$1,610
- − Management
- −$1,610
- − Depreciation
- −$2,022
- Taxable income
- $10,392
- Est. tax owed @ 24.0%
- −$2,494
- After-tax cash flow
- $8,433/yr
For passive investors: Depreciation is non-cash, so a rental often shows a tax loss while cash-flowing — sheltering income. Rental losses are passive: they offset passive income freely, and up to $25,000/yr can offset ordinary (W-2) income if you actively participate and your MAGI is under $100k (phasing out to $0 by $150k); unused losses carry forward. On sale, claimed depreciation is recaptured at up to 25%, and gains may owe capital-gains tax (a 1031 exchange can defer both). Figures are a year-1 estimate at your 24.0% rate — not tax advice; consult a CPA.
Schools (NCES district)
- District
- Burton Elementary
- NCES district ID
- 0606570
- Math proficiency
- 31% ▲ 4.00%
- Reading proficiency
- 42% ▲ 3.00%
- Median HH income
- $57,171
- Composite
- 34.83/100
- National rank
- #10012
- State rank
- #805 of 1400 in CA
Livability — Porterville
- Score
- 60/100
- State rank
- #561
- US rank
- #18537
Category grades
Schools grade is shown separately in the Schools card above.
Census & demographics
- Census place
- Porterville, CA
- County
- Tulare County · 323,826 people
- City population
- 80,467
- Metro
- Visalia, CA
- Population (ZIP)
- 80,467
- Household income
- $59,704
- Rent vs Own
- Severe rent burden
- 3028.0
Population outlook (Tulare County) Hauer SSP2
- Today (2025)
- 484,681 people
- By 2030
- 496,241 · +2.4%
- By 2040
- 518,507 · +7.0%
- By 2050
- 534,920 · +10.4%
- By 2075
- 548,417 · +13.2%
- By 2100
- 513,085 · +5.9%
Race, ethnicity, and origin ACS 2023
- Neighborhood character
- Predominantly Hispanic (72%)
- Race & ethnicity
- Hispanic / Latino 72% Two or more races 23% White 21% Native American 3% Asian 2%
- Hispanic origin (detail)
- Mexican 69%
- Common ancestry
- Iranian 1%
- Foreign-born
- 26% · Canada
- Languages at home
- 45% English-only · Spanish 52% Tagalog/Filipino 1% Arabic 1%
Political lean MEDSL · Tulare
- 2024 margin
- Strong R (+20.7) · D 38.5% · R 59.2% · Other 2.3%
- 2008→2024 swing
- -5.4pp toward R · 2008: -15.3pp · 2024: -20.7pp
- All cycles
- 2024: R+20.7 2020: R+7.8 2016: R+12.1 2012: R+17.8 2008: R+15.3
Not yet ingested
- Civics
- —
Market trends
- HPI YoY
- ▼ -375.52%
- Current HPI
- 362.656
- Rent YoY
- ▲ 4.07%
- Metro
- Visalia, CA
- State GDP YoY
- ▲ 3.21%
- F500 in state
- 116
Industry mix (Fortune 500 HQ in CA)
| Industry | F500 HQs | Revenue |
|---|---|---|
| Technology | 27 | $1,492B |
|
||
| Financial Services | 3 | $174B |
|
||
| Retail | 3 | $44B |
|
||
| Insurance | 3 | $26B |
|
||
| Media / Entertainment | 2 | $115B |
|
||
| Pharmaceuticals / Biotech | 2 | $62B |
|
||
Price history
-7.3% since first listed28 events — show timeline
- 2026-02-06 Price Changed $69,500 TCMLS
- 2026-01-12 Listed $72,000 TCMLS
- 2024-11-19 Price Changed $89,900 TCMLS
- 2024-09-24 Listed $99,900 TCMLS
- 2024-07-17 Price Changed $99,900 TCMLS
- 2024-06-20 Price Changed $105,900 TCMLS
- 2024-06-04 Price Changed $114,900 TCMLS
- 2024-04-25 Price Changed $115,000 TCMLS
- 2024-04-20 Price Changed $119,000 TCMLS
- 2024-03-30 Price Changed $120,000 TCMLS
- 2024-03-10 Listed $130,000 TCMLS
- 2024-01-25 Sold (MLS) $69,000 TCMLS
- 2023-11-21 Pending — TCMLS
- 2023-11-03 Listed $75,000 TCMLS
- 2023-08-25 Pending — TCMLS
- 2023-08-08 Delisted — TCMLS
- 2023-04-12 Pending — TCMLS
- 2023-01-31 Relisted — TCMLS
- 2023-01-05 Pending — TCMLS
- 2022-11-14 Relisted — TCMLS
- 2022-11-10 Pending — TCMLS
- 2022-10-06 Relisted — TCMLS
- 2022-09-16 Pending — TCMLS
- 2022-08-11 Relisted — TCMLS
- 2022-08-10 Pending — TCMLS
- 2022-07-05 Relisted — TCMLS
- 2022-04-13 Delisted — TCMLS
- 2022-03-27 Listed $75,000 TCMLS
Property tax history
-1.0%/yrLatest (2021): $254 · -0.5% YoY. Source: county tax records.
Cash-flow waterfall
monthlySold comps — $/sqft
last 12 mo · ≤1 miLoading sold comps…