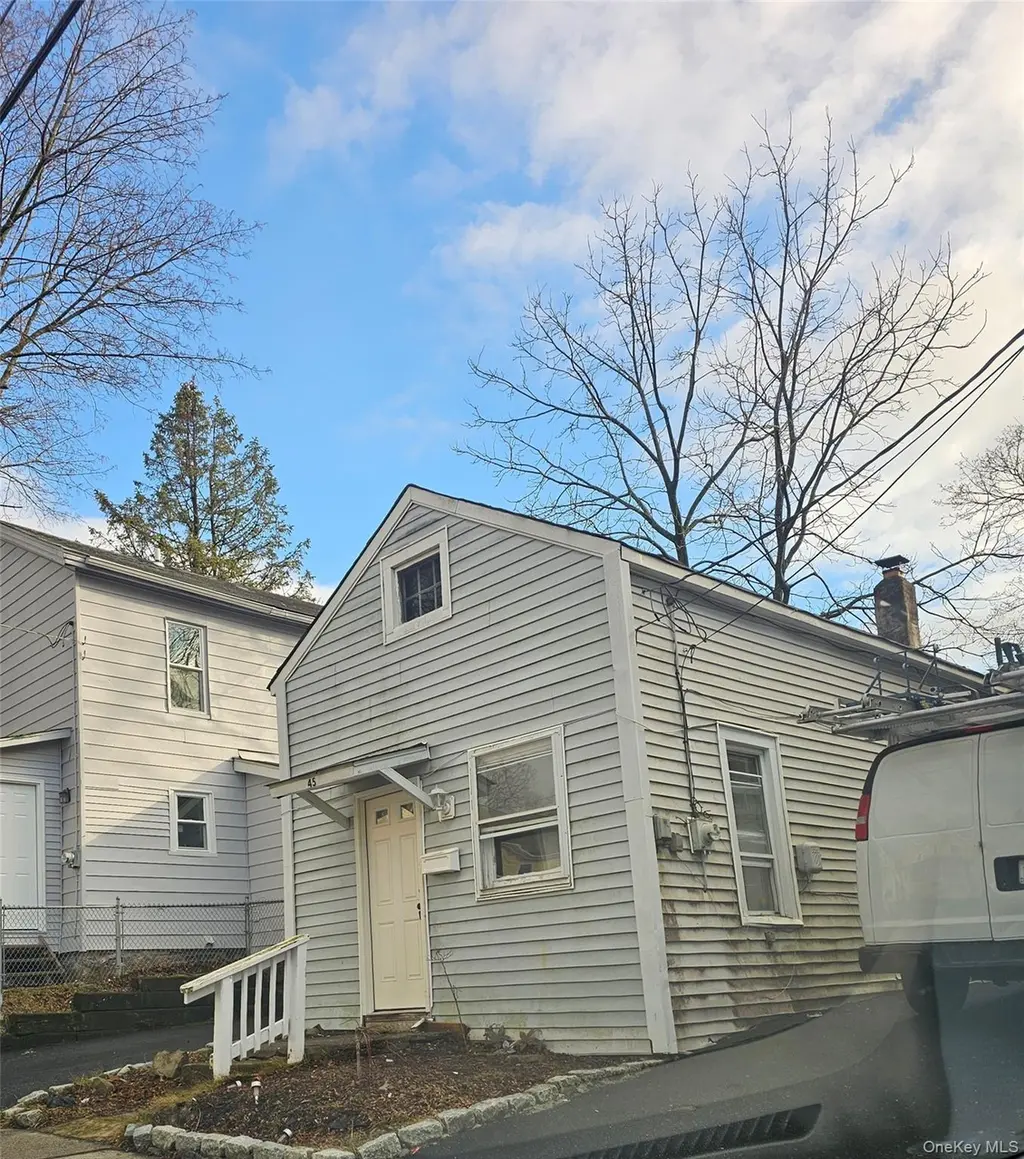
45 Knapp Ave · Middletown, NY
Flood risk 1/10 · Minimal
- FEMA flood zone
- X (unshaded)
- Chance of flooding over 30 yrs
- 0.0%
- Est. flood insurance / yr
- $473 – $860
Fire risk 3/10 · Minor
- Est. fire insurance / yr
- $691 – $1,283
Heat risk 4/10 · Minor
- Hot days now (above 100°F)
- 7 days/yr
- Hot days in 30 yrs
- 15 days/yr
Wind risk 4/10 · Minor
- Chance of severe wind over 30 yrs
- 10.0%
Air-quality risk 2/10 · Minimal
- Unhealthy air days now
- 1 days/yr
- Unhealthy air days in 30 yrs
- 2 days/yr
Risk factors via First Street. Map © Google.
Why this score? — see what drove the B- grade
The composite is a weighted blend of 9 inputs, each scored 0–100. Each bar is that input's sub-score; the figure is the points it added to the 100-point composite (weight × sub-score).
- Cash flow +28.2/30.0
- DSCR +10.0/10.0
- 1% rule +7.6/10.0
- ARV discount +7.5/15.0
- Rent growth +4.6/5.0
- Schools +4.2/10.0
- Livability +4.1/5.0
- Condition / age +2.5/5.0
- Appreciation +0.0/10.0
$155,000
🖨 Deal sheet 📄 Offer letter ✓ Due diligence
Listing remarks MLS
Attention investors! This is a true “what you see is what you get” opportunity. Bring your tools and imagination and transform this property into a valuable addition to your rental portfolio. Perfect for investors seeking potential and long-term returns. Cash buyer or rehab loan needed.
Key facts
- 3,000 sq ft lot
- Built 1903
- Listed 83 days
Neighborhood map
What this means for you Summary
Snapshot
- This is a 1-bed/1.5-bath single-family listed at $155k.
Deal economics
- At list price, monthly cash flow is $492 ($6k/yr) — positive.
- The deal already cash-flows at list — no discount required.
- Meets the 1% rule at list price ($2k rent vs $155k).
- Recommended offer: $146k (6.0% below list) — sets the bar for market timing.
- Cap rate 10.1% vs local median 3.3% in Middletown — top-decile yield for the area; either an underpriced asset or a hidden risk that comps aren't pricing in. Stress-test before assuming the spread holds.
Location & tenants
- Location reads 82/100 on livability (#79 in NY, #1,219 nationally) — a professional / high-income tenant draw. Strengths: amenities A+, housing A+, health & safety A+; Watch: commute C-, schools D+.
- Middletown City School District (suburban): math 41% / reading 55% proficiency, ranked #411 of 590 in NY (top 70%) — families likely to look elsewhere, expect single-tenant / working-renter base with shorter leases; 61% free/reduced lunch — lower-income household profile, screen leases tightly.
- Market conditions: Rents rising fast (+8.2%/yr); 273 active listings in the ZIP; 21 comparable units currently listed for rent nearby; rentals lingering (median 44d on market — plan ~5-8 weeks vacancy on turnover, expect pricing pressure); 67% of comp listings sitting > 30 days — soft ceiling on asking rent; solid renter incomes; 1,746 units permitted in Orange County in 2024 (1,265 in 5+ unit buildings).
Forward outlook
- Local home prices are declining (-3.0%/yr); year-one equity from $1k of loan paydown is wiped out by about $5k of value loss. Plan a longer hold.
- At projected returns (-3.0% appreciation + 8.0% rent growth), your $43k cash investment doubles in ~7 years — after that, you're playing with house money.
Negotiation context
- It's been on market 83 days — a 6% lower offer ($146k) is reasonable based on typical stale-listing flexibility.
- 2 sale attempts since 22y ago; this cycle's ask has dropped $20k (11%) from the opening price — seller is motivated, your offer sets the floor, not the list.
- Current owner paid $96k; list at $155k implies a 62% gain — meaningful room to come down on a strong offer.
Risks & watch-outs
- Watch-outs: built in 1903 — expect roof / HVAC / electrical / plumbing capex.
Questions for the listing agent
- It's been on market 83 days. Have you received any prior offers? Is the seller open to a 6% concession, seller financing, or rate buy-down credit?
- Built in 1903 — when were the roof, HVAC, electrical panel, plumbing, and water heater last replaced?
- Why hasn't it sold? Are there any deal-killer items the seller is aware of (foundation, flood, title, zoning, code violations)?
- Is there a deadline driving the sale (1031 exchange, divorce, estate, relocation)? That informs how much negotiation room exists.
- Schools are D-rated, which usually means shorter tenancies and higher turnover. Who's the typical renter profile here, and what's been the actual vacancy rate?
- What's the average days-on-market for RENTAL listings here right now (not sales)? A rising rental-DOM trend means longer vacancies and softer asking-rent achievability than the comps imply.
- What's the recent tenant-quality profile in this submarket — average credit score on applications, eviction rate, late-payment / NSF rate, and stable-employment percentage? A property-management company in the area should have these aggregated.
- How much new for-sale + rental construction is in the pipeline within 1–3 miles? Heavy new supply typically softens prices + rents 12–24 months out; constrained supply supports both.
Investment metrics
- 1% rule
- 1.26% ✓
- Cap rate
- 10.10%
- Cash-on-cash
- 13.60%
- DSCR
- 1.61
- GRM
- 6.6
CMA / ARV
- ARV (median comp)
- $325,343
- List price
- $155,000
- Delta
- -52.36%
- Verdict
- UNDERPRICED
- Comps
- 20 within 1.0 mi
Show comp detail 6 sales within ~0.75 mi
| Address | Dist | Beds/Ba | Sqft | Sold | Price | $/sf | Match |
|---|---|---|---|---|---|---|---|
| 58 Wawayanda Ave | 0.68mi | 2/1.0 (+1) | 820 (+5%) | 2mo | $220,000 | $268 | 52 |
| 22 Woodland Ave | 0.52mi | 2/1.0 (+1) | 840 (+7%) | 19mo | $332,000 | $395 | 41 |
| 224 Monhagen Ave | 0.64mi | 2/1.0 (+1) | 839 (+7%) | 19mo | $300,000 | $358 | 36 |
| 15 Mercer St | 0.65mi | 2/1.0 (+1) | 840 (+7%) | 22mo | $340,000 | $405 | 32 |
| 12 Wilbur Ave | 0.74mi | 2/1.0 (+1) | 880 (+12%) | 16mo | $269,000 | $306 | 24 |
| 69 Watkins Ave | 0.72mi | 1/1.0 | 672 (-14%) | 20mo | $250,500 | $373 | 23 |
Match score weights: distance 35% · size 25% · config 20% · recency 20%. Top-matched comps best support the ARV.
Projected returns pro-forma
-3.0% appreciation · 8.0% rent growth · sell at horizon
- IRR
- 9.2%
- Equity multiple
- 1.38×
- Total profit
- $16,528
- Equity at exit
- $23,111
- IRR
- 22.1%
- Equity multiple
- 3.34×
- Total profit
- $101,696
- Equity at exit
- $13,402
Cash invested: $43,400 (down + closing). Projections, not guarantees.
Landlord ↔ Tenant lean methodology
- Overall (STATE)
- 15 Strongly Tenant-Friendly
- State New York
- 15 Strongly Tenant-Friendly · D+10
- County
- — inherits STATE
- City
- — inherits STATE
ZIP-level market 10940
- Home prices YoY
- -18.7%
- Rents YoY
- 8.2%
- Active inventory
- 273
- Price-to-rent
- 6.6×
Monthly cashflow live
- Estimated rent
- $1,950 high interval (Pro) →
- Mortgage (P&I)
- −$813
- Tax from tax record
- −$171 /mo · $2,056/yr
- Insurance
- −$65
- HOA
- −$0
- Vacancy / Maint / Mgmt
- −$410
- Net cashflow
- $492
Break-even live
UW: 25.0% down · 7.5% · 30yr · 1.5% tax · 5.0% vac · 8.0% maint · 8.0% mgmt
Financing live
Cash to close
- Down payment
- $38,750
- Closing costs
- $4,650
- Reserves months
- —
- Total cash needed
- —
Loan-product check · same deal, 3 products live
Conventional
25% down · 7.5% · 30yr
- Down + closing
- —
- Monthly P&I
- —
- Monthly cashflow
- —
- DSCR
- —
- Eligible?
- —
Personal DTI + credit; lowest rate.
DSCR
20% down · 8.5% · 30yr
- Down + closing
- —
- Monthly P&I
- —
- Monthly cashflow
- —
- DSCR
- —
- Eligible?
- —
No personal income docs; deal must DSCR.
Hard money
10% down · 12.0% · 12mo
- Down + closing
- —
- Monthly P&I
- —
- Monthly cashflow
- —
- DSCR
- —
- Eligible?
- —
Short-term bridge; refi at stabilization.
Rent comps 21 comps
| Address | Beds | Baths | Sqft | Rent | $/sqft | DOM | Units | Dist |
|---|---|---|---|---|---|---|---|---|
| 11 Knapp Ave Apt 2 Middletown, NY | 2.0 | 1.0 | 950 | $2,500 | $2.63 | 43d | 1 | 0.17mi |
| 31 Liberty St Middletown, NY | 2.0 | 1.0 | 1090 | $2,000 | $1.83 | 13d | 1 | 0.17mi |
| 44 John St Unit 3 Middletown, NY | 1.0 | 1.0 | 650 | $1,500 | $2.31 | 43d | 1 | 0.37mi |
| 203 W Main St Unit 2 Middletown, NY | 2.0 | 1.0 | 784 | $1,700 | $2.17 | 43d | 1 | 0.37mi |
| 23 W Main St Unit 1 Middletown, NY | 1.0 | 1.0 | 770 | $1,900 | $2.47 | 43d | 1 | 0.55mi |
| 77 Linden Ave Middletown, NY | 1.0 | 1.0 | 742 | $1,675 | $2.26 | 43d | 1 | 0.55mi |
| 10 W Main St Unit 1 Middletown, NY | — | 1.0 | 1000 | $1,750 | $1.75 | 43d | 1 | 0.58mi |
| 2 E Main St Unit 4 Middletown, NY | 1.0 | 1.0 | 1000 | $1,650 | $1.65 | 43d | 1 | 0.60mi |
| 30 E Main St Unit 4 Middletown, NY | 1.0 | 1.0 | 600 | $1,500 | $2.50 | 43d | 1 | 0.62mi |
| 151 Tall Oaks Dr Middletown, NY | 1.0–3.0 | 1.0 | 920 | $962 | $1.05 | 13d | 1 | 0.64mi |
| 17 Academy Ave Unit 2 Middletown, NY | 2.0 | 1.0 | 750 | $1,850 | $2.47 | 43d | 1 | 0.76mi |
| 102 Wawayanda Ave Unit 1 Middletown, NY | 2.0 | 1.0 | 750 | $1,950 | $2.60 | 43d | 1 | 0.82mi |
| 38 Richmond Pl Unit 1B Middletown, NY | 2.0 | 1.0 | 950 | $2,400 | $2.53 | 13d | 1 | 0.85mi |
| 90 Montgomery St Unit Upper Middletown, NY | 2.0 | 1.0 | 900 | $2,400 | $2.67 | 23d | 1 | 0.87mi |
| 31 Beattie Ave #2 Middletown, NY | 2.0 | 1.0 | 718 | $2,000 | $2.79 | 43d | 1 | 0.90mi |
| 22 Sunnyside Ave Middletown, NY | 2.0 | 1.0 | 928 | $1,800 | $1.94 | 43d | 1 | 1.17mi |
| 1 Ruth Ct Middletown, NY | 2.0 | 1.0 | 984 | $2,200 | $2.24 | 23d | 1 | 1.31mi |
| 32 Palmer Ave Unit 5 Middletown, NY | 2.0 | 1.0 | 1100 | $2,000 | $1.82 | 43d | 1 | 1.32mi |
| 139 Ruth Ct Middletown, NY | 2.0 | 2.0 | 880 | $2,000 | $2.27 | 23d | 1 | 1.35mi |
| 260 Ruth Ct Middletown, NY | 2.0 | 2.0 | 900 | $2,025 | $2.25 | 23d | 1 | 1.44mi |
| 268 Ruth Ct Middletown, NY | 2.0 | 2.0 | 1125 | $2,375 | $2.11 | 43d | 1 | 1.47mi |
Listing history 24 events
-
2026-06-18days on market $155,000 Active 83 DOM
-
2026-06-17days on market $155,000 Active 82 DOM
-
2026-06-16days on market $155,000 Active 81 DOM
-
2026-06-15days on market $155,000 Active 80 DOM
-
2026-06-14days on market $155,000 Active 78 DOM
-
2026-06-13days on market $155,000 Active 77 DOM
-
2026-06-10days on market $155,000 Active 75 DOM
-
2026-06-09days on market $155,000 Active 74 DOM
-
2026-06-08days on market $155,000 Active 73 DOM
-
2026-06-07days on market $155,000 Active 72 DOM
-
2026-06-05days on market $155,000 Active 69 DOM
-
2026-06-03days on market $155,000 Active 68 DOM
-
2026-06-02days on market $155,000 Active 67 DOM
-
2026-06-01days on market $155,000 Active 66 DOM
-
2026-05-31days on market $155,000 Active 65 DOM
-
2026-05-30days on market $155,000 Active 64 DOM
-
2026-04-30price $155,000 299-char remark
Show marketing remark (299 chars)
Attention investors! This is a true “what you see is what you get” opportunity. Bring your tools and imagination and transform this property into a valuable addition to your rental portfolio. Perfect for investors seeking potential and long-term returns. Cash buyer or rehab loan needed.
-
2026-03-27$175,000 Active 299-char remark
Show marketing remark (299 chars)
Attention investors! This is a true “what you see is what you get” opportunity. Bring your tools and imagination and transform this property into a valuable addition to your rental portfolio. Perfect for investors seeking potential and long-term returns. Cash buyer or rehab loan needed.
-
2018-03-29soldstatus $95,500
-
2004-11-02soldstatus $155,000 388-char remark
Show marketing remark (388 chars)
Great investment property! Two family will seperate fernaces, hot water heaters and electric meters. Tenants pay all expences. There is a bedroom and bathroom in basement for extra room. Property has nice back yard for children. There currently month-to-month leases with the tennants. Rent for downstairs apartment will be raised to $750 in August. Great location! Property sold 'AS IS'
-
2004-07-23historical 388-char remark
Show marketing remark (388 chars)
Great investment property! Two family will seperate fernaces, hot water heaters and electric meters. Tenants pay all expences. There is a bedroom and bathroom in basement for extra room. Property has nice back yard for children. There currently month-to-month leases with the tennants. Rent for downstairs apartment will be raised to $750 in August. Great location! Property sold 'AS IS'
-
2004-06-14$155,000 388-char remark
Show marketing remark (388 chars)
Great investment property! Two family will seperate fernaces, hot water heaters and electric meters. Tenants pay all expences. There is a bedroom and bathroom in basement for extra room. Property has nice back yard for children. There currently month-to-month leases with the tennants. Rent for downstairs apartment will be raised to $750 in August. Great location! Property sold 'AS IS'
-
1991-08-02soldstatus $24,000
-
1987-09-24soldstatus $20,000
ⓘ Source: listings_history table (triggers on properties + properties_extension) + one-shot
backfill from property_details.listing_events for pre-trigger history.
Tax reassessment forecast NY · Partial reset (capped growth)
- Current annual tax
- $2,056 · $171/mo
- Projected year-2 tax
- $2,338 · $195/mo
- Expected delta
- +$282/yr (+$23/mo · 13.7%)
ⓘ Screening estimate from a state-policy table — verify with the county assessor before closing.
Climate risk First Street
- Flood 1/10 Low FEMA zone X (unshaded) · 0% chance over 30 yrs
- Wildfire 3/10 Moderate
- Heat 4/10 Moderate 7 d/yr ≥100°F today · 15 d/yr by 30 yrs out
- Wind 4/10 Moderate 10% chance of damaging wind over 30 yrs
- Air quality 2/10 Low 1 unhealthy d/yr today · 2 by 30 yrs out
Nearby sold comps map
Loading sold comps map…
Walkable amenities ~0.75 mi
Loading nearby amenities…
Taxation est. · year 1
- Rental income
- $23,401
- − Mortgage interest
- −$8,682
- − Property taxes
- −$2,056
- − Insurance
- −$775
- − Repairs & maintenance
- −$1,872
- − Management
- −$1,872
- − Depreciation
- −$4,509
- Taxable income
- $3,634
- Est. tax owed @ 24.0%
- −$872
- After-tax cash flow
- $5,030/yr
For passive investors: Depreciation is non-cash, so a rental often shows a tax loss while cash-flowing — sheltering income. Rental losses are passive: they offset passive income freely, and up to $25,000/yr can offset ordinary (W-2) income if you actively participate and your MAGI is under $100k (phasing out to $0 by $150k); unused losses carry forward. On sale, claimed depreciation is recaptured at up to 25%, and gains may owe capital-gains tax (a 1031 exchange can defer both). Figures are a year-1 estimate at your 24.0% rate — not tax advice; consult a CPA.
Schools (NCES district)
- District
- Middletown City School District
- NCES district ID
- 3619320
- Math proficiency
- 41% ▼ -2.00%
- Reading proficiency
- 55% ▲ 19.00%
- Median HH income
- $54,612
- Composite
- 41.52/100
- National rank
- #3453
- State rank
- #411 of 590 in NY
Livability — Middletown
- Score
- 82/100
- State rank
- #79
- US rank
- #1219
Category grades
Schools grade is shown separately in the Schools card above.
Census & demographics
- Census place
- Middletown, NY
- County
- Orange County · 267,004 people
- City population
- 68,033
- Metro
- Poughkeepsie-Newburgh-Middletown, NY
- Population (ZIP)
- 53,611
- Household income
- $87,080
- Rent vs Own
- Severe rent burden
- 1846.0
Population outlook (Orange County) Hauer SSP2
- Today (2025)
- 379,830 people
- By 2030
- 378,955 · -0.2%
- By 2040
- 375,444 · -1.2%
- By 2050
- 369,311 · -2.8%
- By 2075
- 354,233 · -6.7%
- By 2100
- 318,150 · -16.2%
Race, ethnicity, and origin ACS 2023
- Neighborhood character
- Highly diverse neighborhood (Simpson 0.70)
- Race & ethnicity
- White 39% Hispanic / Latino 32% Black 20% Two or more races 13% Asian 4% Native American 3%
- Hispanic origin (detail)
- Mexican 9% Puerto Rican 13% Dominican 3%
- Common ancestry
- Romanian 3% Italian 1% Iranian 1%
- Foreign-born
- 18% · Canada, China, Jamaica
- Languages at home
- 72% English-only · Spanish 21% Other Indo-European 2% Chinese 1%
Political lean MEDSL · Orange
- 2024 margin
- Lean R (+8.4) · D 45.8% · R 54.2%
- 2008→2024 swing
- -12.5pp toward R · 2008: 4.1pp · 2024: -8.4pp
- All cycles
- 2024: R+8.4 2020: R+0.2 2016: R+6.5 2012: D+5.2 2008: D+4.1
Not yet ingested
- Civics
- —
Market trends
- HPI YoY
- ▼ -71.68%
- Current HPI
- 311.5969
- Rent YoY
- ▲ 8.23%
- Metro
- Poughkeepsie-Newburgh-Middletown, NY
- State GDP YoY
- ▲ 2.60%
- F500 in state
- 92
Industry mix (Fortune 500 HQ in NY)
| Industry | F500 HQs | Revenue |
|---|---|---|
| Financial Services | 10 | $950B |
|
||
| Consumer Goods | 9 | $162B |
|
||
| Insurance | 4 | $225B |
|
||
| Telecommunications | 2 | $144B |
|
||
| Pharmaceuticals | 2 | $112B |
|
||
| Media / Entertainment | 2 | $69B |
|
||
Price history
+675.0% since first listed8 events — show timeline
- 2026-04-30 Price Changed $155,000 OneKey® MLS as Distributed by MLS Grid
- 2026-03-27 Listed $175,000 OneKey® MLS as Distributed by MLS Grid
- 2018-03-29 Sold (Public Records) $95,500 Public Records
- 2004-11-02 Sold (MLS) $155,000 HGMLS
- 2004-07-23 Delisted — HGMLS
- 2004-06-14 Listed $155,000 HGMLS
- 1991-08-02 Sold (Public Records) $24,000 Public Records
- 1987-09-24 Sold (Public Records) $20,000 Public Records
Property tax history
+0.9%/yrLatest (2025): $2,056 · -1.0% YoY. Source: county tax records.
Cash-flow waterfall
monthlySold comps — $/sqft
last 12 mo · ≤1 miLoading sold comps…