9861 N 490 E · Roselawn, IN
Flood risk 1/10 · Minimal
- FEMA flood zone
- X (unshaded)
- Chance of flooding over 30 yrs
- 0.0%
- Est. flood insurance / yr
- $507 – $1,088
Fire risk 1/10 · Minimal
- Est. fire insurance / yr
- $717 – $1,331
Heat risk 2/10 · Minimal
- Hot days now (above 101°F)
- 7 days/yr
- Hot days in 30 yrs
- 16 days/yr
Wind risk 2/10 · Minimal
- Chance of severe wind over 30 yrs
- 0.0%
Air-quality risk 3/10 · Minor
- Unhealthy air days now
- 2 days/yr
- Unhealthy air days in 30 yrs
- 3 days/yr
Risk factors via First Street. Map © Google.
Why this score? — see what drove the D+ grade
The composite is a weighted blend of 9 inputs, each scored 0–100. Each bar is that input's sub-score; the figure is the points it added to the 100-point composite (weight × sub-score).
- Cash flow +15.4/30.0
- ARV discount +15.0/15.0
- DSCR +4.7/10.0
- 1% rule +3.5/10.0
- Livability +3.2/5.0
- Schools +2.9/10.0
- Rent growth +2.5/5.0
- Condition / age +2.5/5.0
- Appreciation +0.0/10.0
$140,000
🖨 Deal sheet 📄 Offer letter ✓ Due diligence
Listing remarks MLS
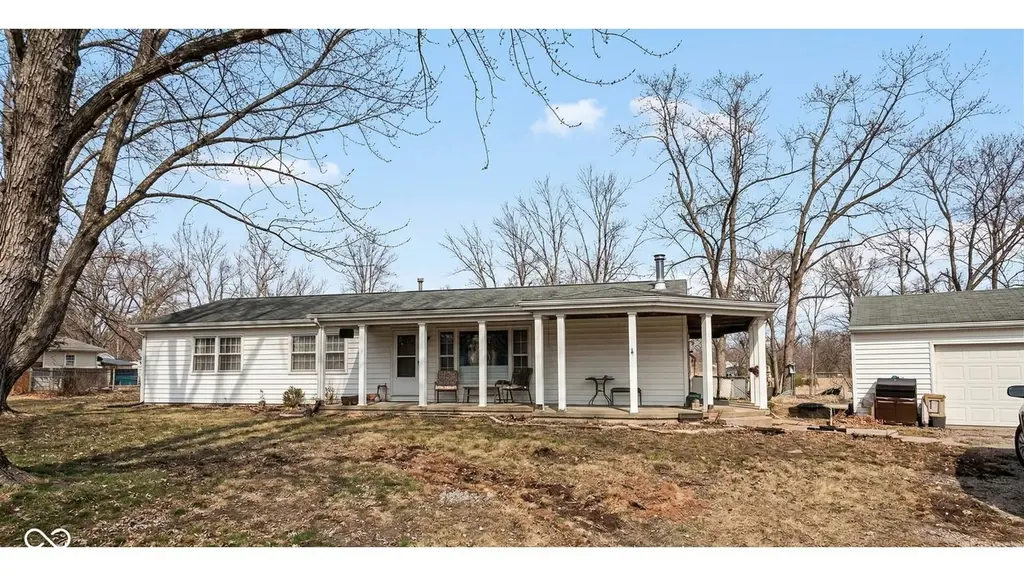
3-bedroom, 1.5-bathroom single-family home built in 1972 offering approximately 1,248 square feet, situated on a spacious 0.57-acre lot. The property features a functional layout with central heating and air conditioning, along with a detached garage for additional storage or parking. The large lot provides plenty of outdoor space with mature trees and room for expansion or improvements. The home is currently occupied and offers an opportunity for updates and value-add improvements.
Key facts
- 0.57 acre lot
- 2 garage spots
- Built 1972
Neighborhood map
What this means for you Summary
Snapshot
- This is a 3-bed/1.5-bath single-family listed at $140k.
Deal economics
- At list price, monthly cash flow is $54 ($648/yr) — positive.
- The deal already cash-flows at list — no discount required.
- To meet the 1% rule (rent ≥ 1% of price), the offer needs to be $119k (15.2% below list).
- Recommended offer: $119k (15.2% below list) — sets the bar for 1% rule.
Location & tenants
- Location reads 65/100 on livability (#324 in IN) — a middle-class / working-renter tenant base. Strengths: crime A+, cost of living A+, housing A+; Watch: schools F, amenities F, commute F.
- North Newton School Corporation (rural): math 28% / reading 38% proficiency, ranked #205 of 301 in IN (top 68%) — families likely to look elsewhere, expect single-tenant / working-renter base with shorter leases.
- Market conditions: 98 active listings in the ZIP; 24 units permitted in Newton County in 2024 (0 in 5+ unit buildings).
Forward outlook
- Local home prices are declining (-3.0%/yr); year-one equity from $968 of loan paydown is wiped out by about $4k of value loss. Plan a longer hold.
- Newton County population projected at -12% by 2050 — secular population decline; favor cash flow + early exit over multi-decade hold.
Negotiation context
- It's been on market 61 days — a 6% lower offer ($132k) is reasonable based on typical stale-listing flexibility.
- 3 sale attempts since 24y ago with the ask held roughly flat each time — persistent listings suggest the price (not the market) is what's stuck; bring a comps-based counter.
Questions for the listing agent
- It's been on market 61 days. Have you received any prior offers? Is the seller open to a 15% concession, seller financing, or rate buy-down credit?
- Built in 1972 — when were the roof, HVAC, electrical panel, plumbing, and water heater last replaced?
- Why hasn't it sold? Are there any deal-killer items the seller is aware of (foundation, flood, title, zoning, code violations)?
- Is there a deadline driving the sale (1031 exchange, divorce, estate, relocation)? That informs how much negotiation room exists.
- Schools are F-rated, which usually means shorter tenancies and higher turnover. Who's the typical renter profile here, and what's been the actual vacancy rate?
- The area grade is low — what's the realistic commute time and amenity access for the typical tenant pool here? Any planned neighborhood developments (good or bad) we should know about?
- What's the average days-on-market for RENTAL listings here right now (not sales)? A rising rental-DOM trend means longer vacancies and softer asking-rent achievability than the comps imply.
- What's the recent tenant-quality profile in this submarket — average credit score on applications, eviction rate, late-payment / NSF rate, and stable-employment percentage? A property-management company in the area should have these aggregated.
- How much new for-sale + rental construction is in the pipeline within 1–3 miles? Heavy new supply typically softens prices + rents 12–24 months out; constrained supply supports both.
Investment metrics
- 1% rule
- 0.85% ✗
- Cap rate
- 6.76%
- Cash-on-cash
- 1.65%
- DSCR
- 1.07
- GRM
- 9.8
CMA / ARV
- ARV (median comp)
- $193,198
- List price
- $140,000
- Delta
- -27.54%
- Verdict
- UNDERPRICED
- Comps
- 20 within 1.0 mi
Show comp detail 7 sales within ~0.75 mi
| Address | Dist | Beds/Ba | Sqft | Sold | Price | $/sf | Match |
|---|---|---|---|---|---|---|---|
| 4720 E 1040 N | 0.58mi | 3/1.5 | 1,232 (-1%) | 2mo | $245,000 | $199 | 70 |
| 4857 Concord Rd | 0.26mi | 3/1.5 | 1,225 (-2%) | 20mo | $165,000 | $135 | 69 |
| 4605 E 1010 N | 0.41mi | 3/1.0 | 1,304 (+4%) | 21mo | $231,000 | $177 | 54 |
| 10183 N 457 E | 0.48mi | 3/2.0 | 1,144 (-8%) | 14mo | $248,000 | $217 | 50 |
| 4827 E 1040 N | 0.51mi | 3/1.0 | 1,104 (-12%) | 6mo | $194,000 | $176 | 50 |
| 10342 N 486 E | 0.46mi | 3/1.0 | 1,104 (-12%) | 11mo | $259,500 | $235 | 48 |
| 4528 E 1047 N | 0.63mi | 3/1.0 | 1,120 (-10%) | 12mo | $230,000 | $205 | 42 |
Match score weights: distance 35% · size 25% · config 20% · recency 20%. Top-matched comps best support the ARV.
Projected returns pro-forma
-3.0% appreciation · 3.0% rent growth · sell at horizon
- IRR
- -13.7%
- Equity multiple
- 0.51×
- Total profit
- $-19,281
- Equity at exit
- $20,874
- IRR
- -4.9%
- Equity multiple
- 0.68×
- Total profit
- $-12,499
- Equity at exit
- $12,105
Cash invested: $39,200 (down + closing). Projections, not guarantees.
Landlord ↔ Tenant lean methodology
- Overall (STATE)
- 90 Strongly Landlord-Friendly
- State Indiana
- 90 Strongly Landlord-Friendly · R+11
- County
- — inherits STATE
- City
- — inherits STATE
ZIP-level market 46310
- Home prices YoY
- -20.0%
- Active inventory
- 98
- Price-to-rent
- 9.8×
Monthly cashflow live
- Estimated rent
- $1,187 medium interval (Pro) →
- Mortgage (P&I)
- −$734
- Tax from tax record
- −$91 /mo · $1,095/yr
- Insurance
- −$58
- HOA
- −$0
- Vacancy / Maint / Mgmt
- −$249
- Net cashflow
- $54
Break-even live
UW: 25.0% down · 7.5% · 30yr · 1.5% tax · 5.0% vac · 8.0% maint · 8.0% mgmt
Financing live
Cash to close
- Down payment
- $35,000
- Closing costs
- $4,200
- Reserves months
- —
- Total cash needed
- —
Loan-product check · same deal, 3 products live
Conventional
25% down · 7.5% · 30yr
- Down + closing
- —
- Monthly P&I
- —
- Monthly cashflow
- —
- DSCR
- —
- Eligible?
- —
Personal DTI + credit; lowest rate.
DSCR
20% down · 8.5% · 30yr
- Down + closing
- —
- Monthly P&I
- —
- Monthly cashflow
- —
- DSCR
- —
- Eligible?
- —
No personal income docs; deal must DSCR.
Hard money
10% down · 12.0% · 12mo
- Down + closing
- —
- Monthly P&I
- —
- Monthly cashflow
- —
- DSCR
- —
- Eligible?
- —
Short-term bridge; refi at stabilization.
Listing history 17 events
-
2026-06-09days on market $140,000 Active 61 DOM
-
2026-06-08days on market $140,000 Active 60 DOM
-
2026-06-07days on market $140,000 Active 59 DOM
-
2026-06-07days on market $140,000 Active 58 DOM
-
2026-06-04days on market $140,000 Active 55 DOM
-
2026-06-02days on market $140,000 Active 54 DOM
-
2026-06-01days on market $140,000 Active 53 DOM
-
2026-05-31days on market $140,000 Active 52 DOM
-
2026-05-31days on market $140,000 Active 51 DOM
-
2026-05-06price $150,000 493-char remark
Show marketing remark (493 chars)
3-bedroom, 1.5-bathroom single-family home built in 1972 offering approximately 1,248 square feet, situated on a spacious 0.57-acre lot. The property features a functional layout with central heating and air conditioning, along with a detached garage for additional storage or parking. The large lot provides plenty of outdoor space with mature trees and room for expansion or improvements. The home is currently occupied and offers an opportunity for updates and value-add improvements.
-
2026-04-28price $170,000 493-char remark
Show marketing remark (493 chars)
3-bedroom, 1.5-bathroom single-family home built in 1972 offering approximately 1,248 square feet, situated on a spacious 0.57-acre lot. The property features a functional layout with central heating and air conditioning, along with a detached garage for additional storage or parking. The large lot provides plenty of outdoor space with mature trees and room for expansion or improvements. The home is currently occupied and offers an opportunity for updates and value-add improvements.
-
2026-04-16price $180,000 493-char remark
Show marketing remark (493 chars)
3-bedroom, 1.5-bathroom single-family home built in 1972 offering approximately 1,248 square feet, situated on a spacious 0.57-acre lot. The property features a functional layout with central heating and air conditioning, along with a detached garage for additional storage or parking. The large lot provides plenty of outdoor space with mature trees and room for expansion or improvements. The home is currently occupied and offers an opportunity for updates and value-add improvements.
-
2026-04-10price $185,000 493-char remark
Show marketing remark (493 chars)
3-bedroom, 1.5-bathroom single-family home built in 1972 offering approximately 1,248 square feet, situated on a spacious 0.57-acre lot. The property features a functional layout with central heating and air conditioning, along with a detached garage for additional storage or parking. The large lot provides plenty of outdoor space with mature trees and room for expansion or improvements. The home is currently occupied and offers an opportunity for updates and value-add improvements.
-
2026-04-08$140,000 Active 493-char remark
Show marketing remark (493 chars)
3-bedroom, 1.5-bathroom single-family home built in 1972 offering approximately 1,248 square feet, situated on a spacious 0.57-acre lot. The property features a functional layout with central heating and air conditioning, along with a detached garage for additional storage or parking. The large lot provides plenty of outdoor space with mature trees and room for expansion or improvements. The home is currently occupied and offers an opportunity for updates and value-add improvements.
-
2004-08-27historical
-
2004-02-27$74,900
-
2002-04-30$52,900
ⓘ Source: listings_history table (triggers on properties + properties_extension) + one-shot
backfill from property_details.listing_events for pre-trigger history.
Tax reassessment forecast IN · Partial reset (capped growth)
- Current annual tax
- $1,095 · $91/mo
- Projected year-2 tax
- $1,143 · $95/mo
- Expected delta
- +$47/yr (+$4/mo · 4.3%)
ⓘ Screening estimate from a state-policy table — verify with the county assessor before closing.
Climate risk First Street
- Flood 1/10 Low FEMA zone X (unshaded) · 0% chance over 30 yrs
- Wildfire 1/10 Low
- Heat 2/10 Low 7 d/yr ≥101°F today · 16 d/yr by 30 yrs out
- Wind 2/10 Low 0% chance of damaging wind over 30 yrs
- Air quality 3/10 Moderate 2 unhealthy d/yr today · 3 by 30 yrs out
Nearby sold comps map
Loading sold comps map…
Walkable amenities ~0.75 mi
Loading nearby amenities…
Taxation est. · year 1
- Rental income
- $14,244
- − Mortgage interest
- −$7,842
- − Property taxes
- −$1,095
- − Insurance
- −$700
- − Repairs & maintenance
- −$1,140
- − Management
- −$1,140
- − Depreciation
- −$4,073
- Taxable loss
- −$1,745
- Est. tax savings @ 24.0%
- +$419
- After-tax cash flow
- $1,067/yr
For passive investors: Depreciation is non-cash, so a rental often shows a tax loss while cash-flowing — sheltering income. Rental losses are passive: they offset passive income freely, and up to $25,000/yr can offset ordinary (W-2) income if you actively participate and your MAGI is under $100k (phasing out to $0 by $150k); unused losses carry forward. On sale, claimed depreciation is recaptured at up to 25%, and gains may owe capital-gains tax (a 1031 exchange can defer both). Figures are a year-1 estimate at your 24.0% rate — not tax advice; consult a CPA.
Schools (NCES district)
- District
- North Newton School Corporation
- NCES district ID
- 1807920
- Math proficiency
- 28% ▼ -9.00%
- Reading proficiency
- 38% ▼ -7.00%
- Median HH income
- $51,771
- Composite
- 28.82/100
- National rank
- #6655
- State rank
- #205 of 301 in IN
Livability — Roselawn
- Score
- 65/100
- State rank
- #324
- US rank
- #12683
Category grades
Schools grade is shown separately in the Schools card above.
Census & demographics
- Census place
- Roselawn, IN
- Population (ZIP)
- 13,914
Population outlook (Newton County) Hauer SSP2
- Today (2025)
- 13,726 people
- By 2030
- 13,448 · -2.0%
- By 2040
- 12,771 · -7.0%
- By 2050
- 12,104 · -11.8%
- By 2075
- 11,059 · -19.4%
- By 2100
- 9,813 · -28.5%
Race, ethnicity, and origin ACS 2023
- Neighborhood character
- Predominantly White (85%)
- Race & ethnicity
- White 85% Two or more races 10% Hispanic / Latino 8%
- Hispanic origin (detail)
- Mexican 6%
- Common ancestry
- Iranian 9% Romanian 7% Slovak 3%
- Foreign-born
- 3% · Canada
- Languages at home
- 95% English-only · Spanish 4%
Political lean MEDSL · Newton
- 2024 margin
- Solid R (+57.0) · D 20.8% · R 77.7% · Other 1.5%
- 2008→2024 swing
- -45.8pp toward R · 2008: -11.2pp · 2024: -57.0pp
- All cycles
- 2024: R+57.0 2020: R+52.1 2016: R+46.1 2012: R+19.1 2008: R+11.2
Not yet ingested
- Civics
- —
Market trends
- HPI YoY
- ▼ -57.55%
- Current HPI
- 230.433
- Rent YoY
- —
- Metro
- —
- State GDP YoY
- ▲ 2.90%
- F500 in state
- 18
Industry mix (Fortune 500 HQ in IN)
| Industry | F500 HQs | Revenue |
|---|---|---|
| Industrial Machinery | 2 | $37B |
|
||
| Healthcare | 1 | $177B |
|
||
| Pharmaceuticals | 1 | $45B |
|
||
| Metals / Steel | 1 | $18B |
|
||
| Agriculture | 1 | $17B |
|
||
| Packaging | 1 | $12B |
|
||
Price history
+183.6% since first listed8 events — show timeline
- 2026-05-06 Price Changed $150,000 MIBOR as Distributed by MLS Grid
- 2026-04-28 Price Changed $170,000 MIBOR as Distributed by MLS Grid
- 2026-04-16 Price Changed $180,000 MIBOR as Distributed by MLS Grid
- 2026-04-10 Price Changed $185,000 MIBOR as Distributed by MLS Grid
- 2026-04-08 Listed $140,000 MIBOR as Distributed by MLS Grid
- 2004-08-27 Listing Removed — NIRA MLS as Distributed by MLS Grid
- 2004-02-27 Listed $74,900 NIRA MLS as Distributed by MLS Grid
- 2002-04-30 Listed $52,900 NIRA MLS as Distributed by MLS Grid
Property tax history
+10.9%/yrLatest (2024): $1,095 · -14.8% YoY. Source: county tax records.
Cash-flow waterfall
monthlySold comps — $/sqft
last 12 mo · ≤1 miLoading sold comps…