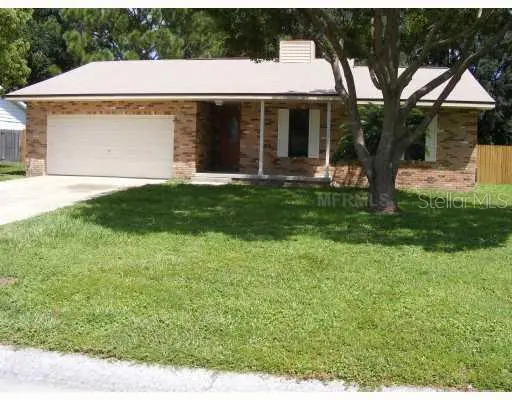
7039 Sheffield Dr · Lakeland, FL
Flood risk 1/10 · Minimal
- FEMA flood zone
- X (unshaded)
- Chance of flooding over 30 yrs
- 0.0%
- Est. flood insurance / yr
- $507 – $1,088
Fire risk 3/10 · Minor
- Est. fire insurance / yr
- $947 – $1,759
Heat risk 8/10 · Major
- Hot days now (above 108°F)
- 7 days/yr
- Hot days in 30 yrs
- 23 days/yr
Wind risk 9/10 · Severe
- Chance of severe wind over 30 yrs
- 99.0%
Air-quality risk 2/10 · Minimal
- Unhealthy air days now
- 1 days/yr
- Unhealthy air days in 30 yrs
- 1 days/yr
Risk factors via First Street. Map © Google.
Why this score? — see what drove the C- grade
The composite is a weighted blend of 9 inputs, each scored 0–100. Each bar is that input's sub-score; the figure is the points it added to the 100-point composite (weight × sub-score).
- Cash flow +20.7/30.0
- ARV discount +7.5/15.0
- DSCR +6.6/10.0
- 1% rule +6.1/10.0
- Livability +3.9/5.0
- Schools +3.5/10.0
- Rent growth +3.2/5.0
- Condition / age +2.5/5.0
- Appreciation +0.0/10.0
$194,900
🖨 Deal sheet 📄 Offer letter ✓ Due diligence
Listing remarks
* * MULTIPLE OFFER SITUATION - Highest and best deadline is 10am on Monday 6/15/26 * * Seller offering up to $3,898 toward buyer closing costs or principle reduction for all accepted offers by 6/30/26. Opportunity knocks in North Lakeland with no HOA and no CDD. This block built 3 bedroom, 2 bath home sits on better than a quarter acre and offers 1,272 SF of heated living space plus an enclosed rear porch with a half bath not included in the heated square footage, a 2 car garage, a brick fireplace, a fenced backyard, and a storage shed. Central AC was replaced in 2018. The home needs updating and is priced to reflect its condition, making it a great fit for buyers ready to add value. Cas
Key facts
- Storage shed
- Central ac replaced
- Enclosed rear porch
Tags
Property features AI
Finance
- Other: Property type: Residential (Single Family Residence); Building area total: 2,280 square feet; Living area: 1,272 square feet; Lot size reported as 0.29 acres; Direction faces: South
- HOA & community: No HOA association indicated
Exterior
- Parking: Attached garage; 2-car garage
- Utilities: Public water; Septic tank sewer; Electricity connected
- Home design: Single-family residence; One story; Faces south; Residential zoning (R-1)
- Construction: Block, brick, stucco and other construction materials; Shingle roof; Slab foundation; Built on a 0.29-acre lot (approximately 1/4 to less than 1/2 acre)
- Exterior features: Other exterior features; Asphalt road access
Interior
- Kitchen: Appliances: Other
- Bedrooms: 3 bedrooms
- Flooring: Carpet; Tile
- Bathrooms: 2 full bathrooms; 1 half bathroom
- Heating & cooling: Central heating; Central air conditioning
- Interior features: Thermostat; Fireplace in the family room; Total of 5 rooms
- Laundry & utility: Laundry: Other
Neighborhood map
What this means for you Summary
Snapshot
- This is a 3-bed/2.0-bath single-family listed at $195k.
Deal economics
- At list price, monthly cash flow is $263 ($3k/yr) — positive.
- The deal already cash-flows at list — no discount required.
- Meets the 1% rule at list price ($2k rent vs $195k).
Location & tenants
- Location reads 77/100 on livability (#206 in FL, #3,179 nationally) — a middle-class / working-renter tenant base. Strengths: cost of living A+, housing A+, health & safety A+; Watch: employment D+, amenities F, commute F.
- Polk (suburban): math 39% / reading 43% proficiency, ranked #62 of 73 in FL (top 85%) — families likely to look elsewhere, expect single-tenant / working-renter base with shorter leases.
- Zoned schools: Dr. Ne Roberts Elementary School (math 45% / reading 34%, grade F, #1,513 of 2,144 statewide, top 73%, 691 students, 54% FRL); Kathleen Senior High School (math 19% / reading 31%, grade F, #501 of 667 statewide, top 75%, 2,051 students, 59% FRL) — zoned schools at 56% FRL track the district average.
- Market conditions: Rents rising (+2.8%/yr); 504 active listings in the ZIP; 16 comparable units currently listed for rent nearby; rentals at typical pace (median 14d on market — plan ~3-4 weeks tenant-placement turnaround); 10,384 units permitted in Polk County in 2024 (1,716 in 5+ unit buildings).
- This rent runs 37% of the median local income ($70k/yr) — at the standard rent-burdened threshold; future hikes will face affordability resistance.
Forward outlook
- Local home prices are declining (-3.0%/yr); year-one equity from $1k of loan paydown is wiped out by about $6k of value loss. Plan a longer hold.
- Polk County population projected at +33% by 2050 — long-run rental-demand tailwind backs the buy-and-hold thesis.
Negotiation context
- Only 4 days on market — expect competitive offers; lowballing is unlikely to land.
- 4 sale attempts since 19y ago with the ask held roughly flat each time — persistent listings suggest the price (not the market) is what's stuck; bring a comps-based counter.
- Current owner paid $158k; 23% above their basis — modest negotiation headroom, anchor on the comps not their cost.
Risks & watch-outs
- Climate carrying-cost: severe wind risk, 99% chance of damaging wind over 30y; extreme-heat days projected 7→23/yr by 2055 (HVAC capex compounding) — expect insurance premiums to compound above CPI over the hold.
Questions for the listing agent
- Is there a deadline driving the sale (1031 exchange, divorce, estate, relocation)? That informs how much negotiation room exists.
- What's the average days-on-market for RENTAL listings here right now (not sales)? A rising rental-DOM trend means longer vacancies and softer asking-rent achievability than the comps imply.
- What's the recent tenant-quality profile in this submarket — average credit score on applications, eviction rate, late-payment / NSF rate, and stable-employment percentage? A property-management company in the area should have these aggregated.
- How much new for-sale + rental construction is in the pipeline within 1–3 miles? Heavy new supply typically softens prices + rents 12–24 months out; constrained supply supports both.
Investment metrics
- 1% rule
- 1.11% ✓
- Cap rate
- 7.91%
- Cash-on-cash
- 5.79%
- DSCR
- 1.26
- GRM
- 7.5
CMA / ARV
No comps found within radius.
Projected returns pro-forma
-3.0% appreciation · 2.78% rent growth · sell at horizon
- IRR
- -7.6%
- Equity multiple
- 0.72×
- Total profit
- $-15,195
- Equity at exit
- $29,060
- IRR
- 1.8%
- Equity multiple
- 1.12×
- Total profit
- $6,787
- Equity at exit
- $16,851
Cash invested: $54,572 (down + closing). Projections, not guarantees.
Landlord ↔ Tenant lean methodology
- Overall (STATE)
- 87 Strongly Landlord-Friendly
- State Florida
- 87 Strongly Landlord-Friendly · R+3
- County
- — inherits STATE
- City
- — inherits STATE
ZIP-level market 33810
- Rents YoY
- 2.8%
- Active inventory
- 504
- Price-to-rent
- 7.5×
Monthly cashflow live
- Estimated rent
- $2,156 high interval (Pro) →
- Mortgage (P&I)
- −$1,022
- Tax from tax record
- −$337 /mo · $4,039/yr
- Insurance
- −$81
- HOA
- −$0
- Vacancy / Maint / Mgmt
- −$453
- Net cashflow
- $263
Break-even live
UW: 25.0% down · 7.5% · 30yr · 1.5% tax · 5.0% vac · 8.0% maint · 8.0% mgmt
Financing live
Cash to close
- Down payment
- $48,725
- Closing costs
- $5,847
- Reserves months
- —
- Total cash needed
- —
Loan-product check · same deal, 3 products live
Conventional
25% down · 7.5% · 30yr
- Down + closing
- —
- Monthly P&I
- —
- Monthly cashflow
- —
- DSCR
- —
- Eligible?
- —
Personal DTI + credit; lowest rate.
DSCR
20% down · 8.5% · 30yr
- Down + closing
- —
- Monthly P&I
- —
- Monthly cashflow
- —
- DSCR
- —
- Eligible?
- —
No personal income docs; deal must DSCR.
Hard money
10% down · 12.0% · 12mo
- Down + closing
- —
- Monthly P&I
- —
- Monthly cashflow
- —
- DSCR
- —
- Eligible?
- —
Short-term bridge; refi at stabilization.
Rent comps 16 comps
| Address | Beds | Baths | Sqft | Rent | $/sqft | DOM | Units | Dist |
|---|---|---|---|---|---|---|---|---|
| 7362 Beaumont Dr Lakeland, FL | 4.0 | 2.0 | 1752 | $2,200 | $1.26 | 14d | 1 | 0.50mi |
| 7362 Beaumont Dr Lakeland, FL | 4.0 | 2.0 | 1752 | $2,200 | $1.26 | 3d | 1 | 0.50mi |
| 7047 Hazeltine Cir Lakeland, FL | 3.0 | 2.0 | 1748 | $2,300 | $1.32 | 13d | 1 | 0.57mi |
| 7446 Briarbay Loop Lakeland, FL | 3.0 | 2.0 | 1243 | $1,810 | $1.46 | 3d | 1 | 0.64mi |
| 7508 Briarbay Loop Unit A11 Lakeland, FL | 3.0 | 2.0 | 1348 | $2,090 | $1.55 | 3d | 1 | 0.67mi |
| 3063 Westmoreland Dr Lakeland, FL | 3.0 | 2.0 | 1755 | $2,350 | $1.34 | 19d | 1 | 0.80mi |
| 7525 Ibis Dr Lakeland, FL | 4.0 | 2.0 | 1707 | $2,300 | $1.35 | 23d | 1 | 0.85mi |
| 2918 W Campbell Rd Lakeland, FL | 3.0 | 2.0 | 1341 | $2,200 | $1.64 | 14d | 1 | 0.87mi |
| 7901 Sioux Ln Lakeland, FL | 3.0 | 2.0 | 1336 | $1,791 | $1.34 | 23d | 1 | 0.91mi |
| 7702 Chase Rd Lakeland, FL | 2.0 | 2.0 | 1768 | $1,600 | $0.90 | 23d | 1 | 0.98mi |
| 8007 Apache Ln Lakeland, FL | 3.0 | 2.0 | 1276 | $2,010 | $1.58 | 23d | 1 | 0.99mi |
| 2045 Harvest Landing Cir Lakeland, FL | 4.0 | 2.0 | 1597 | $2,150 | $1.35 | 23d | 1 | 0.99mi |
| 7943 Indian Heights Dr Lakeland, FL | 3.0 | 2.0 | 1305 | $1,975 | $1.51 | 13d | 1 | 1.00mi |
| 7823 Sugar Pine Blvd Lakeland, FL | 3.0 | 2.0 | 1559 | $1,875 | $1.20 | 3d | 1 | 1.14mi |
| 6120 Burnett St Lakeland, FL | 1.0–3.0 | 1.0–2.0 | 1002 | $2,312 | $2.31 | 3d | 21 | 1.42mi |
| 3366 Mahogany Pointe Loop Lakeland, FL | 3.0 | 2.0 | 1566 | $2,125 | $1.36 | 3d | 1 | 1.44mi |
Listing history 4 events
-
2026-06-15status $194,900 Pending 4 DOM
-
2026-06-15days on market $194,900 Active 4 DOM
-
2026-06-13remarks 699-char remark
-
2026-06-13$194,900 Active 2 DOM
ⓘ Source: listings_history table (triggers on properties + properties_extension) + one-shot
backfill from property_details.listing_events for pre-trigger history.
Tax reassessment forecast FL · Resets to sale price
- Current annual tax
- $4,039 · $337/mo
- Projected year-2 tax
- $4,039 · $337/mo
- Expected delta
- $0/yr ($0/mo · 0.0%)
ⓘ Screening estimate from a state-policy table — verify with the county assessor before closing.
Climate risk First Street
- Flood 1/10 Low FEMA zone X (unshaded) · 0% chance over 30 yrs
- Wildfire 3/10 Moderate
- Heat 8/10 Severe 7 d/yr ≥108°F today · 23 d/yr by 30 yrs out
- Wind 9/10 Extreme 99% chance of damaging wind over 30 yrs
- Air quality 2/10 Low 1 unhealthy d/yr today · 1 by 30 yrs out
Nearby sold comps map
Loading sold comps map…
Walkable amenities ~0.75 mi
Loading nearby amenities…
Taxation est. · year 1
- Rental income
- $25,872
- − Mortgage interest
- −$10,917
- − Property taxes
- −$4,039
- − Insurance
- −$974
- − Repairs & maintenance
- −$2,070
- − Management
- −$2,070
- − Depreciation
- −$5,670
- Taxable income
- $132
- Est. tax owed @ 24.0%
- −$32
- After-tax cash flow
- $3,129/yr
For passive investors: Depreciation is non-cash, so a rental often shows a tax loss while cash-flowing — sheltering income. Rental losses are passive: they offset passive income freely, and up to $25,000/yr can offset ordinary (W-2) income if you actively participate and your MAGI is under $100k (phasing out to $0 by $150k); unused losses carry forward. On sale, claimed depreciation is recaptured at up to 25%, and gains may owe capital-gains tax (a 1031 exchange can defer both). Figures are a year-1 estimate at your 24.0% rate — not tax advice; consult a CPA.
Schools (NCES district)
- District
- Polk
- NCES district ID
- 1201590
- Math proficiency
- 39% ▼ -11.00%
- Reading proficiency
- 43% ▼ -4.00%
- Median HH income
- $43,979
- Composite
- 34.74/100
- National rank
- #5132
- State rank
- #62 of 73 in FL
Livability — Lakeland
- Score
- 77/100
- State rank
- #206
- US rank
- #3179
Category grades
Schools grade is shown separately in the Schools card above.
Census & demographics
- County
- Polk County · 740,051 people
- City population
- 277,690
- Metro
- Lakeland-Winter Haven, FL
- Population (ZIP)
- 55,137
- Household income
- $69,986
- Rent vs Own
- Severe rent burden
- 1208.0
Population outlook (Polk County) Hauer SSP2
- Today (2025)
- 752,975 people
- By 2030
- 804,621 · +6.9%
- By 2040
- 906,117 · +20.3%
- By 2050
- 1,000,476 · +32.9%
- By 2075
- 1,197,520 · +59.0%
- By 2100
- 1,271,518 · +68.9%
Race, ethnicity, and origin ACS 2023
- Neighborhood character
- Diverse neighborhood (Simpson 0.58)
- Race & ethnicity
- White 59% Hispanic / Latino 23% Black 12% Two or more races 10% Asian 2%
- Hispanic origin (detail)
- Mexican 5% Puerto Rican 9% Cuban 5%
- Common ancestry
- Italian 2% Lithuanian 2% Slovak 1%
- Foreign-born
- 9% · Canada, Jamaica
- Languages at home
- 79% English-only · Spanish 17% French/Haitian/Cajun 1% Tagalog/Filipino 1%
Political lean MEDSL · Polk
- 2024 margin
- Strong R (+20.7) · D 39.2% · R 59.9%
- 2008→2024 swing
- -14.6pp toward R · 2008: -6.1pp · 2024: -20.7pp
- All cycles
- 2024: R+20.7 2020: R+14.4 2016: R+14.1 2012: R+6.8 2008: R+6.1
Not yet ingested
- Civics
- —
Market trends
- HPI YoY
- ▼ -194.94%
- Current HPI
- 320.7366
- Rent YoY
- ▲ 2.78%
- Metro
- Lakeland-Winter Haven, FL
- State GDP YoY
- ▲ 3.28%
- F500 in state
- 36
Industry mix (Fortune 500 HQ in FL)
| Industry | F500 HQs | Revenue |
|---|---|---|
| Industrial Technology | 2 | $29B |
|
||
| Insurance | 2 | $17B |
|
||
| Retail | 1 | $60B |
|
||
| Technology Distribution | 1 | $58B |
|
||
| Homebuilding | 1 | $35B |
|
||
| Technology Manufacturing | 1 | $35B |
|
||
Price history
+114.4% since first listed11 events — show timeline
- 2026-06-11 Listed $194,900 Stellar MLS as Distributed by MLS Grid
- 2014-10-27 Listing Removed — Stellar MLS as Distributed by MLS Grid
- 2014-06-14 Contingent — Stellar MLS as Distributed by MLS Grid
- 2014-05-14 Listing Removed — Stellar MLS as Distributed by MLS Grid
- 2013-09-08 Listed $89,000 Stellar MLS as Distributed by MLS Grid
- 2013-09-05 Listing Removed — Stellar MLS as Distributed by MLS Grid
- 2013-08-14 Listed $95,000 Stellar MLS as Distributed by MLS Grid
- 2008-04-02 Sold (Public Records) $158,000 Public Records
- 2008-03-27 Sold (MLS) $158,000 Stellar MLS as Distributed by MLS Grid
- 2007-08-27 Listed $154,900 Stellar MLS as Distributed by MLS Grid
- 2003-02-07 Sold (Public Records) $90,900 Public Records
Property tax history
+11.6%/yrLatest (2025): $4,039 · +6.7% YoY. Source: county tax records.
Cash-flow waterfall
monthlySold comps — $/sqft
last 12 mo · ≤1 miLoading sold comps…