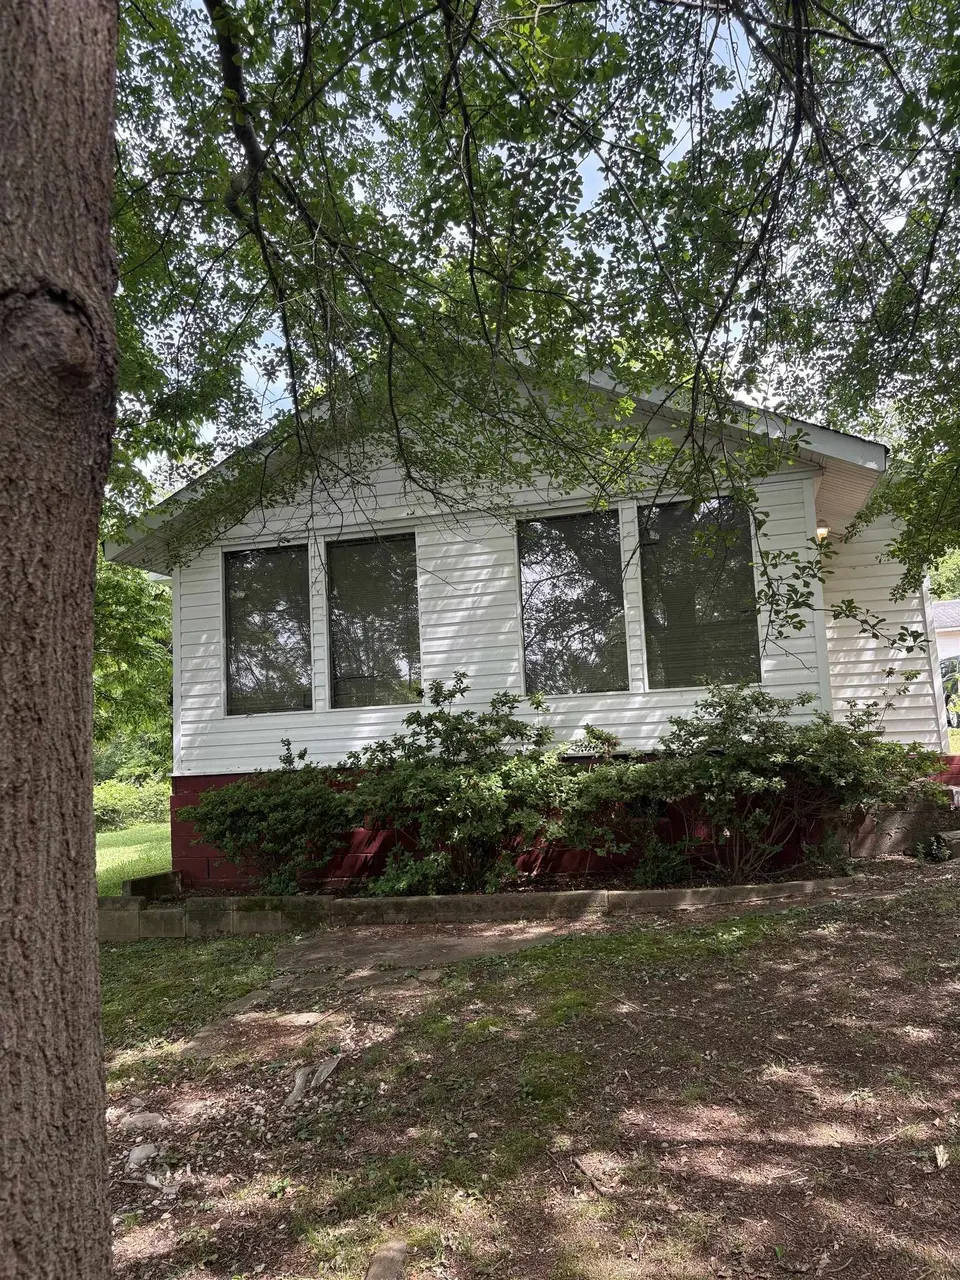
242 Woodlawn Ave · Arkwright, SC
Flood risk 1/10 · Minimal
- FEMA flood zone
- X (unshaded)
- Chance of flooding over 30 yrs
- 0.0%
- Est. flood insurance / yr
- $507 – $1,088
Fire risk 3/10 · Minor
- Est. fire insurance / yr
- $783 – $1,453
Heat risk 6/10 · Moderate
- Hot days now (above 105°F)
- 7 days/yr
- Hot days in 30 yrs
- 16 days/yr
Wind risk 2/10 · Minimal
- Chance of severe wind over 30 yrs
- 2.0%
Air-quality risk 4/10 · Minor
- Unhealthy air days now
- 4 days/yr
- Unhealthy air days in 30 yrs
- 4 days/yr
Risk factors via First Street. Map © Google.
Why this score? — see what drove the B- grade
The composite is a weighted blend of 9 inputs, each scored 0–100. Each bar is that input's sub-score; the figure is the points it added to the 100-point composite (weight × sub-score).
- Cash flow +27.5/30.0
- ARV discount +15.0/15.0
- DSCR +9.6/10.0
- 1% rule +6.3/10.0
- Rent growth +3.4/5.0
- Schools +3.1/10.0
- Livability +2.5/5.0
- Condition / age +2.5/5.0
- Appreciation +0.0/10.0
$120,000
🖨 Deal sheet (PDF) 📄 Offer letter ✓ Due diligence
Listing remarks
This 3-bedroom, 2-bath home offers a great opportunity for investors or buyers looking to add their personal touch. Priced at $120,000 and being sold as-is , this property features a functional layout with a primary bedroom that includes its own en suite bathroom. In addition to the main home, the property includes a separate detached building that has been converted into additional living space perfect for extended family, guests, or potential rental income. With solid bones and plenty of potential, this property is ideal for those seeking value and versatility. Bring your ideas and make this space your own!
Key facts
- En suite bathroom
- Detached building
- 0.62 acre lot
Tags
Property features AI
Finance
- Financial info: Annual tax approximately $504
Exterior
- Home design: Single-family residence; Residential property; One story
- Exterior features: Lot approximately 0.62 acres
Interior
- Bathrooms: 2 full bathrooms
- Interior features: One-level living
Neighborhood map
What this means for you Summary
Snapshot
- This is a 3-bed/2.0-bath single-family listed at $120k.
Deal economics
- At list price, monthly cash flow is $354 ($4k/yr) — positive.
- The deal already cash-flows at list — no discount required.
- Meets the 1% rule at list price ($1k rent vs $120k).
- Recommended offer: $116k (3.0% below list) — sets the bar for market timing.
Location & tenants
- Location reads: area grade B — affects rentability + tenant quality, not the cash-flow math above.
- Spartanburg 07 (urban): math 34% / reading 41% proficiency, ranked #39 of 80 in SC (top 49%) — families likely to look elsewhere, expect single-tenant / working-renter base with shorter leases; 62% free/reduced lunch — lower-income household profile, screen leases tightly.
- Zoned schools: Mary H. Wright Elementary (math 22% / reading 22%, grade F, #475 of 597 statewide, top 81%, 455 students, 100% FRL); Spartanburg High (math 67% / reading 79%, grade B+, #44 of 196 statewide, top 23%, 2,056 students, 85% FRL) — zoned schools average 93% FRL vs 62% district-wide (31 pts higher); higher-poverty schools than district average — tighter screening recommended.
- Market conditions: Rents rising (+3.5%/yr); 234 active listings in the ZIP; 8 comparable units currently listed for rent nearby; rentals at typical pace (median 22d on market — plan ~3-4 weeks tenant-placement turnaround); lower-income renter base — watch delinquency; 3,129 units permitted in Spartanburg County in 2024 (40 in 5+ unit buildings).
- This rent runs 39% of the median local income ($41k/yr) — at the standard rent-burdened threshold; future hikes will face affordability resistance.
Forward outlook
- Local home prices are declining (-3.0%/yr); year-one equity from $830 of loan paydown is wiped out by about $4k of value loss. Plan a longer hold.
- Spartanburg County population projected at +18% by 2050 — long-run rental-demand tailwind backs the buy-and-hold thesis.
- At projected returns (-3.0% appreciation + 3.5% rent growth), your $34k cash investment doubles in ~9 years — after that, you're playing with house money.
Negotiation context
- It's been on market 44 days — a 3% lower offer ($116k) is reasonable based on typical stale-listing flexibility.
- Current owner paid $28k; list at $120k implies a 329% gain — meaningful room to come down on a strong offer.
Risks & watch-outs
- Watch-outs: built in 1928 — expect roof / HVAC / electrical / plumbing capex.
- Climate carrying-cost: extreme-heat days projected 7→16/yr by 2055 (HVAC capex compounding) — expect insurance premiums to compound above CPI over the hold.
Questions for the listing agent
- It's been on market 44 days. Have you received any prior offers? Is the seller open to a 3% concession, seller financing, or rate buy-down credit?
- Built in 1928 — when were the roof, HVAC, electrical panel, plumbing, and water heater last replaced?
- Is there a deadline driving the sale (1031 exchange, divorce, estate, relocation)? That informs how much negotiation room exists.
- What's the average days-on-market for RENTAL listings here right now (not sales)? A rising rental-DOM trend means longer vacancies and softer asking-rent achievability than the comps imply.
- What's the recent tenant-quality profile in this submarket — average credit score on applications, eviction rate, late-payment / NSF rate, and stable-employment percentage? A property-management company in the area should have these aggregated.
- How much new for-sale + rental construction is in the pipeline within 1–3 miles? Heavy new supply typically softens prices + rents 12–24 months out; constrained supply supports both.
Investment metrics
- 1% rule
- 1.13% ✓
- Cap rate
- 9.83%
- Cash-on-cash
- 12.64%
- DSCR
- 1.56
- GRM
- 7.4
CMA / ARV
- ARV (on-the-fly)
- $150,672
- Comps found
- 12
Show comp detail 12 sales within ~0.75 mi
| Address | Dist | Beds/Ba | Sqft | Sold | Price | $/sf | Match |
|---|---|---|---|---|---|---|---|
| 238 Woodlawn Ave Ave | 0.05mi | 3/1.0 | 1,248 (+7%) | 11mo | $70,000 | $56 | 73 |
| 110 South Ave | 0.28mi | 2/1.0 (-1) | 1,168 (0%) | 8mo | $137,150 | $117 | 72 |
| 248 Sweetie Way | 0.35mi | 2/1.0 (-1) | 1,148 (-2%) | 1mo | $60,000 | $52 | 71 |
| 132 League St | 0.64mi | 3/2.0 | 1,205 (+3%) | 2mo | $219,100 | $182 | 63 |
| 108 Woodlawn Ave | 0.25mi | 2/1.0 (-1) | 1,200 (+3%) | 15mo | $65,000 | $54 | 62 |
| 230 Foxhall Rd | 0.69mi | 3/1.5 | 1,161 (-1%) | 4mo | $150,000 | $129 | 62 |
| 35 Oak St | 0.13mi | 2/2.0 (-1) | 1,054 (-10%) | 14mo | $170,000 | $161 | 60 |
| 860 S Church St | 0.72mi | 3/2.0 | 1,237 (+6%) | 6mo | $194,990 | $158 | 52 |
| 191 Tucker Rd | 0.54mi | 3/2.0 | 1,277 (+9%) | 9mo | $227,000 | $178 | 52 |
| 853 S Church St | 0.73mi | 3/2.0 | 1,208 (+3%) | 10mo | $219,000 | $181 | 51 |
| 109 Madora Dr | 0.73mi | 3/2.0 | 1,266 (+8%) | 16mo | $155,000 | $122 | 38 |
| 463 Carolina Dr. Ext | 0.54mi | 2/1.0 (-1) | 1,016 (-13%) | 15mo | $80,000 | $79 | 32 |
Match score weights: distance 35% · size 25% · config 20% · recency 20%. Top-matched comps best support the ARV.
Projected returns pro-forma
-3.0% appreciation · 3.46% rent growth · sell at horizon
- IRR
- 2.8%
- Equity multiple
- 1.11×
- Total profit
- $3,681
- Equity at exit
- $17,892
- IRR
- 12.8%
- Equity multiple
- 2.03×
- Total profit
- $34,636
- Equity at exit
- $10,375
Cash invested: $33,600 (down + closing). Projections, not guarantees.
Landlord ↔ Tenant lean methodology
- Overall (STATE)
- 90 Strongly Landlord-Friendly
- State South Carolina
- 90 Strongly Landlord-Friendly · R+6
- County
- — inherits STATE
- City
- — inherits STATE
ZIP-level market 29306
- Home prices YoY
- -29.9%
- Rents YoY
- 3.5%
- Active inventory
- 234
- Price-to-rent
- 7.4×
Monthly cashflow live
- Estimated rent
- $1,351 high interval (Pro) →
- Mortgage (P&I)
- −$629
- Tax from tax record
- −$34 /mo · $408/yr
- Insurance
- −$50
- HOA
- −$0
- Vacancy / Maint / Mgmt
- −$284
- Net cashflow
- $354
Break-even live
Sensitivity live
| Price | -10% $422 | -5% $388 | +0% $354 | +5% $320 | +10% $286 |
|---|---|---|---|---|---|
| Rent | -10% $247 | -5% $301 | +0% $354 | +5% $407 | +10% $461 |
| Rate | -1.0pp $414 | -0.5pp $385 | base $354 | +0.5pp $323 | +1.0pp $291 |
UW: 25.0% down · 7.5% · 30yr · 1.5% tax · 5.0% vac · 8.0% maint · 8.0% mgmt
Financing live
Cash to close
- Down payment
- $30,000
- Closing costs
- $3,600
- Reserves months
- —
- Total cash needed
- —
Loan-product check · same deal, 3 products live
Conventional
25% down · 7.5% · 30yr
- Down + closing
- —
- Monthly P&I
- —
- Monthly cashflow
- —
- DSCR
- —
- Eligible?
- —
Personal DTI + credit; lowest rate.
DSCR
20% down · 8.5% · 30yr
- Down + closing
- —
- Monthly P&I
- —
- Monthly cashflow
- —
- DSCR
- —
- Eligible?
- —
No personal income docs; deal must DSCR.
Hard money
10% down · 12.0% · 12mo
- Down + closing
- —
- Monthly P&I
- —
- Monthly cashflow
- —
- DSCR
- —
- Eligible?
- —
Short-term bridge; refi at stabilization.
Rent comps 8 comps
| Address | Beds | Baths | Sqft | Rent | $/sqft | DOM | Units | Dist |
|---|---|---|---|---|---|---|---|---|
| 938 Logan St Unit A Spartanburg, SC | 2.0 | 2.5 | 980 | $1,600 | $1.63 | 22d | 1 | 0.57mi |
| 624 Crescent Ave Unit 1 Spartanburg, SC | 2.0 | 1.0 | 819 | $1,000 | $1.22 | 22d | 1 | 0.79mi |
| 300 Amherst Dr Spartanburg, SC | 2.0 | 1.0 | 763 | $975 | $1.28 | 14d | 1 | 0.94mi |
| 522 Pennwood Dr Spartanburg, SC | 3.0 | 1.0 | 1153 | $1,400 | $1.21 | 22d | 1 | 1.06mi |
| 116 Morningside Dr Spartanburg, SC | 2.0 | 1.0 | 800 | $850 | $1.06 | 22d | 1 | 1.13mi |
| 118 Morningside Dr Spartanburg, SC | 2.0 | 1.0 | 800 | $850 | $1.06 | 22d | 1 | 1.16mi |
| 111 Timothy St Spartanburg, SC | 2.0 | 1.0 | 1100 | $1,600 | $1.45 | 22d | 1 | 1.35mi |
| 334 W Hampton Ave Unit 1 Spartanburg, SC | 2.0 | 1.0 | 895 | $1,100 | $1.23 | 22d | 1 | 1.46mi |
Listing history 16 events
-
2026-06-18days on market $120,000 Active 44 DOM
-
2026-06-17days on market $120,000 Active 43 DOM
-
2026-06-16days on market $120,000 Active 42 DOM
-
2026-06-15days on market $120,000 Active 41 DOM
-
2026-06-14days on market $120,000 Active 39 DOM
-
2026-06-13days on market $120,000 Active 38 DOM
-
2026-06-10days on market $120,000 Active 36 DOM
-
2026-06-09days on market $120,000 Active 35 DOM
-
2026-06-08days on market $120,000 Active 34 DOM
-
2026-06-07days on market $120,000 Active 33 DOM
-
2026-06-02days on market $120,000 Active 28 DOM
-
2026-06-01days on market $120,000 Active 27 DOM
-
2026-05-31days on market $120,000 Active 26 DOM
-
2026-05-30days on market $120,000 Active 25 DOM
-
2026-05-05$120,000 Active
-
1987-12-01soldstatus $28,000
ⓘ Source: listings_history table (triggers on properties + properties_extension) + one-shot
backfill from property_details.listing_events for pre-trigger history.
Tax reassessment forecast SC · Resets to sale price
- Current annual tax
- $408 · $34/mo
- Projected year-2 tax
- $684 · $57/mo
- Expected delta
- +$276/yr (+$23/mo · 67.5%)
ⓘ Screening estimate from a state-policy table — verify with the county assessor before closing.
Climate risk First Street
- Flood 1/10 Low FEMA zone X (unshaded) · 0% chance over 30 yrs
- Wildfire 3/10 Moderate
- Heat 6/10 Major 7 d/yr ≥105°F today · 16 d/yr by 30 yrs out
- Wind 2/10 Low 2% chance of damaging wind over 30 yrs
- Air quality 4/10 Moderate 4 unhealthy d/yr today · 4 by 30 yrs out
Nearby sold comps map
Loading sold comps map…
Walkable amenities ~0.75 mi
Loading nearby amenities…
Taxation est. · year 1
- Rental income
- $16,213
- − Mortgage interest
- −$6,722
- − Property taxes
- −$408
- − Insurance
- −$600
- − Repairs & maintenance
- −$1,297
- − Management
- −$1,297
- − Depreciation
- −$3,491
- Taxable income
- $2,398
- Est. tax owed @ 24.0%
- −$575
- After-tax cash flow
- $3,673/yr
For passive investors: Depreciation is non-cash, so a rental often shows a tax loss while cash-flowing — sheltering income. Rental losses are passive: they offset passive income freely, and up to $25,000/yr can offset ordinary (W-2) income if you actively participate and your MAGI is under $100k (phasing out to $0 by $150k); unused losses carry forward. On sale, claimed depreciation is recaptured at up to 25%, and gains may owe capital-gains tax (a 1031 exchange can defer both). Figures are a year-1 estimate at your 24.0% rate — not tax advice; consult a CPA.
Schools (NCES district)
- District
- Spartanburg 07
- NCES district ID
- 4503660
- Math proficiency
- 34% ▼ -1.00%
- Reading proficiency
- 41% ▼ -1.00%
- Median HH income
- $35,825
- Composite
- 31.04/100
- National rank
- #6087
- State rank
- #39 of 80 in SC
Livability — Arkwright
No livability data for this city. (Only ~50 U.S. cities are tracked.)
Census & demographics
- Census place
- Arkwright, SC
- County
- Spartanburg County · 258,607 people
- Metro
- Spartanburg, SC
- Population (ZIP)
- 16,714
- Household income
- $41,356
- Rent vs Own
- Severe rent burden
- 1064.0
Population outlook (Spartanburg County) Hauer SSP2
- Today (2025)
- 325,495 people
- By 2030
- 338,800 · +4.1%
- By 2040
- 363,471 · +11.7%
- By 2050
- 384,156 · +18.0%
- By 2075
- 430,137 · +32.1%
- By 2100
- 442,733 · +36.0%
Race, ethnicity, and origin ACS 2023
- Neighborhood character
- Diverse neighborhood (Simpson 0.61)
- Race & ethnicity
- Black 50% White 36% Hispanic / Latino 10% Two or more races 9% Asian 1%
- Hispanic origin (detail)
- Mexican 7% Puerto Rican 2%
- Common ancestry
- Slovak 1% Serbian 1% Iranian 1%
- Foreign-born
- 7% · Canada
- Languages at home
- 90% English-only · Spanish 7% Other Indo-European 2%
Political lean MEDSL · Spartanburg
- 2024 margin
- Solid R (+33.6) · D 32.6% · R 66.2% · Other 1.2%
- 2008→2024 swing
- -12.0pp toward R · 2008: -21.6pp · 2024: -33.6pp
- All cycles
- 2024: R+33.6 2020: R+27.3 2016: R+30.0 2012: R+23.1 2008: R+21.6
Not yet ingested
- Civics
- —
Market trends
- HPI YoY
- ▼ -90.67%
- Current HPI
- 213.1266
- Rent YoY
- ▲ 3.46%
- Metro
- Spartanburg, SC
- State GDP YoY
- ▲ 4.51%
- F500 in state
- 2
Industry mix (Fortune 500 HQ in SC)
| Industry | F500 HQs | Revenue |
|---|---|---|
| Packaging | 1 | $7B |
|
||
Price history
+328.6% since first listed2 events — show timeline
- 2026-05-05 Listed $120,000 SPMLS
- 1987-12-01 Sold (Public Records) $28,000 Public Records
Property tax history
-1.2%/yrLatest (2025): $408 · +2.6% YoY. Source: county tax records.
Cash-flow waterfall
monthlySold comps — $/sqft
last 12 mo · ≤1 miLoading sold comps…