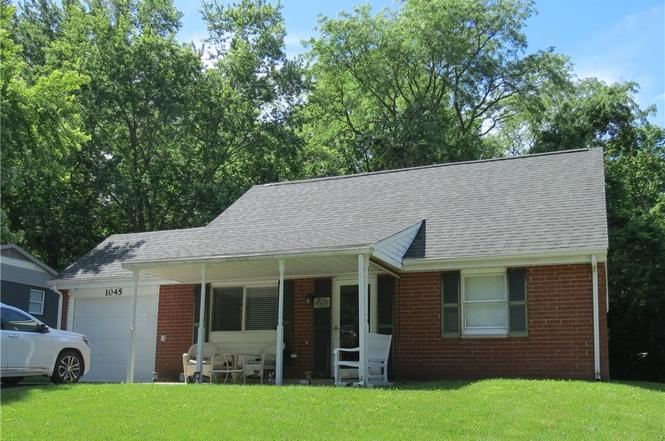
1045 Riverbend Blvd · Sidney, OH
Flood risk 1/10 · Minimal
- FEMA flood zone
- X (unshaded)
- Chance of flooding over 30 yrs
- 0.0%
- Est. flood insurance / yr
- $507 – $1,088
Fire risk 1/10 · Minimal
- Est. fire insurance / yr
- $713 – $1,323
Heat risk 3/10 · Minor
- Hot days now (above 99°F)
- 7 days/yr
- Hot days in 30 yrs
- 18 days/yr
Wind risk 2/10 · Minimal
- Chance of severe wind over 30 yrs
- —
Air-quality risk 2/10 · Minimal
- Unhealthy air days now
- 1 days/yr
- Unhealthy air days in 30 yrs
- 1 days/yr
Risk factors via First Street. Map © Google.
Why this score? — see what drove the D+ grade
The composite is a weighted blend of 9 inputs, each scored 0–100. Each bar is that input's sub-score; the figure is the points it added to the 100-point composite (weight × sub-score).
- ARV discount +15.0/15.0
- Cash flow +13.4/30.0
- Schools +4.2/10.0
- DSCR +4.0/10.0
- Livability +3.8/5.0
- 1% rule +3.1/10.0
- Rent growth +2.5/5.0
- Condition / age +2.5/5.0
- Appreciation +0.0/10.0
$157,000
🖨 Deal sheet (PDF) 📄 Offer letter ✓ Due diligence
Listing remarks MLS
This one owner home is solid and ready for someone to ''make it their own.'' Well located with a private wooded backyard. It has a covered front sitting porch, a good living room, an updated kitchen with range, refrigerator and microwave for your convenience and a large laundry room holding a washer and dryer and small chest freezer. The main bedroom is on the 1st level and shares a walk-in shower bath with a second bedroom. Upstairs offers a bedroom needing finish work and another 15' x 12' room that is used for attic storage and that holds the a/c duct work. The single vehicle garage is attached and is extra deep for outdoor equipment. This home is a perfect find for someone who wants to refresh paint and do small projects.
Key facts
- Attic storage
- Extra deep garage
- Large laundry room
Tags
Property features AI
Finance
- Financial info: Offered for sale
Exterior
- Parking: Attached one-car garage
- Utilities: Public water; Sewer available
- Home design: Residential zoning
- Construction: Brick and vinyl siding exterior; Slab foundation
- Exterior features: Porch; Patio; Storage; Shed(s)
Interior
- Kitchen: Range; Refrigerator; Microwave
- Bedrooms: Bedroom on main level (12 x 9); Bedroom on main level (12 x 10); Bedroom on second level (15 x 11)
- Bathrooms: 1 full bathroom (main level)
- Heating & cooling: Heat pump heating; Central air conditioning
- Interior features: Ceiling fan(s)
- Laundry & utility: Washer; Dryer; Utility room on main level (8 x 6); Electric water heater
Neighborhood map
What this means for you Summary
Snapshot
- This is a 4-bed/1.0-bath single-family listed at $157k.
Deal economics
- At list price, monthly cash flow is $3 ($38/yr) — positive.
- The deal already cash-flows at list — no discount required.
- To meet the 1% rule (rent ≥ 1% of price), the offer needs to be $126k (19.5% below list).
- Recommended offer: $126k (19.5% below list) — sets the bar for 1% rule.
- Cap rate 6.3% vs local median 4.1% in Sidney — top-decile yield for the area; either an underpriced asset or a hidden risk that comps aren't pricing in. Stress-test before assuming the spread holds.
Location & tenants
- Location reads 76/100 on livability (#220 in OH, #3,412 nationally) — a middle-class / working-renter tenant base. Strengths: cost of living A+, housing A+, health & safety A+; Watch: crime C-, employment C-, amenities D.
- Sidney City (town): math 46% / reading 52% proficiency, ranked #454 of 656 in OH (top 69%) — families likely to look elsewhere, expect single-tenant / working-renter base with shorter leases.
- Market conditions: 145 active listings in the ZIP; 2 comparable units currently listed for rent nearby; 337 units permitted in Shelby County in 2024 (216 in 5+ unit buildings).
Forward outlook
- Local home prices are declining (-3.0%/yr); year-one equity from $1k of loan paydown is wiped out by about $5k of value loss. Plan a longer hold.
- Shelby County population projected at -18% by 2050 — secular population decline; favor cash flow + early exit over multi-decade hold.
Negotiation context
- Only 3 days on market — expect competitive offers; lowballing is unlikely to land.
- 2 sale attempts with the ask held roughly flat each time — persistent listings suggest the price (not the market) is what's stuck; bring a comps-based counter.
Questions for the listing agent
- Built in 1973 — when were the roof, HVAC, electrical panel, plumbing, and water heater last replaced?
- Is there a deadline driving the sale (1031 exchange, divorce, estate, relocation)? That informs how much negotiation room exists.
- The area grade is low — what's the realistic commute time and amenity access for the typical tenant pool here? Any planned neighborhood developments (good or bad) we should know about?
- What's the average days-on-market for RENTAL listings here right now (not sales)? A rising rental-DOM trend means longer vacancies and softer asking-rent achievability than the comps imply.
- What's the recent tenant-quality profile in this submarket — average credit score on applications, eviction rate, late-payment / NSF rate, and stable-employment percentage? A property-management company in the area should have these aggregated.
- How much new for-sale + rental construction is in the pipeline within 1–3 miles? Heavy new supply typically softens prices + rents 12–24 months out; constrained supply supports both.
Investment metrics
- 1% rule
- 0.81% ✗
- Cap rate
- 6.32%
- Cash-on-cash
- 0.09%
- DSCR
- 1.00
- GRM
- 10.4
CMA / ARV
- ARV (on-the-fly)
- $246,848
- Comps found
- 12
Show comp detail 12 sales within ~0.75 mi
| Address | Dist | Beds/Ba | Sqft | Sold | Price | $/sf | Match |
|---|---|---|---|---|---|---|---|
| 1002 Riverside Dr | 0.12mi | 3/1.0 (-1) | 1,984 (+7%) | 4mo | $100,000 | $50 | 74 |
| 789 Johnston Dr | 0.36mi | 4/2.5 | 1,853 (-0%) | 14mo | $270,000 | $146 | 65 |
| 770 Johnston Dr | 0.40mi | 4/3.0 | 1,898 (+2%) | 6mo | $252,000 | $133 | 64 |
| 1012 Riverbend Blvd | 0.08mi | 4/2.0 | 2,072 (+12%) | 14mo | $179,900 | $87 | 62 |
| 120 Bon Air | 0.49mi | 3/2.0 (-1) | 1,776 (-4%) | 2mo | $249,900 | $141 | 60 |
| 1442 Langdon | 0.50mi | 5/2.0 (+1) | 1,711 (-8%) | 2mo | $285,000 | $167 | 53 |
| 1516 Bon Air Cir | 0.53mi | 4/2.5 | 2,060 (+11%) | 7mo | $340,000 | $165 | 45 |
| 1376 Constitution Ave | 0.52mi | 3/2.0 (-1) | 1,640 (-12%) | 5mo | $243,900 | $149 | 43 |
| 439 Kossuth St | 0.64mi | 3/2.0 (-1) | 1,834 (-1%) | 22mo | $230,000 | $125 | 41 |
| 1003 Port Jefferson Rd | 0.52mi | 3/1.0 (-1) | 1,584 (-15%) | 16mo | $179,900 | $114 | 33 |
| 401 New St | 0.74mi | 3/1.0 (-1) | 1,584 (-15%) | 6mo | $165,000 | $104 | 31 |
| 807 Clinton Ave | 0.59mi | 3/2.0 (-1) | 1,614 (-13%) | 22mo | $130,000 | $81 | 23 |
Match score weights: distance 35% · size 25% · config 20% · recency 20%. Top-matched comps best support the ARV.
Projected returns pro-forma
-3.0% appreciation · 3.0% rent growth · sell at horizon
- IRR
- -16.2%
- Equity multiple
- 0.42×
- Total profit
- $-25,278
- Equity at exit
- $23,409
- IRR
- -7.9%
- Equity multiple
- 0.50×
- Total profit
- $-21,901
- Equity at exit
- $13,574
Cash invested: $43,960 (down + closing). Projections, not guarantees.
Landlord ↔ Tenant lean methodology
- Overall (STATE)
- 73 Landlord-Friendly
- State Ohio
- 73 Landlord-Friendly · R+6
- County
- — inherits STATE
- City
- — inherits STATE
ZIP-level market 45365
- Home prices YoY
- -20.1%
- Active inventory
- 145
- Price-to-rent
- 10.4×
Monthly cashflow live
- Estimated rent
- $1,264 medium interval (Pro) →
- Mortgage (P&I)
- −$823
- Tax from tax record
- −$107 /mo · $1,279/yr
- Insurance
- −$65
- HOA
- −$0
- Vacancy / Maint / Mgmt
- −$265
- Net cashflow
- $3
Break-even live
Sensitivity live
| Price | -10% $92 | -5% $48 | +0% $3 | +5% $-41 | +10% $-86 |
|---|---|---|---|---|---|
| Rent | -10% $-97 | -5% $-47 | +0% $3 | +5% $53 | +10% $103 |
| Rate | -1.0pp $82 | -0.5pp $43 | base $3 | +0.5pp $-38 | +1.0pp $-79 |
UW: 25.0% down · 7.5% · 30yr · 1.5% tax · 5.0% vac · 8.0% maint · 8.0% mgmt
Financing live
Cash to close
- Down payment
- $39,250
- Closing costs
- $4,710
- Reserves months
- —
- Total cash needed
- —
Loan-product check · same deal, 3 products live
Conventional
25% down · 7.5% · 30yr
- Down + closing
- —
- Monthly P&I
- —
- Monthly cashflow
- —
- DSCR
- —
- Eligible?
- —
Personal DTI + credit; lowest rate.
DSCR
20% down · 8.5% · 30yr
- Down + closing
- —
- Monthly P&I
- —
- Monthly cashflow
- —
- DSCR
- —
- Eligible?
- —
No personal income docs; deal must DSCR.
Hard money
10% down · 12.0% · 12mo
- Down + closing
- —
- Monthly P&I
- —
- Monthly cashflow
- —
- DSCR
- —
- Eligible?
- —
Short-term bridge; refi at stabilization.
Rent comps 2 comps
| Address | Beds | Baths | Sqft | Rent | $/sqft | DOM | Units | Dist |
|---|---|---|---|---|---|---|---|---|
| 1402 N Main Ave Sidney, OH | 3.0 | 1.0 | 1544 | $1,300 | $0.84 | 13d | 1 | 0.87mi |
| 314 Thompson St Sidney, OH | 3.0 | 1.0 | 1352 | $1,200 | $0.89 | 3d | 1 | 1.35mi |
Listing history 4 events
-
2026-06-18days on market $157,000 Active 3 DOM
-
2026-06-17days on market $157,000 Active 2 DOM
-
2026-06-15remarks 675-char remark
-
2026-06-15$157,000 Active 1 DOM
ⓘ Source: listings_history table (triggers on properties + properties_extension) + one-shot
backfill from property_details.listing_events for pre-trigger history.
Tax reassessment forecast OH · Partial reset (capped growth)
- Current annual tax
- $1,279 · $107/mo
- Projected year-2 tax
- $1,864 · $155/mo
- Expected delta
- +$585/yr (+$49/mo · 45.7%)
ⓘ Screening estimate from a state-policy table — verify with the county assessor before closing.
Climate risk First Street
- Flood 1/10 Low FEMA zone X (unshaded) · 0% chance over 30 yrs
- Wildfire 1/10 Low
- Heat 3/10 Moderate 7 d/yr ≥99°F today · 18 d/yr by 30 yrs out
- Wind 2/10 Low
- Air quality 2/10 Low 1 unhealthy d/yr today · 1 by 30 yrs out
Nearby sold comps map
Loading sold comps map…
Walkable amenities ~0.75 mi
Loading nearby amenities…
Taxation est. · year 1
- Rental income
- $15,167
- − Mortgage interest
- −$8,794
- − Property taxes
- −$1,279
- − Insurance
- −$785
- − Repairs & maintenance
- −$1,213
- − Management
- −$1,213
- − Depreciation
- −$4,567
- Taxable loss
- −$2,686
- Est. tax savings @ 24.0%
- +$645
- After-tax cash flow
- $682/yr
For passive investors: Depreciation is non-cash, so a rental often shows a tax loss while cash-flowing — sheltering income. Rental losses are passive: they offset passive income freely, and up to $25,000/yr can offset ordinary (W-2) income if you actively participate and your MAGI is under $100k (phasing out to $0 by $150k); unused losses carry forward. On sale, claimed depreciation is recaptured at up to 25%, and gains may owe capital-gains tax (a 1031 exchange can defer both). Figures are a year-1 estimate at your 24.0% rate — not tax advice; consult a CPA.
Schools (NCES district)
- District
- Sidney City
- NCES district ID
- 3910003
- Math proficiency
- 46% ▼ -14.00%
- Reading proficiency
- 52% ▼ -6.00%
- Median HH income
- $45,974
- Composite
- 41.55/100
- National rank
- #3443
- State rank
- #454 of 656 in OH
Livability — Sidney
- Score
- 76/100
- State rank
- #220
- US rank
- #3412
Category grades
Schools grade is shown separately in the Schools card above.
Census & demographics
- Census place
- Sidney, OH
- County
- Shelby · 44,840 people
- City population
- 28,955
- Population (ZIP)
- 28,955
- Household income
- $66,044
- Rent vs Own
- Severe rent burden
- 5.7
Population outlook (Shelby County) Hauer SSP2
- Today (2025)
- 47,264 people
- By 2030
- 45,935 · -2.8%
- By 2040
- 42,786 · -9.5%
- By 2050
- 38,981 · -17.5%
- By 2075
- 30,225 · -36.1%
- By 2100
- 21,273 · -55.0%
Race, ethnicity, and origin ACS 2023
- Neighborhood character
- Predominantly White (90%)
- Race & ethnicity
- White 90% Two or more races 4% Black 3% Hispanic / Latino 2%
- Common ancestry
- Lithuanian 3% Slovak 1% Italian 1%
- Foreign-born
- 2% · Canada
- Languages at home
- 98% English-only · Spanish 1%
Political lean MEDSL · Shelby
- 2024 margin
- Solid R (+64.8) · D 17.2% · R 82.0%
- 2008→2024 swing
- -28.5pp toward R · 2008: -36.4pp · 2024: -64.8pp
- All cycles
- 2024: R+64.8 2020: R+63.2 2016: R+60.6 2012: R+46.0 2008: R+36.4
Not yet ingested
- Civics
- —
Market trends
- HPI YoY
- ▼ -66.62%
- Current HPI
- 264.4532
- Rent YoY
- —
- Metro
- —
- State GDP YoY
- ▲ 1.98%
- F500 in state
- 48
Industry mix (Fortune 500 HQ in OH)
| Industry | F500 HQs | Revenue |
|---|---|---|
| Insurance | 3 | $145B |
|
||
| Industrial Machinery | 3 | $49B |
|
||
| Financial Services | 3 | $24B |
|
||
| Consumer Goods | 2 | $93B |
|
||
| Aerospace / Defense | 2 | $47B |
|
||
| Utilities | 2 | $33B |
|
||
Price history
+0.0% since first listed2 events — show timeline
- 2026-06-14 Listed $157,000 Dayton MLS
- 2026-06-14 Listed $157,000 WRIST
Property tax history
+4.8%/yrLatest (2025): $1,279 · -2.3% YoY. Source: county tax records.
Cash-flow waterfall
monthlySold comps — $/sqft
last 12 mo · ≤1 miLoading sold comps…