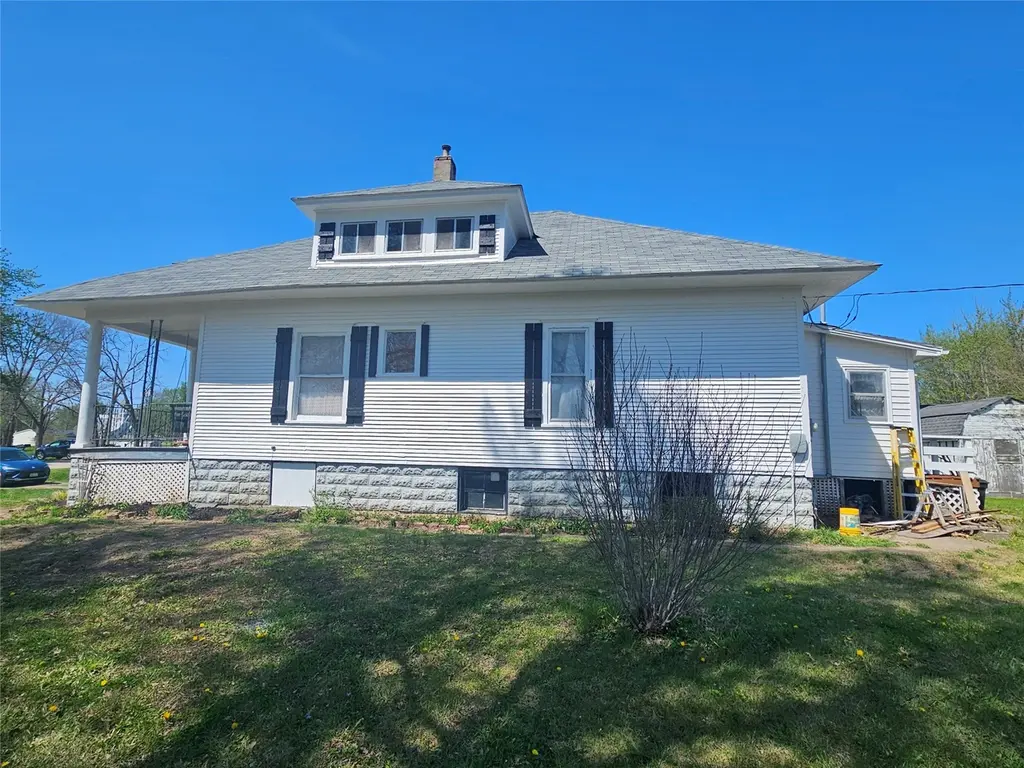
303 S Central Ave · Allerton, IA
Flood risk 1/10 · Minimal
- FEMA flood zone
- X (unshaded)
- Chance of flooding over 30 yrs
- 0.0%
- Est. flood insurance / yr
- $473 – $860
Fire risk 5/10 · Moderate
- Est. fire insurance / yr
- $902 – $1,676
Heat risk 3/10 · Minor
- Hot days now (above 102°F)
- 7 days/yr
- Hot days in 30 yrs
- 15 days/yr
Wind risk 2/10 · Minimal
- Chance of severe wind over 30 yrs
- —
Air-quality risk 2/10 · Minimal
- Unhealthy air days now
- 0 days/yr
- Unhealthy air days in 30 yrs
- 2 days/yr
Risk factors via First Street. Map © Google.
Why this score? — see what drove the A- grade
The composite is a weighted blend of 9 inputs, each scored 0–100. Each bar is that input's sub-score; the figure is the points it added to the 100-point composite (weight × sub-score).
- Cash flow +30.0/30.0
- ARV discount +11.4/15.0
- 1% rule +10.0/10.0
- DSCR +10.0/10.0
- Appreciation +9.5/10.0
- Schools +6.0/10.0
- Livability +3.0/5.0
- Rent growth +2.5/5.0
- Condition / age +2.5/5.0
$64,950
🖨 Deal sheet 📄 Offer letter ✓ Due diligence
Listing remarks MLS
This classic Cape Cod home features 2 bedrooms, 1 bath, and is located in the quiet small town of Allerton, IA. This affordable property has spacious rooms, that with a little work, you can personalize to make it your dream home. The inviting front porch is perfect to enjoy those summer evenings. Inside, you will find an open layout for living and dining area. The main floor sizable bedroom features pocket doors and plenty of closet space. Kitchen has a very functional layout. A full bath and laundry are conveniently located on the main level. The upstairs has potential for your vision to shine through. There is abundant closet space upstairs and one large room, keep it open or divide into multiple bedrooms. Enjoy a large backyard and nice deck area to relax.
Key facts
- 0.26 acre lot
- Built 1930
- Listed 61 days
Neighborhood map
What this means for you Summary
Snapshot
- This is a 3-bed/1.0-bath single-family listed at $65k.
Deal economics
- At list price, monthly cash flow is $434 ($5k/yr) — positive.
- The deal already cash-flows at list — no discount required.
- Meets the 1% rule at list price ($1k rent vs $65k).
- Recommended offer: $61k (6.0% below list) — sets the bar for market timing.
Location & tenants
- Location reads 59/100 on livability (#857 in IA) — a working-class tenant base; expect higher turnover. Strengths: cost of living A+, housing A+; Watch: crime D+, schools F, amenities F.
- Wayne Community School District (rural): math 69% / reading 74% proficiency, ranked #139 of 289 in IA (top 48%) — strong family-tenant draw, lease renewals of 3-5y typical.
- Market conditions: 4 active listings in the ZIP; 6 units permitted in Wayne County in 2024 (0 in 5+ unit buildings).
Forward outlook
- In year one you build about $6k of equity ($450 loan paydown + $6k appreciation (9.1% local appreciation)).
- Wayne County population projected to shrink 8% by 2050 — rents likely to lag national; underwrite the cash flow, not the appreciation.
- At projected returns (9.1% appreciation + 3.0% rent growth), your $18k cash investment doubles in ~2 years — after that, you're playing with house money.
- By year 6, paydown + projected appreciation supports a ~$37k cash-out refi (75% LTV) — recoverable capital for the next deal without selling this one.
Negotiation context
- It's been on market 62 days — a 6% lower offer ($61k) is reasonable based on typical stale-listing flexibility.
- 2 sale attempts with the ask held roughly flat each time — persistent listings suggest the price (not the market) is what's stuck; bring a comps-based counter.
Risks & watch-outs
- Watch-outs: built in 1930 — expect roof / HVAC / electrical / plumbing capex.
- Climate carrying-cost: moderate wildfire risk — expect insurance premiums to compound above CPI over the hold.
Questions for the listing agent
- It's been on market 62 days. Have you received any prior offers? Is the seller open to a 6% concession, seller financing, or rate buy-down credit?
- Built in 1930 — when were the roof, HVAC, electrical panel, plumbing, and water heater last replaced?
- Why hasn't it sold? Are there any deal-killer items the seller is aware of (foundation, flood, title, zoning, code violations)?
- Is there a deadline driving the sale (1031 exchange, divorce, estate, relocation)? That informs how much negotiation room exists.
- Schools are F-rated, which usually means shorter tenancies and higher turnover. Who's the typical renter profile here, and what's been the actual vacancy rate?
- Crime grade is D in this area — have there been break-ins, vandalism, or insurance claims at this property in the last 3 years? What carrier currently insures it and at what premium?
- What's the average days-on-market for RENTAL listings here right now (not sales)? A rising rental-DOM trend means longer vacancies and softer asking-rent achievability than the comps imply.
- What's the recent tenant-quality profile in this submarket — average credit score on applications, eviction rate, late-payment / NSF rate, and stable-employment percentage? A property-management company in the area should have these aggregated.
- How much new for-sale + rental construction is in the pipeline within 1–3 miles? Heavy new supply typically softens prices + rents 12–24 months out; constrained supply supports both.
Investment metrics
- 1% rule
- 1.69% ✓
- Cap rate
- 14.31%
- Cash-on-cash
- 28.62%
- DSCR
- 2.27
- GRM
- 4.9
CMA / ARV
- ARV (median comp)
- $71,178
- List price
- $64,950
- Delta
- -8.75%
- Verdict
- FAIR
- Comps
- 5 within 1.0 mi
Projected returns pro-forma
9.06% appreciation · 3.0% rent growth · sell at horizon
- IRR
- 44.5%
- Equity multiple
- 4.24×
- Total profit
- $58,891
- Equity at exit
- $54,138
- IRR
- 39.2%
- Equity multiple
- 9.30×
- Total profit
- $150,859
- Equity at exit
- $112,390
Cash invested: $18,186 (down + closing). Projections, not guarantees.
Landlord ↔ Tenant lean methodology
- Overall (STATE)
- 83 Strongly Landlord-Friendly
- State Iowa
- 83 Strongly Landlord-Friendly · R+6
- County
- — inherits STATE
- City
- — inherits STATE
ZIP-level market 50008
- Home prices YoY
- 5.3%
- Active inventory
- 4
- Price-to-rent
- 4.9×
Monthly cashflow live
- Estimated rent
- $1,098 medium interval (Pro) →
- Mortgage (P&I)
- −$341
- Tax from tax record
- −$66 /mo · $792/yr
- Insurance
- −$27
- HOA
- −$0
- Vacancy / Maint / Mgmt
- −$231
- Net cashflow
- $434
Break-even live
UW: 25.0% down · 7.5% · 30yr · 1.5% tax · 5.0% vac · 8.0% maint · 8.0% mgmt
Financing live
Cash to close
- Down payment
- $16,238
- Closing costs
- $1,948
- Reserves months
- —
- Total cash needed
- —
Loan-product check · same deal, 3 products live
Conventional
25% down · 7.5% · 30yr
- Down + closing
- —
- Monthly P&I
- —
- Monthly cashflow
- —
- DSCR
- —
- Eligible?
- —
Personal DTI + credit; lowest rate.
DSCR
20% down · 8.5% · 30yr
- Down + closing
- —
- Monthly P&I
- —
- Monthly cashflow
- —
- DSCR
- —
- Eligible?
- —
No personal income docs; deal must DSCR.
Hard money
10% down · 12.0% · 12mo
- Down + closing
- —
- Monthly P&I
- —
- Monthly cashflow
- —
- DSCR
- —
- Eligible?
- —
Short-term bridge; refi at stabilization.
Listing history 19 events
-
2026-06-18days on market $64,950 Active 62 DOM
-
2026-06-17days on market $64,950 Active 61 DOM
-
2026-06-16days on market $64,950 Active 60 DOM
-
2026-06-15days on market $64,950 Active 59 DOM
-
2026-06-13days on market $64,950 Active 57 DOM
-
2026-06-12days on market $64,950 Active 56 DOM
-
2026-06-09days on market $64,950 Active 53 DOM
-
2026-06-08days on market $64,950 Active 52 DOM
-
2026-06-07days on market $64,950 Active 51 DOM
-
2026-06-04days on market $64,950 Active 47 DOM
-
2026-06-02days on market $64,950 Active 46 DOM
-
2026-06-01days on market $64,950 Active 45 DOM
-
2026-05-31days on market $64,950 Active 44 DOM
-
2026-05-31days on market $64,950 Active 43 DOM
-
2026-04-17$64,950 Active 769-char remark
Show marketing remark (769 chars)
This classic Cape Cod home features 2 bedrooms, 1 bath, and is located in the quiet small town of Allerton, IA. This affordable property has spacious rooms, that with a little work, you can personalize to make it your dream home. The inviting front porch is perfect to enjoy those summer evenings. Inside, you will find an open layout for living and dining area. The main floor sizable bedroom features pocket doors and plenty of closet space. Kitchen has a very functional layout. A full bath and laundry are conveniently located on the main level. The upstairs has potential for your vision to shine through. There is abundant closet space upstairs and one large room, keep it open or divide into multiple bedrooms. Enjoy a large backyard and nice deck area to relax.
-
2025-12-17historical
-
2025-09-30price $69,000
-
2025-07-29price $74,000
-
2025-06-18$79,000 Active
ⓘ Source: listings_history table (triggers on properties + properties_extension) + one-shot
backfill from property_details.listing_events for pre-trigger history.
Tax reassessment forecast IA · Partial reset (capped growth)
- Current annual tax
- $792 · $66/mo
- Projected year-2 tax
- $906 · $75/mo
- Expected delta
- +$114/yr (+$9/mo · 14.4%)
ⓘ Screening estimate from a state-policy table — verify with the county assessor before closing.
Climate risk First Street
- Flood 1/10 Low FEMA zone X (unshaded) · 0% chance over 30 yrs
- Wildfire 5/10 Major
- Heat 3/10 Moderate 7 d/yr ≥102°F today · 15 d/yr by 30 yrs out
- Wind 2/10 Low
- Air quality 2/10 Low 0 unhealthy d/yr today · 2 by 30 yrs out
Nearby sold comps map
Loading sold comps map…
Walkable amenities ~0.75 mi
Loading nearby amenities…
Taxation est. · year 1
- Rental income
- $13,175
- − Mortgage interest
- −$3,638
- − Property taxes
- −$792
- − Insurance
- −$325
- − Repairs & maintenance
- −$1,054
- − Management
- −$1,054
- − Depreciation
- −$1,889
- Taxable income
- $4,423
- Est. tax owed @ 24.0%
- −$1,061
- After-tax cash flow
- $4,143/yr
For passive investors: Depreciation is non-cash, so a rental often shows a tax loss while cash-flowing — sheltering income. Rental losses are passive: they offset passive income freely, and up to $25,000/yr can offset ordinary (W-2) income if you actively participate and your MAGI is under $100k (phasing out to $0 by $150k); unused losses carry forward. On sale, claimed depreciation is recaptured at up to 25%, and gains may owe capital-gains tax (a 1031 exchange can defer both). Figures are a year-1 estimate at your 24.0% rate — not tax advice; consult a CPA.
Schools (NCES district)
- District
- Wayne Community School District
- NCES district ID
- 1930560
- Math proficiency
- 69% ▼ -7.00%
- Reading proficiency
- 74% ▲ 4.00%
- Median HH income
- $40,872
- Composite
- 59.73/100
- National rank
- #902
- State rank
- #139 of 289 in IA
Livability — Allerton
- Score
- 59/100
- State rank
- #857
- US rank
- #19829
Category grades
Schools grade is shown separately in the Schools card above.
Census & demographics
- Census place
- Allerton, IA
- Population (ZIP)
- 759
Population outlook (Wayne County) Hauer SSP2
- Today (2025)
- 6,213 people
- By 2030
- 6,109 · -1.7%
- By 2040
- 5,926 · -4.6%
- By 2050
- 5,716 · -8.0%
- By 2075
- 5,502 · -11.4%
- By 2100
- 4,890 · -21.3%
Race, ethnicity, and origin ACS 2023
- Neighborhood character
- Predominantly White (94%)
- Race & ethnicity
- White 94% Two or more races 6%
- Common ancestry
- Slovak 8% Iranian 2%
Political lean MEDSL · Wayne
- 2024 margin
- Solid R (+57.2) · D 20.6% · R 77.8% · Other 1.6%
- 2008→2024 swing
- -50.2pp toward R · 2008: -7.0pp · 2024: -57.2pp
- All cycles
- 2024: R+57.2 2020: R+51.8 2016: R+46.2 2012: R+11.5 2008: R+7.0
Not yet ingested
- Civics
- —
Market trends
- HPI YoY
- ▲ 9.06%
- Current HPI
- 181.4973
- Rent YoY
- —
- Metro
- —
- State GDP YoY
- ▲ 2.48%
- F500 in state
- 4
Industry mix (Fortune 500 HQ in IA)
| Industry | F500 HQs | Revenue |
|---|---|---|
| Financial Services | 1 | $16B |
|
||
| Retail / Convenience | 1 | $15B |
|
||
Price history
-17.8% since first listed5 events — show timeline
- 2026-04-17 Listed $64,950 DMMLS
- 2025-12-17 Listing Removed — DMMLS
- 2025-09-30 Price Changed $69,000 DMMLS
- 2025-07-29 Price Changed $74,000 DMMLS
- 2025-06-18 Listed $79,000 DMMLS
Property tax history
+8.3%/yrLatest (2025): $792 · +3.9% YoY. Source: county tax records.
Cash-flow waterfall
monthlySold comps — $/sqft
last 12 mo · ≤1 miLoading sold comps…