 🏷️ Likely Rental
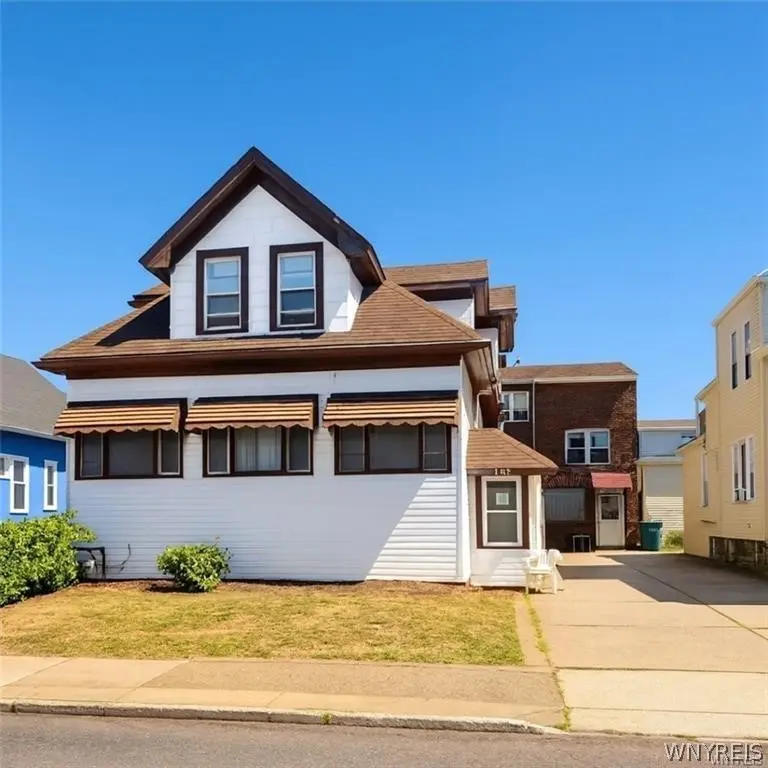
2961 Bailey Ave · Buffalo, NY
Flood risk 1/10 · Minimal
- FEMA flood zone
- X (unshaded)
- Chance of flooding over 30 yrs
- 0.0%
- Est. flood insurance / yr
- $473 – $860
Fire risk 1/10 · Minimal
- Est. fire insurance / yr
- $691 – $1,283
Heat risk 3/10 · Minor
- Hot days now (above 93°F)
- 7 days/yr
- Hot days in 30 yrs
- 15 days/yr
Wind risk 1/10 · Minimal
- Chance of severe wind over 30 yrs
- —
Air-quality risk 3/10 · Minor
- Unhealthy air days now
- 2 days/yr
- Unhealthy air days in 30 yrs
- 3 days/yr
Risk factors via First Street. Map © Google.
Why this score? — see what drove the C grade
The composite is a weighted blend of 9 inputs, each scored 0–100. Each bar is that input's sub-score; the figure is the points it added to the 100-point composite (weight × sub-score).
- Cash flow +21.3/30.0
- ARV discount +15.0/15.0
- DSCR +6.8/10.0
- 1% rule +4.3/10.0
- Livability +3.9/5.0
- Schools +3.3/10.0
- Rent growth +2.7/5.0
- Condition / age +2.5/5.0
- Appreciation +0.0/10.0
$499,900
🖨 Deal sheet 📄 Offer letter ✓ Due diligence
Multi-family units
County records classify this as Multi-Family (5+ Unit). Listing-text estimate: 1 unit. estimate disagrees with records
5+ unit building — per-unit beds/baths from public records are typically unavailable; the breakdown below (if shown) is an estimate from the listing text.
Listing remarks MLS
2961 Bailey Ave – Prime Investment Opportunity! Discover a well-maintained multi-family property in the heart of Buffalo, offering 10 income-generating units including a mix of one-bedroom, two-bedroom, three-bedroom, and a studio apartment. With a strong rental history and all units currently occupied, this property provides immediate cash flow and long-term stability for investors. Each apartment is spacious and designed for comfortable living, with tenants responsible for their own deposits. Current rents range from $650 to $900 per month, bringing in a solid monthly gross income of $8,100 and an annual gross potential of $97,200. Located on a convenient transit corridor, 2961 Bailey Ave is close to shopping, schools, and public transportation, making it attractive to renters year-round. Whether you’re expanding your portfolio or seeking your next high-performing asset, this property is a turnkey investment with consistent returns. Don't wait. Don't wait to lose this opportunity to own this cash-cow investment property. Showing starts immediately!
Key facts
- Immediate cash flow
- Long-term stability
- 4,905 sq ft lot
Tags
Neighborhood map
What this means for you Summary
Snapshot
- This is a 10-bed/?-bath multifamily listed at $500k.
Deal economics
- At list price, monthly cash flow is $735 ($9k/yr) — positive.
- The deal already cash-flows at list — no discount required.
- To meet the 1% rule (rent ≥ 1% of price), the offer needs to be $465k (7.0% below list).
- Recommended offer: $465k (7.0% below list) — sets the bar for 1% rule.
Location & tenants
- Location reads 77/100 on livability (#195 in NY, #3,011 nationally) — a middle-class / working-renter tenant base. Strengths: commute A+, housing A+, health & safety A+; Watch: crime F, employment D-.
- Buffalo City School District (urban): math 41% / reading 40% proficiency, ranked #535 of 590 in NY (top 91%) — families likely to look elsewhere, expect single-tenant / working-renter base with shorter leases; 75% free/reduced lunch — lower-income household profile, screen leases tightly.
- Market conditions: Rents flat; 237 active listings in the ZIP; lower-income renter base — watch delinquency; 1,244 units permitted in Erie County in 2024 (563 in 5+ unit buildings).
- At $4,650/mo this rent would consume 124% of the median local household income ($45k/yr) (locally 2873% of renters already pay >50% of income on rent) — very limited rent-growth headroom before tenants either downsize or default.
Forward outlook
- Local home prices are declining (-3.0%/yr); year-one equity from $3k of loan paydown is wiped out by about $15k of value loss. Plan a longer hold.
Negotiation context
- It's been on market 54 days — a 3% lower offer ($485k) is reasonable based on typical stale-listing flexibility.
- 3 sale attempts since 4y ago with the ask held roughly flat each time — persistent listings suggest the price (not the market) is what's stuck; bring a comps-based counter.
- Current owner paid $265k; list at $500k implies a 89% gain — meaningful room to come down on a strong offer.
Risks & watch-outs
- Watch-outs: built in 1936 — expect roof / HVAC / electrical / plumbing capex.
Questions for the listing agent
- It's been on market 54 days. Have you received any prior offers? Is the seller open to a 7% concession, seller financing, or rate buy-down credit?
- Built in 1936 — when were the roof, HVAC, electrical panel, plumbing, and water heater last replaced?
- Is there a deadline driving the sale (1031 exchange, divorce, estate, relocation)? That informs how much negotiation room exists.
- Crime grade is F in this area — have there been break-ins, vandalism, or insurance claims at this property in the last 3 years? What carrier currently insures it and at what premium?
- What's the average days-on-market for RENTAL listings here right now (not sales)? A rising rental-DOM trend means longer vacancies and softer asking-rent achievability than the comps imply.
- What's the recent tenant-quality profile in this submarket — average credit score on applications, eviction rate, late-payment / NSF rate, and stable-employment percentage? A property-management company in the area should have these aggregated.
- How much new apartment / multifamily construction is in the pipeline within 1–3 miles? Heavy new supply (>2% of stock underway) typically softens rents 12–24 months out; light construction supports rent growth.
Investment metrics
- 1% rule
- 0.93% ✗
- Cap rate
- 8.06%
- Cash-on-cash
- 6.30%
- DSCR
- 1.28
- GRM
- 9.0
CMA / ARV
- ARV (median comp)
- $837,176
- List price
- $499,900
- Delta
- -40.29%
- Verdict
- UNDERPRICED
- Comps
- 3 within 2.0 mi
Projected returns pro-forma
-3.0% appreciation · 0.67% rent growth · sell at horizon
- IRR
- -9.0%
- Equity multiple
- 0.68×
- Total profit
- $-45,073
- Equity at exit
- $74,537
- IRR
- -2.5%
- Equity multiple
- 0.85×
- Total profit
- $-21,671
- Equity at exit
- $43,222
Cash invested: $139,972 (down + closing). Projections, not guarantees.
Landlord ↔ Tenant lean methodology
- Overall (STATE)
- 15 Strongly Tenant-Friendly
- State New York
- 15 Strongly Tenant-Friendly · D+10
- County
- — inherits STATE
- City
- — inherits STATE
ZIP-level market 14215
- Home prices YoY
- -30.0%
- Rents YoY
- 0.7%
- Active inventory
- 237
- Price-to-rent
- 40.1×
Monthly cashflow live
- Estimated rent
- $4,650 high interval (Pro) →
- Mortgage (P&I)
- −$2,622
- Tax from tax record
- −$108 /mo · $1,300/yr
- Insurance
- −$208
- HOA
- −$0
- Vacancy / Maint / Mgmt
- −$976
- Net cashflow
- $735
Break-even live
4-unit breakdown (identical units grouped — click to expand)
| Units | Beds | Baths | Est. rent |
|---|---|---|---|
| 2× units | 1 | 1 | $2,076 |
| #1 | 1 | 1 | $1,038 |
| #4 | 1 | 1 | $1,038 |
| 1× unit | 2 | 1 | $1,227 |
| 1× unit | 3 | 1 | $1,346 |
| Total (4 units) | $4,650 | ||
UW: 25.0% down · 7.5% · 30yr · 1.5% tax · 5.0% vac · 8.0% maint · 8.0% mgmt
Financing live
Cash to close
- Down payment
- $124,975
- Closing costs
- $14,997
- Reserves months
- —
- Total cash needed
- —
Loan-product check · same deal, 3 products live
Conventional
25% down · 7.5% · 30yr
- Down + closing
- —
- Monthly P&I
- —
- Monthly cashflow
- —
- DSCR
- —
- Eligible?
- —
Personal DTI + credit; lowest rate.
DSCR
20% down · 8.5% · 30yr
- Down + closing
- —
- Monthly P&I
- —
- Monthly cashflow
- —
- DSCR
- —
- Eligible?
- —
No personal income docs; deal must DSCR.
Hard money
10% down · 12.0% · 12mo
- Down + closing
- —
- Monthly P&I
- —
- Monthly cashflow
- —
- DSCR
- —
- Eligible?
- —
Short-term bridge; refi at stabilization.
Listing history 23 events
-
2026-06-18days on market $499,900 Active 54 DOM
-
2026-06-17days on market $499,900 Active 53 DOM
-
2026-06-16days on market $499,900 Active 52 DOM
-
2026-06-15days on market $499,900 Active 51 DOM
-
2026-06-13days on market $499,900 Active 49 DOM
-
2026-06-13days on market $499,900 Active 48 DOM
-
2026-06-10days on market $499,900 Active 46 DOM
-
2026-06-09days on market $499,900 Active 45 DOM
-
2026-06-08days on market $499,900 Active 44 DOM
-
2026-06-07days on market $499,900 Active 43 DOM
-
2026-06-03days on market $499,900 Active 39 DOM
-
2026-06-02days on market $499,900 Active 38 DOM
-
2026-06-01days on market $499,900 Active 37 DOM
-
2026-05-31days on market $499,900 Active 36 DOM
-
2026-04-25$499,900 Active 1078-char remark
Show marketing remark (1078 chars)
2961 Bailey Ave – Prime Investment Opportunity! Discover a well-maintained multi-family property in the heart of Buffalo, offering 10 income-generating units including a mix of one-bedroom, two-bedroom, three-bedroom, and a studio apartment. With a strong rental history and all units currently occupied, this property provides immediate cash flow and long-term stability for investors. Each apartment is spacious and designed for comfortable living, with tenants responsible for their own deposits. Current rents range from $650 to $900 per month, bringing in a solid monthly gross income of $8,100 and an annual gross potential of $97,200. Located on a convenient transit corridor, 2961 Bailey Ave is close to shopping, schools, and public transportation, making it attractive to renters year-round. Whether you’re expanding your portfolio or seeking your next high-performing asset, this property is a turnkey investment with consistent returns. Don't wait. Don't wait to lose this opportunity to own this cash-cow investment property. Showing starts immediately!
-
2025-08-17$499,900 Active
-
2022-10-25soldstatus $265,000
-
2022-10-24soldstatus $265,000 Closed Sale or Rented
-
2022-10-12status Pending Sale
-
2022-08-10historical Continue to Show- Under Contract
-
2022-07-22price $325,000
-
2022-06-17price $375,000
-
2022-05-09$425,000 Active
ⓘ Source: listings_history table (triggers on properties + properties_extension) + one-shot
backfill from property_details.listing_events for pre-trigger history.
Tax reassessment forecast NY · Partial reset (capped growth)
- Current annual tax
- $1,300 · $108/mo
- Projected year-2 tax
- $4,874 · $406/mo
- Expected delta
- +$3,574/yr (+$298/mo · 274.9%)
ⓘ Screening estimate from a state-policy table — verify with the county assessor before closing.
Climate risk First Street
- Flood 1/10 Low FEMA zone X (unshaded) · 0% chance over 30 yrs
- Wildfire 1/10 Low
- Heat 3/10 Moderate 7 d/yr ≥93°F today · 15 d/yr by 30 yrs out
- Wind 1/10 Low
- Air quality 3/10 Moderate 2 unhealthy d/yr today · 3 by 30 yrs out
Nearby sold comps map
Loading sold comps map…
Walkable amenities ~0.75 mi
Loading nearby amenities…
Taxation est. · year 1
- Rental income
- $55,800
- − Mortgage interest
- −$28,002
- − Property taxes
- −$1,300
- − Insurance
- −$2,500
- − Repairs & maintenance
- −$4,464
- − Management
- −$4,464
- − Depreciation
- −$14,543
- Taxable income
- $528
- Est. tax owed @ 24.0%
- −$127
- After-tax cash flow
- $8,697/yr
For passive investors: Depreciation is non-cash, so a rental often shows a tax loss while cash-flowing — sheltering income. Rental losses are passive: they offset passive income freely, and up to $25,000/yr can offset ordinary (W-2) income if you actively participate and your MAGI is under $100k (phasing out to $0 by $150k); unused losses carry forward. On sale, claimed depreciation is recaptured at up to 25%, and gains may owe capital-gains tax (a 1031 exchange can defer both). Figures are a year-1 estimate at your 24.0% rate — not tax advice; consult a CPA.
Schools (NCES district)
- District
- Buffalo City School District
- NCES district ID
- 3605850
- Math proficiency
- 41% ▲ 11.00%
- Reading proficiency
- 40% ▲ 7.00%
- Median HH income
- $31,665
- Composite
- 33.17/100
- National rank
- #5544
- State rank
- #535 of 590 in NY
Livability — Buffalo
- Score
- 77/100
- State rank
- #195
- US rank
- #3011
Category grades
Schools grade is shown separately in the Schools card above.
Census & demographics
- Census place
- Buffalo, NY
- County
- Erie County · 714,559 people
- City population
- 440,021
- Metro
- Buffalo-Cheektowaga, NY
- Population (ZIP)
- 42,524
- Household income
- $44,955
- Rent vs Own
- Severe rent burden
- 2873.0
Population outlook (Erie County) Hauer SSP2
- Today (2025)
- 933,037 people
- By 2030
- 935,181 · +0.2%
- By 2040
- 928,531 · -0.5%
- By 2050
- 905,725 · -2.9%
- By 2075
- 834,037 · -10.6%
- By 2100
- 708,033 · -24.1%
Race, ethnicity, and origin ACS 2023
- Neighborhood character
- Predominantly Black (67%)
- Race & ethnicity
- Black 67% White 15% Asian 7% Hispanic / Latino 6% Two or more races 6%
- Hispanic origin (detail)
- Puerto Rican 4%
- Common ancestry
- Romanian 4% Lithuanian 1% Italian 1%
- Foreign-born
- 9% · Canada, China
- Languages at home
- 88% English-only · Other Indo-European 4% Spanish 4% Chinese 1%
Political lean MEDSL · Erie
- 2024 margin
- Lean D (+9.7) · D 54.8% · R 45.2%
- 2008→2024 swing
- -7.9pp toward R · 2008: 17.5pp · 2024: 9.7pp
- All cycles
- 2024: D+9.7 2020: D+14.7 2016: D+4.8 2012: D+15.6 2008: D+17.5
Not yet ingested
- Civics
- —
Market trends
- HPI YoY
- ▼ -126.29%
- Current HPI
- 295.2966
- Rent YoY
- ▲ 0.67%
- Metro
- Buffalo-Cheektowaga, NY
- State GDP YoY
- ▲ 2.60%
- F500 in state
- 92
Industry mix (Fortune 500 HQ in NY)
| Industry | F500 HQs | Revenue |
|---|---|---|
| Financial Services | 10 | $950B |
|
||
| Consumer Goods | 9 | $162B |
|
||
| Insurance | 4 | $225B |
|
||
| Telecommunications | 2 | $144B |
|
||
| Pharmaceuticals | 2 | $112B |
|
||
| Media / Entertainment | 2 | $69B |
|
||
Price history
+17.6% since first listed9 events — show timeline
- 2026-04-25 Listed $499,900 WNYREIS
- 2025-08-17 Listed $499,900 WNYREIS
- 2022-10-25 Sold (Public Records) $265,000 Public Records
- 2022-10-24 Sold (MLS) $265,000 WNYREIS
- 2022-10-12 Pending — WNYREIS
- 2022-08-10 Contingent — WNYREIS
- 2022-07-22 Price Changed $325,000 WNYREIS
- 2022-06-17 Price Changed $375,000 WNYREIS
- 2022-05-09 Listed $425,000 WNYREIS
Property tax history
+11.8%/yrLatest (2025): $1,300 · +0.0% YoY. Source: county tax records.
Cash-flow waterfall
monthlySold comps — $/sqft
last 12 mo · ≤1 miLoading sold comps…