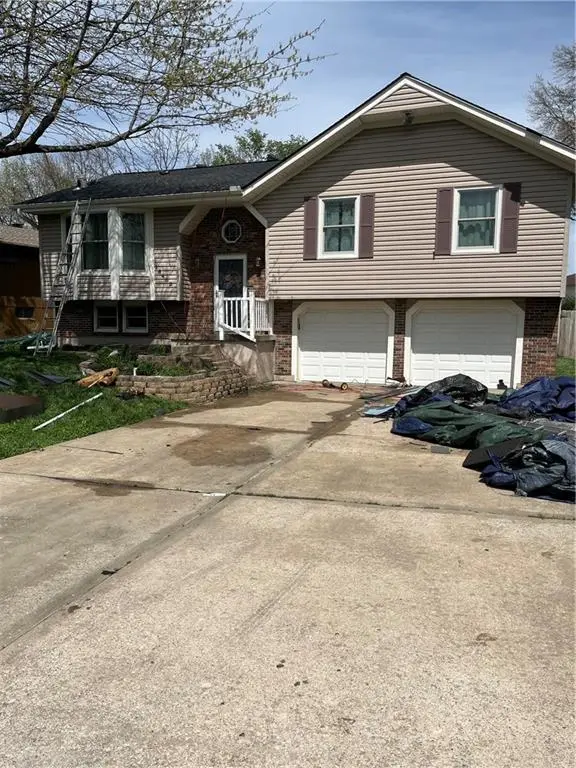
16403 Rebecca Ln · Belton, MO
Flood risk 1/10 · Minimal
- FEMA flood zone
- X (unshaded)
- Chance of flooding over 30 yrs
- 0.0%
- Est. flood insurance / yr
- $473 – $860
Fire risk 1/10 · Minimal
- Est. fire insurance / yr
- $1,054 – $1,958
Heat risk 4/10 · Minor
- Hot days now (above 107°F)
- 7 days/yr
- Hot days in 30 yrs
- 17 days/yr
Wind risk 2/10 · Minimal
- Chance of severe wind over 30 yrs
- —
Air-quality risk 2/10 · Minimal
- Unhealthy air days now
- 2 days/yr
- Unhealthy air days in 30 yrs
- 2 days/yr
Risk factors via First Street. Map © Google.
Why this score? — see what drove the C grade
The composite is a weighted blend of 9 inputs, each scored 0–100. Each bar is that input's sub-score; the figure is the points it added to the 100-point composite (weight × sub-score).
- Cash flow +19.0/30.0
- ARV discount +15.0/15.0
- DSCR +6.0/10.0
- 1% rule +4.7/10.0
- Rent growth +3.8/5.0
- Livability +3.8/5.0
- Schools +3.0/10.0
- Condition / age +2.5/5.0
- Appreciation +0.0/10.0
$205,000
🖨 Deal sheet 📄 Offer letter ✓ Due diligence
Listing remarks MLS
Cute home ready to move in. Pride of ownership shows. Kitchen has lots of open space. Beautiful masonry fireplace. Finished Basement. Swingset does not stay. Refrigerator in kichen stays. SALE HAS BEEN APPROVED BY WELLS FARGO approved by Wells Fargo.
Key facts
- 9,670 sq ft lot
- 2 garage spots
- Pool
Neighborhood map
What this means for you Summary
Snapshot
- This is a 3-bed/2.0-bath single-family listed at $205k.
Deal economics
- At list price, monthly cash flow is $215 ($3k/yr) — positive.
- The deal already cash-flows at list — no discount required.
- To meet the 1% rule (rent ≥ 1% of price), the offer needs to be $198k (3.2% below list).
- Recommended offer: $198k (3.2% below list) — sets the bar for 1% rule.
- Cap rate 7.6% vs local median 4.7% in Belton — top-decile yield for the area; either an underpriced asset or a hidden risk that comps aren't pricing in. Stress-test before assuming the spread holds.
Location & tenants
- Location reads 76/100 on livability (#52 in MO, #3,782 nationally) — a middle-class / working-renter tenant base. Strengths: cost of living A+, housing A+, health & safety A+; Watch: crime C-, schools D+, commute F.
- Belton 124 (suburban): math 28% / reading 39% proficiency, ranked #216 of 324 in MO (top 67%) — families likely to look elsewhere, expect single-tenant / working-renter base with shorter leases.
- Market conditions: Rents rising fast (+5.2%/yr); 204 active listings in the ZIP; 13 comparable units currently listed for rent nearby; rentals at typical pace (median 24d on market — plan ~3-4 weeks tenant-placement turnaround); 588 units permitted in Cass County in 2024 (0 in 5+ unit buildings).
- This rent runs 33% of the median local income ($72k/yr) — at the standard rent-burdened threshold; future hikes will face affordability resistance.
Forward outlook
- Local home prices are declining (-3.0%/yr); year-one equity from $1k of loan paydown is wiped out by about $6k of value loss. Plan a longer hold.
- Cass County population projected to shrink 3% by 2050 — rents likely to lag national; underwrite the cash flow, not the appreciation.
Negotiation context
- Only 1 days on market — expect competitive offers; lowballing is unlikely to land.
- 3 sale attempts since 17y ago with the ask held roughly flat each time — persistent listings suggest the price (not the market) is what's stuck; bring a comps-based counter.
Questions for the listing agent
- Is there a deadline driving the sale (1031 exchange, divorce, estate, relocation)? That informs how much negotiation room exists.
- Schools are D-rated, which usually means shorter tenancies and higher turnover. Who's the typical renter profile here, and what's been the actual vacancy rate?
- What's the average days-on-market for RENTAL listings here right now (not sales)? A rising rental-DOM trend means longer vacancies and softer asking-rent achievability than the comps imply.
- What's the recent tenant-quality profile in this submarket — average credit score on applications, eviction rate, late-payment / NSF rate, and stable-employment percentage? A property-management company in the area should have these aggregated.
- How much new for-sale + rental construction is in the pipeline within 1–3 miles? Heavy new supply typically softens prices + rents 12–24 months out; constrained supply supports both.
Investment metrics
- 1% rule
- 0.97% ✗
- Cap rate
- 7.55%
- Cash-on-cash
- 4.49%
- DSCR
- 1.20
- GRM
- 8.6
CMA / ARV
- ARV (on-the-fly)
- $306,210
- Comps found
- 12
Show comp detail 12 sales within ~0.75 mi
| Address | Dist | Beds/Ba | Sqft | Sold | Price | $/sf | Match |
|---|---|---|---|---|---|---|---|
| 16402 Harris Ave | 0.16mi | 3/2.5 | 1,756 (+2%) | 5mo | $310,000 | $177 | 84 |
| 16400 Speaker Ave | 0.22mi | 4/2.5 (+1) | 1,699 (-2%) | 0mo | $330,000 | $194 | 80 |
| 16506 Greenwald Ct | 0.18mi | 3/2.0 | 1,584 (-8%) | 2mo | $275,000 | $174 | 75 |
| 16304 Hight Ave | 0.33mi | 3/2.5 | 1,589 (-8%) | 1mo | $300,000 | $189 | 68 |
| 16806 Hardee St | 0.62mi | 3/2.0 | 1,741 (+1%) | 4mo | $294,500 | $169 | 67 |
| 7803 E 162nd Ter | 0.19mi | 3/2.5 | 1,955 (+13%) | 5mo | $301,000 | $154 | 63 |
| 16205 Speaker Ave | 0.30mi | 3/2.0 | 1,512 (-13%) | 2mo | $305,000 | $202 | 63 |
| 8001 Bel Ray Dr | 0.35mi | 3/2.5 | 1,558 (-10%) | 4mo | $260,000 | $167 | 62 |
| 16704 Bradley Ave | 0.48mi | 4/3.5 (+1) | 1,802 (+4%) | 4mo | $330,000 | $183 | 57 |
| 16311 Hight Ave | 0.30mi | 4/3.0 (+1) | 1,962 (+13%) | 4mo | $249,500 | $127 | 51 |
| 7205 E 165th St | 0.57mi | 3/2.0 | 1,470 (-15%) | 0mo | $330,000 | $224 | 48 |
| 15803 Hight Ave | 0.73mi | 4/2.5 (+1) | 1,954 (+13%) | 5mo | $330,000 | $169 | 33 |
Match score weights: distance 35% · size 25% · config 20% · recency 20%. Top-matched comps best support the ARV.
Projected returns pro-forma
-3.0% appreciation · 5.17% rent growth · sell at horizon
- IRR
- -7.0%
- Equity multiple
- 0.74×
- Total profit
- $-15,117
- Equity at exit
- $30,566
- IRR
- 5.1%
- Equity multiple
- 1.41×
- Total profit
- $23,413
- Equity at exit
- $17,725
Cash invested: $57,400 (down + closing). Projections, not guarantees.
Landlord ↔ Tenant lean methodology
- Overall (STATE)
- 81 Strongly Landlord-Friendly
- State Missouri
- 81 Strongly Landlord-Friendly · R+10
- County
- — inherits STATE
- City
- — inherits STATE
ZIP-level market 64012
- Rents YoY
- 5.2%
- Active inventory
- 204
- Price-to-rent
- 8.6×
Monthly cashflow live
- Estimated rent
- $1,985 high interval (Pro) →
- Mortgage (P&I)
- −$1,075
- Tax from tax record
- −$193 /mo · $2,312/yr
- Insurance
- −$85
- HOA
- −$0
- Vacancy / Maint / Mgmt
- −$417
- Net cashflow
- $215
Break-even live
UW: 25.0% down · 7.5% · 30yr · 1.5% tax · 5.0% vac · 8.0% maint · 8.0% mgmt
Financing live
Cash to close
- Down payment
- $51,250
- Closing costs
- $6,150
- Reserves months
- —
- Total cash needed
- —
Loan-product check · same deal, 3 products live
Conventional
25% down · 7.5% · 30yr
- Down + closing
- —
- Monthly P&I
- —
- Monthly cashflow
- —
- DSCR
- —
- Eligible?
- —
Personal DTI + credit; lowest rate.
DSCR
20% down · 8.5% · 30yr
- Down + closing
- —
- Monthly P&I
- —
- Monthly cashflow
- —
- DSCR
- —
- Eligible?
- —
No personal income docs; deal must DSCR.
Hard money
10% down · 12.0% · 12mo
- Down + closing
- —
- Monthly P&I
- —
- Monthly cashflow
- —
- DSCR
- —
- Eligible?
- —
Short-term bridge; refi at stabilization.
Rent comps 13 comps
| Address | Beds | Baths | Sqft | Rent | $/sqft | DOM | Units | Dist |
|---|---|---|---|---|---|---|---|---|
| 7719 E 165th St Belton, MO | 3.0 | 2.5 | 1604 | $1,996 | $1.24 | 21d | 1 | 0.20mi |
| 16311 Hight Ave Belton, MO | 4.0 | 3.0 | 1308 | $2,285 | $1.75 | 4d | 1 | 0.30mi |
| 301 Towne Center Dr Belton, MO | 1.0–2.0 | 1.0–2.0 | 1069 | $1,799 | $1.68 | 1d | 9 | 1.15mi |
| 210 N Huntsman Blvd Raymore, MO | 4.0 | 2.5 | 1450 | $2,240 | $1.54 | 23d | 1 | 1.21mi |
| 101 N Dean Ave Raymore, MO | 1.0–3.0 | 1.0–2.0 | 1029 | $2,014 | $1.96 | 1d | 63 | 1.26mi |
| 126 Barberry Ln Raymore, MO | 3.0 | 2.0 | 1224 | $1,608 | $1.31 | 43d | 1 | 1.27mi |
| 124-130 Barberry Ln Raymore, MO | 3.0 | 2.5 | 1357 | $1,658 | $1.22 | 23d | 1 | 1.27mi |
| 124-130 Barberry Ln Raymore, MO | 3.0 | 2.5 | 1357 | $1,625 | $1.20 | 43d | 1 | 1.27mi |
| 128 Barberry Ln Raymore, MO | 3.0 | 2.0 | 1224 | $1,608 | $1.31 | 14d | 1 | 1.27mi |
| 128 Barberry Ln Raymore, MO | 3.0 | 2.0 | 1224 | $1,575 | $1.29 | 23d | 1 | 1.27mi |
| 526 N Foxridge Dr Unit 1 Raymore, MO | 3.0 | 2.5 | 1672 | $1,645 | $0.98 | 4d | 1 | 1.41mi |
| 507 N Foxridge Dr Raymore, MO | 2.0 | 2.5 | 1162 | $1,405 | $1.21 | 23d | 1 | 1.48mi |
| 507 N Foxridge Dr Raymore, MO | 2.0 | 2.5 | 1162 | $1,438 | $1.24 | 43d | 1 | 1.48mi |
Listing history 8 events
-
2026-04-13status Pending
-
2026-04-13$205,000 Active
-
2026-04-13historical $205,000
-
2009-10-14soldstatus
-
2009-10-09soldstatus 256-char remark
Show marketing remark (256 chars)
Cute home ready to move in. Pride of ownership shows. Kitchen has lots of open space. Beautiful masonry fireplace. Finished Basement. Swingset does not stay. Refrigerator in kichen stays. SALE HAS BEEN APPROVED BY WELLS FARGO approved by Wells Fargo.
-
2009-08-11$113,000 256-char remark
Show marketing remark (256 chars)
Cute home ready to move in. Pride of ownership shows. Kitchen has lots of open space. Beautiful masonry fireplace. Finished Basement. Swingset does not stay. Refrigerator in kichen stays. SALE HAS BEEN APPROVED BY WELLS FARGO approved by Wells Fargo.
-
2009-08-11historical
Show marketing remark (256 chars)
Cute home ready to move in. Pride of ownership shows. Kitchen has lots of open space. Beautiful masonry fireplace. Finished Basement. Swingset does not stay. Refrigerator in kichen stays. SALE HAS BEEN APPROVED BY WELLS FARGO approved by Wells Fargo.
-
2009-05-22$113,000
ⓘ Source: listings_history table (triggers on properties + properties_extension) + one-shot
backfill from property_details.listing_events for pre-trigger history.
Tax reassessment forecast MO · Resets to sale price
- Current annual tax
- $2,312 · $193/mo
- Projected year-2 tax
- $2,312 · $193/mo
- Expected delta
- $0/yr ($0/mo · 0.0%)
ⓘ Screening estimate from a state-policy table — verify with the county assessor before closing.
Climate risk First Street
- Flood 1/10 Low FEMA zone X (unshaded) · 0% chance over 30 yrs
- Wildfire 1/10 Low
- Heat 4/10 Moderate 7 d/yr ≥107°F today · 17 d/yr by 30 yrs out
- Wind 2/10 Low
- Air quality 2/10 Low 2 unhealthy d/yr today · 2 by 30 yrs out
Nearby sold comps map
Loading sold comps map…
Walkable amenities ~0.75 mi
Loading nearby amenities…
Taxation est. · year 1
- Rental income
- $23,818
- − Mortgage interest
- −$11,483
- − Property taxes
- −$2,312
- − Insurance
- −$1,025
- − Repairs & maintenance
- −$1,905
- − Management
- −$1,905
- − Depreciation
- −$5,964
- Taxable loss
- −$777
- Est. tax savings @ 24.0%
- +$187
- After-tax cash flow
- $2,765/yr
For passive investors: Depreciation is non-cash, so a rental often shows a tax loss while cash-flowing — sheltering income. Rental losses are passive: they offset passive income freely, and up to $25,000/yr can offset ordinary (W-2) income if you actively participate and your MAGI is under $100k (phasing out to $0 by $150k); unused losses carry forward. On sale, claimed depreciation is recaptured at up to 25%, and gains may owe capital-gains tax (a 1031 exchange can defer both). Figures are a year-1 estimate at your 24.0% rate — not tax advice; consult a CPA.
Schools (NCES district)
- District
- Belton 124
- NCES district ID
- 2904620
- Math proficiency
- 28% ▼ -9.00%
- Reading proficiency
- 39% ▼ -9.00%
- Median HH income
- $56,946
- Composite
- 29.73/100
- National rank
- #6446
- State rank
- #216 of 324 in MO
Livability — Belton
- Score
- 76/100
- State rank
- #52
- US rank
- #3782
Category grades
Schools grade is shown separately in the Schools card above.
Census & demographics
- Census place
- Belton, MO
- County
- Cass County · 65,358 people
- City population
- 29,304
- Metro
- Kansas City, MO-KS
- Population (ZIP)
- 29,304
- Household income
- $71,814
- Rent vs Own
- Severe rent burden
- 1081.0
Population outlook (Cass County) Hauer SSP2
- Today (2025)
- 105,292 people
- By 2030
- 106,109 · +0.8%
- By 2040
- 105,786 · +0.5%
- By 2050
- 102,062 · -3.1%
- By 2075
- 88,569 · -15.9%
- By 2100
- 68,293 · -35.1%
Race, ethnicity, and origin ACS 2023
- Neighborhood character
- Predominantly White (80%)
- Race & ethnicity
- White 80% Two or more races 7% Hispanic / Latino 7% Black 6% Asian 1%
- Hispanic origin (detail)
- Mexican 5%
- Common ancestry
- Italian 2% Lithuanian 2% Portuguese 2%
- Foreign-born
- 2% · Canada
- Languages at home
- 96% English-only · Spanish 2% German/W. Germanic 1% Other Asian/Pacific 1%
Political lean MEDSL · Cass
- 2024 margin
- Solid R (+32.1) · D 33.3% · R 65.4% · Other 1.3%
- 2008→2024 swing
- -12.5pp toward R · 2008: -19.6pp · 2024: -32.1pp
- All cycles
- 2024: R+32.1 2020: R+31.6 2016: R+35.9 2012: R+28.4 2008: R+19.6
Not yet ingested
- Civics
- —
Market trends
- HPI YoY
- ▼ -244.76%
- Current HPI
- 214.6157
- Rent YoY
- ▲ 5.17%
- Metro
- Kansas City, MO-KS
- State GDP YoY
- ▲ 1.84%
- F500 in state
- 20
Industry mix (Fortune 500 HQ in MO)
| Industry | F500 HQs | Revenue |
|---|---|---|
| Healthcare | 1 | $163B |
|
||
| Insurance | 1 | $21B |
|
||
| Industrial Technology | 1 | $17B |
|
||
| Retail | 1 | $16B |
|
||
| Industrial Distribution | 1 | $10B |
|
||
| Utilities | 1 | $9B |
|
||
Price history
+81.4% since first listed8 events — show timeline
- 2026-04-13 Pending — Heartland MLS as Distributed by MLS Grid
- 2026-04-13 Listed $205,000 Heartland MLS as Distributed by MLS Grid
- 2026-04-13 Coming Soon $205,000 Heartland MLS as Distributed by MLS Grid
- 2009-10-14 Sold (Public Records) — Public Records
- 2009-10-09 Sold (MLS) — Heartland MLS as Distributed by MLS Grid
- 2009-08-11 Listing Removed — Heartland MLS as Distributed by MLS Grid
- 2009-08-11 Listed $113,000 Heartland MLS as Distributed by MLS Grid
- 2009-05-22 Listed $113,000 Heartland MLS as Distributed by MLS Grid
Property tax history
+5.0%/yrLatest (2025): $2,312 · +12.8% YoY. Source: county tax records.
Cash-flow waterfall
monthlySold comps — $/sqft
last 12 mo · ≤1 miLoading sold comps…