17350 E Temple Ave #479 · South San Jose Hills, CA
Flood risk 1/10 · Minimal
- FEMA flood zone
- X (unshaded)
- Chance of flooding over 30 yrs
- 0.0%
- Est. flood insurance / yr
- $507 – $1,088
Fire risk 1/10 · Minimal
- Est. fire insurance / yr
- $659 – $1,223
Heat risk 6/10 · Moderate
- Hot days now (above 99°F)
- 7 days/yr
- Hot days in 30 yrs
- 19 days/yr
Wind risk 1/10 · Minimal
- Chance of severe wind over 30 yrs
- —
Air-quality risk 7/10 · Major
- Unhealthy air days now
- 13 days/yr
- Unhealthy air days in 30 yrs
- 14 days/yr
Risk factors via First Street. Map © Google.
Why this score? — see what drove the C+ grade
The composite is a weighted blend of 9 inputs, each scored 0–100. Each bar is that input's sub-score; the figure is the points it added to the 100-point composite (weight × sub-score).
- Cash flow +30.0/30.0
- DSCR +10.0/10.0
- 1% rule +9.0/10.0
- Schools +4.5/10.0
- Rent growth +3.8/5.0
- Livability +3.2/5.0
- Condition / age +2.5/5.0
- ARV discount +0.0/15.0
- Appreciation +0.0/10.0
$250,000
🖨 Deal sheet (PDF) 📄 Offer letter ✓ Due diligence
Listing remarks
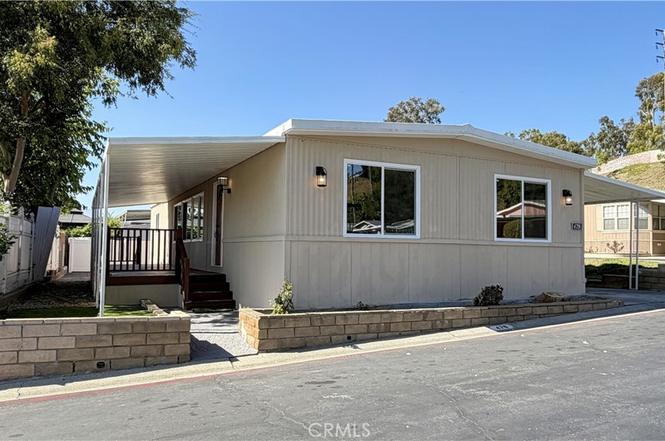
Welcome to this stunning manufacture home recently remodeled 4 bedroom, 2 bathroom in the city of La Puente with 1440 square feet of living space and parking space for 2 cars. Conveniently situated nearby the restaurants, local parks, shopping center with easy access to freeways and schools. This home was fully remodeled from top to bottom. Upgrades included: New flooring, new kitchen cabinets, counter top, lighting, new windows, new electrical, and much more. Community offers 24 hour gate guard security, club houses, 2 community pools, work out gym, and community park. MOVE IN READY!!!
Key facts
- Recently remodeled
- New flooring
- New kitchen cabinets
Tags
Property features AI
Finance
- Other: Living area source: assessor's data; Parcel number recorded
- Financial info: Land lease applies (park) with a monthly amount; Rent includes trash
- HOA & community: Part of an association; Located in Covina Hills Mobile Home Community; Community features include a park
Exterior
- Parking: Attached carport; Parking available
- Security: 24-hour security
- Utilities: Standard electric; Natural gas connected; Electricity connected; Water connected (district/public); Public sewer
- Home design: Single-story mobile home; Mobile home remains on site; Mobile dimensions approximately 24 ft by 60 ft; Facing/entry level: porch
- Construction: Year built source: assessor
- Exterior features: Vinyl fencing; Deck; Yard; Community pool
Interior
- Flooring: Vinyl flooring
- Bathrooms: 2 full bathrooms
- Heating & cooling: Central heating (furnace); Central cooling
- Interior features: One-level home with a porch entry; Turnkey condition; 24-hour security; Community spa
- Laundry & utility: Laundry in closet; Gas and electric dryer hookups
Neighborhood map
What this means for you Summary
Snapshot
- This is a 4-bed/2.0-bath manufactured listed at $250k.
Deal economics
- At list price, monthly cash flow is $1k ($13k/yr) — positive.
- The deal already cash-flows at list — no discount required.
- Meets the 1% rule at list price ($4k rent vs $250k).
- Cap rate 11.3% vs local median 3.2% in South San Jose Hills — top-decile yield for the area; either an underpriced asset or a hidden risk that comps aren't pricing in. Stress-test before assuming the spread holds.
Location & tenants
- Location reads 63/100 on livability (#449 in CA) — a middle-class / working-renter tenant base. Strengths: commute A+, housing A, employment A-; Watch: crime F, amenities F, cost of living F.
- Rowland Unified (suburban): math 40% / reading 62% proficiency, ranked #134 of 517 in CA (top 26%) — acceptable for families but not a draw, mixed tenant base, ~2y average lease.
- Zoned schools: Yorbita Elementary (410 students, 92% FRL); Giano Intermediate (489 students, 91% FRL); Nogales High (math 29% / reading 57%, grade F, #460 of 1,170 statewide, top 40%, 1,668 students, 82% FRL) — zoned schools average 88% FRL vs 56% district-wide (32 pts higher); higher-poverty schools than district average — tighter screening recommended.
- Market conditions: Rents rising fast (+5.2%/yr); 29 active listings in the ZIP; 14 comparable units currently listed for rent nearby; rentals at typical pace (median 20d on market — plan ~3-4 weeks tenant-placement turnaround); solid renter incomes; 19,697 units permitted in Los Angeles County in 2024 (9,426 in 5+ unit buildings).
- This rent runs 44% of the median local income ($95k/yr) — at the standard rent-burdened threshold; future hikes will face affordability resistance.
Forward outlook
- Local home prices are declining (-3.0%/yr); year-one equity from $2k of loan paydown is wiped out by about $8k of value loss. Plan a longer hold.
- Los Angeles County population projected at +9% by 2050 — modest demand growth; plan on rents tracking national, not racing it.
- At projected returns (-3.0% appreciation + 5.2% rent growth), your $70k cash investment doubles in ~6 years — after that, you're playing with house money.
Negotiation context
- Only 5 days on market — expect competitive offers; lowballing is unlikely to land.
Risks & watch-outs
- Climate carrying-cost: extreme-heat days projected 7→19/yr by 2055 (HVAC capex compounding) — expect insurance premiums to compound above CPI over the hold.
Questions for the listing agent
- Built in 1972 — when were the roof, HVAC, electrical panel, plumbing, and water heater last replaced?
- Is there a deadline driving the sale (1031 exchange, divorce, estate, relocation)? That informs how much negotiation room exists.
- Schools are B-rated — typically a magnet for longer-tenancy family renters. What's the average tenant stay here, and is there a school-zone premium baked into asking?
- Crime grade is F in this area — have there been break-ins, vandalism, or insurance claims at this property in the last 3 years? What carrier currently insures it and at what premium?
- What's the average days-on-market for RENTAL listings here right now (not sales)? A rising rental-DOM trend means longer vacancies and softer asking-rent achievability than the comps imply.
- What's the recent tenant-quality profile in this submarket — average credit score on applications, eviction rate, late-payment / NSF rate, and stable-employment percentage? A property-management company in the area should have these aggregated.
- How much new for-sale + rental construction is in the pipeline within 1–3 miles? Heavy new supply typically softens prices + rents 12–24 months out; constrained supply supports both.
Investment metrics
- 1% rule
- 1.40% ✓
- Cap rate
- 11.29%
- Cash-on-cash
- 17.86%
- DSCR
- 1.79
- GRM
- 5.9
CMA / ARV
- ARV (on-the-fly)
- $205,920
- Comps found
- 12
Show comp detail 12 sales within ~0.75 mi
| Address | Dist | Beds/Ba | Sqft | Sold | Price | $/sf | Match |
|---|---|---|---|---|---|---|---|
| 17350 Temple #288 | 0.05mi | 3/2.0 (-1) | 1,440 (0%) | 3mo | $145,000 | $101 | 90 |
| 17350 Temple Ave #383 | 0.05mi | 3/2.0 (-1) | 1,431 (-1%) | 8mo | $187,000 | $131 | 85 |
| 17350 Temple Ave #214 | 0.05mi | 3/2.0 (-1) | 1,456 (+1%) | 13mo | $219,000 | $150 | 80 |
| 17350 Temple 237 | 0.05mi | 3/2.0 (-1) | 1,320 (-8%) | 2mo | $189,000 | $143 | 77 |
| 17350 E Temple Ave #84 | 0.05mi | 3/2.0 (-1) | 1,344 (-7%) | 6mo | $180,000 | $134 | 76 |
| 17350 Temple Ave #320 | 0.21mi | 3/2.0 (-1) | 1,500 (+4%) | 7mo | $126,500 | $84 | 73 |
| 17350 Temple Ave #484 | 0.05mi | 3/2.0 (-1) | 1,344 (-7%) | 12mo | $276,000 | $205 | 72 |
| 17350 Temple Ave #397 | 0.05mi | 3/2.0 (-1) | 1,344 (-7%) | 13mo | $140,000 | $104 | 71 |
| 17350 Temple #411 | 0.05mi | 3/2.0 (-1) | 1,632 (+13%) | 2mo | $295,000 | $181 | 69 |
| 17350 E Temple Ave #451 | 0.05mi | 3/2.0 (-1) | 1,566 (+9%) | 12mo | $274,000 | $175 | 69 |
| 17350 E Temple Ave #405 | 0.05mi | 3/2.0 (-1) | 1,344 (-7%) | 18mo | $170,000 | $126 | 67 |
| 17350 Temple Ave #434 | 0.05mi | 3/2.0 (-1) | 1,344 (-7%) | 18mo | $219,000 | $163 | 66 |
Match score weights: distance 35% · size 25% · config 20% · recency 20%. Top-matched comps best support the ARV.
Projected returns pro-forma
-3.0% appreciation · 5.15% rent growth · sell at horizon
- IRR
- 11.8%
- Equity multiple
- 1.48×
- Total profit
- $33,645
- Equity at exit
- $37,276
- IRR
- 22.4%
- Equity multiple
- 3.12×
- Total profit
- $148,174
- Equity at exit
- $21,615
Cash invested: $70,000 (down + closing). Projections, not guarantees.
Landlord ↔ Tenant lean methodology
- Overall (STATE)
- 18 Strongly Tenant-Friendly
- State California
- 18 Strongly Tenant-Friendly · D+13
- County
- — inherits STATE
- City
- — inherits STATE
ZIP-level market 91792
- Rents YoY
- 5.2%
- Active inventory
- 29
- Price-to-rent
- 5.9×
Monthly cashflow live
- Estimated rent
- $3,506 high interval (Pro) →
- Mortgage (P&I)
- −$1,311
- Tax est. 1.5%
- −$312 /mo · $3,750/yr
- Insurance
- −$104
- HOA
- −$0
- Vacancy / Maint / Mgmt
- −$736
- Net cashflow
- $1,042
Break-even live
Sensitivity live
| Price | -10% $1,215 | -5% $1,128 | +0% $1,042 | +5% $955 | +10% $869 |
|---|---|---|---|---|---|
| Rent | -10% $765 | -5% $903 | +0% $1,042 | +5% $1,180 | +10% $1,319 |
| Rate | -1.0pp $1,168 | -0.5pp $1,105 | base $1,042 | +0.5pp $977 | +1.0pp $911 |
UW: 25.0% down · 7.5% · 30yr · 1.5% tax · 5.0% vac · 8.0% maint · 8.0% mgmt
Financing live
Cash to close
- Down payment
- $62,500
- Closing costs
- $7,500
- Reserves months
- —
- Total cash needed
- —
Loan-product check · same deal, 3 products live
Conventional
25% down · 7.5% · 30yr
- Down + closing
- —
- Monthly P&I
- —
- Monthly cashflow
- —
- DSCR
- —
- Eligible?
- —
Personal DTI + credit; lowest rate.
DSCR
20% down · 8.5% · 30yr
- Down + closing
- —
- Monthly P&I
- —
- Monthly cashflow
- —
- DSCR
- —
- Eligible?
- —
No personal income docs; deal must DSCR.
Hard money
10% down · 12.0% · 12mo
- Down + closing
- —
- Monthly P&I
- —
- Monthly cashflow
- —
- DSCR
- —
- Eligible?
- —
Short-term bridge; refi at stabilization.
Rent comps 14 comps
| Address | Beds | Baths | Sqft | Rent | $/sqft | DOM | Units | Dist |
|---|---|---|---|---|---|---|---|---|
| 2600 S Azusa Ave West Covina, CA | 1.0–3.0 | 1.0–2.0 | 934 | $3,214 | $3.44 | 7d | 12 | 0.38mi |
| 2442 S Nancy St Unit 1 West Covina, CA | 3.0 | 1.5 | 1165 | $3,345 | $2.87 | 46d | 1 | 0.52mi |
| 2100 S Lark Ellen Ave West Covina, CA | 1.0–3.0 | 1.0–2.0 | 967 | $3,200 | $3.31 | 7d | 8 | 0.92mi |
| 2452 E Brenda St West Covina, CA | 4.0 | 2.0 | 1460 | $4,095 | $2.80 | 0d | 1 | 1.00mi |
| 2013 S Brentwood Dr West Covina, CA | 4.0 | 2.0 | 1568 | $3,650 | $2.33 | 0d | 1 | 1.03mi |
| 3424 S Rachel Ave West Covina, CA | 4.0 | 2.0 | 1445 | $3,500 | $2.42 | 9d | 1 | 1.04mi |
| 2316 Cravath Ct West Covina, CA | 3.0 | 2.0 | 1335 | $3,050 | $2.28 | 19d | 1 | 1.16mi |
| 2622 E Marlena St West Covina, CA | 4.0 | 2.0 | 1579 | $3,650 | $2.31 | 46d | 1 | 1.16mi |
| 1366 Oahu St West Covina, CA | 3.0 | 3.0 | 1596 | $3,475 | $2.18 | 46d | 1 | 1.28mi |
| 1511 Wailea St West Covina, CA | 3.0 | 2.5 | 1509 | $3,400 | $2.25 | 26d | 1 | 1.29mi |
| 856 Francesca Dr Walnut, CA | 3.0 | 3.0 | 1594 | $3,900 | $2.45 | 46d | 1 | 1.30mi |
| 1818 Bauer Dr West Covina, CA | 3.0 | 2.0 | 1125 | $3,000 | $2.67 | 8d | 1 | 1.40mi |
| 684 Panorama Ln La Puente, CA | 3.0 | 3.5 | 1683 | $3,600 | $2.14 | 23d | 1 | 1.43mi |
| 684 Panorama Ln La Puente, CA | 3.0 | 3.5 | 1683 | $3,600 | $2.14 | 19d | 1 | 1.43mi |
Listing history 4 events
-
2026-06-21days on market $250,000 Active 5 DOM
-
2026-06-18days on market $250,000 Active 2 DOM
-
2026-06-17remarks 593-char remark
-
2026-06-17$250,000 Active 1 DOM
ⓘ Source: listings_history table (triggers on properties + properties_extension) + one-shot
backfill from property_details.listing_events for pre-trigger history.
Climate risk First Street
- Flood 1/10 Low FEMA zone X (unshaded) · 0% chance over 30 yrs
- Wildfire 1/10 Low
- Heat 6/10 Major 7 d/yr ≥99°F today · 19 d/yr by 30 yrs out
- Wind 1/10 Low
- Air quality 7/10 Severe 13 unhealthy d/yr today · 14 by 30 yrs out
Nearby sold comps map
Loading sold comps map…
Walkable amenities ~0.75 mi
Loading nearby amenities…
Taxation est. · year 1
- Rental income
- $42,069
- − Mortgage interest
- −$14,004
- − Property taxes
- −$3,750
- − Insurance
- −$1,250
- − Repairs & maintenance
- −$3,366
- − Management
- −$3,366
- − Depreciation
- −$7,273
- Taxable income
- $9,061
- Est. tax owed @ 24.0%
- −$2,175
- After-tax cash flow
- $10,328/yr
For passive investors: Depreciation is non-cash, so a rental often shows a tax loss while cash-flowing — sheltering income. Rental losses are passive: they offset passive income freely, and up to $25,000/yr can offset ordinary (W-2) income if you actively participate and your MAGI is under $100k (phasing out to $0 by $150k); unused losses carry forward. On sale, claimed depreciation is recaptured at up to 25%, and gains may owe capital-gains tax (a 1031 exchange can defer both). Figures are a year-1 estimate at your 24.0% rate — not tax advice; consult a CPA.
Schools (NCES district)
- District
- Rowland Unified
- NCES district ID
- 0633750
- Math proficiency
- 40% ▼ -1.00%
- Reading proficiency
- 62% ▲ 11.00%
- Median HH income
- $63,667
- Composite
- 44.83/100
- National rank
- #2733
- State rank
- #134 of 517 in CA
Livability — South San Jose Hills
- Score
- 63/100
- State rank
- #449
- US rank
- #15206
Category grades
Schools grade is shown separately in the Schools card above.
Census & demographics
- Census place
- South San Jose Hills, CA
- County
- Los Angeles County · 9,444,647 people
- Metro
- Los Angeles-Long Beach-Anaheim, CA
- Population (ZIP)
- 30,629
- Household income
- $94,817
- Rent vs Own
- Severe rent burden
- 1330.0
Population outlook (Los Angeles County) Hauer SSP2
- Today (2025)
- 10,940,515 people
- By 2030
- 11,256,481 · +2.9%
- By 2040
- 11,729,929 · +7.2%
- By 2050
- 11,948,407 · +9.2%
- By 2075
- 11,818,114 · +8.0%
- By 2100
- 10,842,928 · -0.9%
Race, ethnicity, and origin ACS 2023
- Neighborhood character
- Diverse neighborhood (Simpson 0.64)
- Race & ethnicity
- Hispanic / Latino 42% Asian 42% Two or more races 14% Black 7% White 6%
- Hispanic origin (detail)
- Mexican 35%
- Foreign-born
- 44% · Canada, China, Vietnam
- Languages at home
- 37% English-only · Spanish 28% Chinese 15% Tagalog/Filipino 14%
Political lean MEDSL · Los Angeles
- 2024 margin
- Solid D (+32.9) · D 64.8% · R 31.9% · Other 3.3%
- 2008→2024 swing
- -7.4pp toward R · 2008: 40.4pp · 2024: 32.9pp
- All cycles
- 2024: D+32.9 2020: D+44.2 2016: D+48.0 2012: D+40.0 2008: D+40.4
Not yet ingested
- Civics
- —
Market trends
- HPI YoY
- ▼ -662.61%
- Current HPI
- 420.1138
- Rent YoY
- ▲ 5.15%
- Metro
- Los Angeles-Long Beach-Anaheim, CA
- State GDP YoY
- ▲ 3.21%
- F500 in state
- 116
Industry mix (Fortune 500 HQ in CA)
| Industry | F500 HQs | Revenue |
|---|---|---|
| Technology | 27 | $1,492B |
|
||
| Financial Services | 3 | $174B |
|
||
| Retail | 3 | $44B |
|
||
| Insurance | 3 | $26B |
|
||
| Media / Entertainment | 2 | $115B |
|
||
| Pharmaceuticals / Biotech | 2 | $62B |
|
||
Price history
1 event — show timeline
- 2026-06-16 Listed $250,000 CRMLS
Property tax history
+6.8%/yrLatest (2025): $403 · +6.8% YoY. Source: county tax records.
Cash-flow waterfall
monthlySold comps — $/sqft
last 12 mo · ≤1 miLoading sold comps…