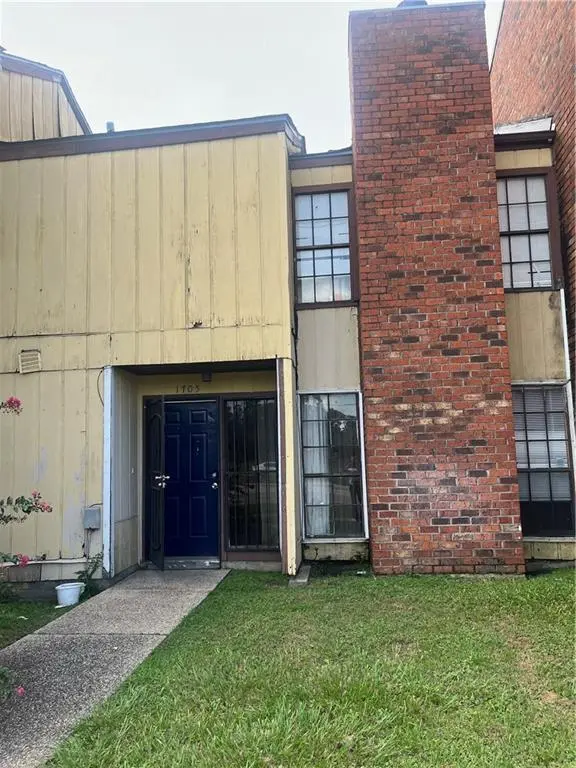
1705 Chimney Wood Ln · New Orleans, LA
Flood risk 8/10 · Major
- FEMA flood zone
- X (shaded)
- Chance of flooding over 30 yrs
- 0.6%
- Est. flood insurance / yr
- $507 – $1,088
Fire risk 1/10 · Minimal
- Est. fire insurance / yr
- $1,269 – $2,357
Heat risk 10/10 · Severe
- Hot days now (above 107°F)
- 7 days/yr
- Hot days in 30 yrs
- 21 days/yr
Wind risk 10/10 · Severe
- Chance of severe wind over 30 yrs
- 99.0%
Air-quality risk 3/10 · Minor
- Unhealthy air days now
- 3 days/yr
- Unhealthy air days in 30 yrs
- 3 days/yr
Risk factors via First Street. Map © Google.
Why this score? — see what drove the C grade
The composite is a weighted blend of 9 inputs, each scored 0–100. Each bar is that input's sub-score; the figure is the points it added to the 100-point composite (weight × sub-score).
- Cash flow +29.6/30.0
- DSCR +10.0/10.0
- 1% rule +8.9/10.0
- Livability +4.0/5.0
- Condition / age +2.5/5.0
- Rent growth +2.4/5.0
- Schools +1.6/10.0
- ARV discount +0.0/15.0
- Appreciation +0.0/10.0
$120,000
🖨 Deal sheet (PDF) 📄 Offer letter ✓ Due diligence
Listing remarks MLS
Charming 3 Bedroom Townhouse for Sale! Discover this spacious 3-bedroom, 2.5-bath townhouse located conveniently on Morrison Rd, just a stone's throw from public transportation and I-10. With ample room and plenty of potential, this property is great for owner-occupants looking to make it their own or investors seeking to expand their portfolio. While it needs a little TLC to restore its former glory, the possibilities are endless! Please note that the property is tenant-occupied, and same-day showings are not available. For scheduling, please schedule showings through Showing Time. Allow 24 hours for response.
Key facts
- $150 HOA
- 2 parking spots
- Built 1975
Neighborhood map
What this means for you Summary
Snapshot
- This is a 3-bed/2.5-bath townhouse listed at $120k.
Deal economics
- At list price, monthly cash flow is $365 ($4k/yr) — positive.
- The deal already cash-flows at list — no discount required.
- Meets the 1% rule at list price ($2k rent vs $120k).
- Recommended offer: $106k (12.0% below list) — sets the bar for market timing.
- Cap rate 10.6% vs local median 4.4% in New Orleans — top-decile yield for the area; either an underpriced asset or a hidden risk that comps aren't pricing in. Stress-test before assuming the spread holds.
Location & tenants
- Location reads 81/100 on livability (#3 in LA, #1,383 nationally) — a professional / high-income tenant draw. Strengths: amenities A+, commute A+, health & safety A+; Watch: crime C-, employment D.
- Orleans Parish (urban): math 11% / reading 27% proficiency, ranked #69 of 98 in LA (top 70%) — low school quality limits family demand, transient renter base, plan for 1-2y turnover; 68% free/reduced lunch — lower-income household profile, screen leases tightly.
- Zoned schools: Benjamin Franklin Elem. Math And Science (math 12% / reading 23%, grade F, #479 of 646 statewide, top 75%, 747 students, 98% FRL, charter) — zoned schools average 98% FRL vs 68% district-wide (30 pts higher); higher-poverty schools than district average — tighter screening recommended.
- Market conditions: Rents soft (-0.2%/yr); 224 active listings in the ZIP; 31 comparable units currently listed for rent nearby; rentals at typical pace (median 25d on market — plan ~3-4 weeks tenant-placement turnaround); lower-income renter base — watch delinquency; 710 units permitted in Orleans Parish in 2024 (244 in 5+ unit buildings).
- At $1,669/mo this rent would consume 48% of the median local household income ($42k/yr) (locally 1767% of renters already pay >50% of income on rent) — very limited rent-growth headroom before tenants either downsize or default.
Forward outlook
- Local home prices are declining (-3.0%/yr); year-one equity from $830 of loan paydown is wiped out by about $4k of value loss. Plan a longer hold.
- Orleans County population projected at +61% by 2050 — long-run rental-demand tailwind backs the buy-and-hold thesis.
Negotiation context
- It's been on market 345 days — a 12% lower offer ($106k) is reasonable based on typical stale-listing flexibility.
- 3 sale attempts since 29y ago with the ask held roughly flat each time — persistent listings suggest the price (not the market) is what's stuck; bring a comps-based counter.
- Current owner paid $68k; list at $120k implies a 78% gain — meaningful room to come down on a strong offer.
Risks & watch-outs
- Watch-outs: flood insurance adds $66/mo.
- Climate carrying-cost: severe flood risk; severe wind risk, 99% chance of damaging wind over 30y; extreme-heat days projected 7→21/yr by 2055 (HVAC capex compounding) — expect insurance premiums to compound above CPI over the hold.
Questions for the listing agent
- It's been on market 345 days. Have you received any prior offers? Is the seller open to a 12% concession, seller financing, or rate buy-down credit?
- Built in 1975 — when were the roof, HVAC, electrical panel, plumbing, and water heater last replaced?
- What's the actual annual flood-insurance premium (NFIP or private), and is the property in a SFHA with mandatory coverage?
- What does the HOA fee cover, when was the last increase, and are there any pending special assessments or reserve-fund shortfalls?
- Why hasn't it sold? Are there any deal-killer items the seller is aware of (foundation, flood, title, zoning, code violations)?
- Is there a deadline driving the sale (1031 exchange, divorce, estate, relocation)? That informs how much negotiation room exists.
- What's the average days-on-market for RENTAL listings here right now (not sales)? A rising rental-DOM trend means longer vacancies and softer asking-rent achievability than the comps imply.
- What's the recent tenant-quality profile in this submarket — average credit score on applications, eviction rate, late-payment / NSF rate, and stable-employment percentage? A property-management company in the area should have these aggregated.
- How much new for-sale + rental construction is in the pipeline within 1–3 miles? Heavy new supply typically softens prices + rents 12–24 months out; constrained supply supports both.
Investment metrics
- 1% rule
- 1.39% ✓
- Cap rate
- 10.61%
- Cash-on-cash
- 15.40%
- DSCR
- 1.69
- GRM
- 6.0
CMA / ARV
- ARV (median comp)
- $82,669
- List price
- $120,000
- Delta
- 45.16%
- Verdict
- OVERPRICED
- Comps
- 13 within 1.0 mi
Show comp detail 7 sales within ~0.75 mi
| Address | Dist | Beds/Ba | Sqft | Sold | Price | $/sf | Match |
|---|---|---|---|---|---|---|---|
| 1605 Chimney Wood Ln | 0.03mi | 2/2.5 (-1) | 1,400 (-1%) | 8mo | $70,000 | $50 | 85 |
| 5713 Count Ln | 0.30mi | 3/1.5 | 1,336 (-6%) | 1mo | $53,000 | $40 | 71 |
| 7705 Belcrest Pl | 0.33mi | 3/1.5 | 1,350 (-5%) | 5mo | $87,500 | $65 | 68 |
| 5116 Lakeview Ct | 0.63mi | 3/2.0 | 1,400 (-1%) | 1mo | $112,500 | $80 | 65 |
| 6530 Coveview Ct | 0.69mi | 2/2.5 (-1) | 1,440 (+2%) | 4mo | $82,000 | $57 | 57 |
| 5720 Count Ln | 0.27mi | 3/1.5 | 1,626 (+15%) | 10mo | $86,500 | $53 | 51 |
| 5269 Basinview Dr | 0.64mi | 2/2.5 (-1) | 1,520 (+7%) | 13mo | $61,000 | $40 | 43 |
Match score weights: distance 35% · size 25% · config 20% · recency 20%. Top-matched comps best support the ARV.
Projected returns pro-forma
-3.0% appreciation · 0.0% rent growth · sell at horizon
- IRR
- -0.8%
- Equity multiple
- 0.97×
- Total profit
- $-998
- Equity at exit
- $17,892
- IRR
- 5.0%
- Equity multiple
- 1.31×
- Total profit
- $10,560
- Equity at exit
- $10,375
Cash invested: $33,600 (down + closing). Projections, not guarantees.
Landlord ↔ Tenant lean methodology
- Overall (STATE)
- 90 Strongly Landlord-Friendly
- State Louisiana
- 90 Strongly Landlord-Friendly · R+12
- County
- — inherits STATE
- City
- — inherits STATE
ZIP-level market 70126
- Home prices YoY
- -17.0%
- Rents YoY
- -0.2%
- Active inventory
- 224
- Price-to-rent
- 6.0×
Monthly cashflow live
- Estimated rent
- $1,669 high interval (Pro) →
- Mortgage (P&I)
- −$629
- Tax from tax record
- −$58 /mo · $698/yr
- Insurance
- −$50
- Flood insurance flood zone
- −$66 /mo · $798/yr
- HOA
- −$150
- Vacancy / Maint / Mgmt
- −$351
- Net cashflow
- $365
Break-even live
Sensitivity live
| Price | -10% $433 | -5% $399 | +0% $365 | +5% $331 | +10% $297 |
|---|---|---|---|---|---|
| Rent | -10% $233 | -5% $299 | +0% $365 | +5% $431 | +10% $497 |
| Rate | -1.0pp $425 | -0.5pp $395 | base $365 | +0.5pp $334 | +1.0pp $302 |
UW: 25.0% down · 7.5% · 30yr · 1.5% tax · 5.0% vac · 8.0% maint · 8.0% mgmt
Financing live
Cash to close
- Down payment
- $30,000
- Closing costs
- $3,600
- Reserves months
- —
- Total cash needed
- —
Loan-product check · same deal, 3 products live
Conventional
25% down · 7.5% · 30yr
- Down + closing
- —
- Monthly P&I
- —
- Monthly cashflow
- —
- DSCR
- —
- Eligible?
- —
Personal DTI + credit; lowest rate.
DSCR
20% down · 8.5% · 30yr
- Down + closing
- —
- Monthly P&I
- —
- Monthly cashflow
- —
- DSCR
- —
- Eligible?
- —
No personal income docs; deal must DSCR.
Hard money
10% down · 12.0% · 12mo
- Down + closing
- —
- Monthly P&I
- —
- Monthly cashflow
- —
- DSCR
- —
- Eligible?
- —
Short-term bridge; refi at stabilization.
Rent comps 31 comps
| Address | Beds | Baths | Sqft | Rent | $/sqft | DOM | Units | Dist |
|---|---|---|---|---|---|---|---|---|
| 7621 Alabama St New Orleans, LA | 2.0 | 1.0 | 1000 | $1,400 | $1.40 | 25d | 1 | 0.22mi |
| 7404 Sussex Pl New Orleans, LA | 2.0 | 1.5 | 1400 | $1,450 | $1.04 | 4d | 1 | 0.24mi |
| 7611 Mayfair Pl New Orleans, LA | 2.0 | 1.5 | 1440 | $1,450 | $1.01 | 5d | 1 | 0.26mi |
| 5704 Count Ln New Orleans, LA | 3.0 | 1.5 | 1572 | $1,700 | $1.08 | 25d | 1 | 0.31mi |
| 7702 Belcrest Pl New Orleans, LA | 3.0 | 1.5 | 1150 | $1,650 | $1.43 | 25d | 1 | 0.34mi |
| 6027 Wales St New Orleans, LA | 3.0 | 1.0 | 1146 | $1,550 | $1.35 | 25d | 1 | 0.37mi |
| 6025 Wales St New Orleans, LA | 3.0 | 1.0 | 1147 | $1,550 | $1.35 | 25d | 1 | 0.37mi |
| 7918 W Laverne St New Orleans, LA | 3.0 | 2.0 | 1166 | $1,750 | $1.50 | 25d | 1 | 0.40mi |
| 6032 Kuebel Dr New Orleans, LA | 3.0 | 2.0 | 1100 | $1,600 | $1.45 | 25d | 1 | 0.40mi |
| 6030 Kuebel Dr New Orleans, LA | 3.0 | 2.0 | 1100 | $1,600 | $1.45 | 25d | 1 | 0.40mi |
| 8003 W Laverne St Unit 8003 New Orleans, LA | 2.0 | 1.5 | 1000 | $1,275 | $1.27 | 25d | 1 | 0.42mi |
| 4722 Shalimar Dr New Orleans, LA | 3.0 | 2.0 | 1157 | $1,400 | $1.21 | 25d | 1 | 0.72mi |
| 6628 Harbourview Dr New Orleans, LA | 3.0 | 2.5 | 1520 | $1,700 | $1.12 | 5d | 1 | 0.72mi |
| 4819 21 Francis Dr New Orleans, LA | 3.0 | 1.0 | 1272 | $1,880 | $1.48 | 5d | 1 | 0.73mi |
| 4745 Francis Dr New Orleans, LA | 3.0 | 2.0 | 1311 | $1,550 | $1.18 | 17d | 1 | 0.78mi |
| 4718 Reynes St New Orleans, LA | 2.0 | 1.5 | 890 | $1,475 | $1.66 | 25d | 1 | 0.83mi |
| 5925 Pauline Dr New Orleans, LA | 3.0 | 2.0 | 1566 | $2,325 | $1.48 | 17d | 1 | 0.85mi |
| 5747 Pauline Dr New Orleans, LA | 3.0 | 1.0 | 1300 | $1,400 | $1.08 | 13d | 1 | 0.87mi |
| 5920 Boeing St New Orleans, LA | 3.0 | 1.5 | 1340 | $1,400 | $1.04 | 25d | 1 | 0.88mi |
| 4522 Shalimar Dr New Orleans, LA | 3.0 | 2.0 | 1350 | $1,850 | $1.37 | 25d | 1 | 0.91mi |
| 4527 Shalimar Dr New Orleans, LA | 3.0 | 1.5 | 1174 | $1,550 | $1.32 | 25d | 1 | 0.91mi |
| 4211 Downman Rd New Orleans, LA | 2.0 | 1.0 | 900 | $1,250 | $1.39 | 25d | 1 | 0.95mi |
| 4441 Cessna Ct New Orleans, LA | 3.0 | 1.5 | 1400 | $1,600 | $1.14 | 25d | 1 | 0.97mi |
| 4409 Skyview Dr New Orleans, LA | 4.0 | 2.5 | 1560 | $1,700 | $1.09 | 17d | 1 | 0.98mi |
| 8025 Pompano St New Orleans, LA | 3.0 | 1.0 | 1131 | $1,595 | $1.41 | 17d | 1 | 1.15mi |
| 4722 Mithra St New Orleans, LA | 3.0 | 1.5 | 1295 | $1,600 | $1.24 | 25d | 1 | 1.17mi |
| 7909 Edward St New Orleans, LA | 3.0 | 1.5 | 1073 | $1,850 | $1.72 | 5d | 1 | 1.21mi |
| 4941 Pecan St Unit 1 New Orleans, LA | 2.0 | 1.0 | 1000 | $1,200 | $1.20 | 25d | 1 | 1.21mi |
| 4745 Tulip St New Orleans, LA | 3.0 | 1.0 | 1125 | $1,750 | $1.56 | 22d | 1 | 1.36mi |
| 4452 Plum Orchard Ave New Orleans, LA | 2.0 | 1.0 | 1100 | $1,250 | $1.14 | 5d | 1 | 1.42mi |
| 5550 Press Dr New Orleans, LA | 3.0 | 2.0 | 1640 | $2,000 | $1.22 | 17d | 1 | 1.43mi |
HOA detail
- Monthly dues
- $150 · $1,800/yr
Listing history 20 events
-
2026-06-21days on market $120,000 Active 345 DOM
-
2026-06-18days on market $120,000 Active 342 DOM
-
2026-06-17days on market $120,000 Active 341 DOM
-
2026-06-16days on market $120,000 Active 340 DOM
-
2026-06-15days on market $120,000 Active 339 DOM
-
2026-06-13days on market $120,000 Active 337 DOM
-
2026-06-10days on market $120,000 Active 334 DOM
-
2026-06-09days on market $120,000 Active 333 DOM
-
2026-06-08days on market $120,000 Active 332 DOM
-
2026-06-07days on market $120,000 Active 331 DOM
-
2026-06-05days on market $120,000 Active 328 DOM
-
2026-06-03days on market $120,000 Active 327 DOM
-
2026-06-02days on market $120,000 Active 326 DOM
-
2026-06-01days on market $120,000 Active 325 DOM
-
2026-05-31days on market $120,000 Active 324 DOM
-
2025-07-11$120,000 Active 618-char remark
Show marketing remark (617 chars)
Charming 3 Bedroom Townhouse for Sale! Discover this spacious 3-bedroom, 2.5-bath townhouse located conveniently on Morrison Rd, just a stone's throw from public transportation and I-10. With ample room and plenty of potential, this property is great for owner-occupants looking to make it their own or investors seeking to expand their portfolio.While it needs a little TLC to restore its former glory, the possibilities are endless! Please note that the property is tenant-occupied, and same-day showings are not available. For scheduling, please schedule showings through Showing Time. Allow 24 hours for response.
-
2025-07-11$120,000 Active 617-char remark
Show marketing remark (617 chars)
Charming 3 Bedroom Townhouse for Sale! Discover this spacious 3-bedroom, 2.5-bath townhouse located conveniently on Morrison Rd, just a stone's throw from public transportation and I-10. With ample room and plenty of potential, this property is great for owner-occupants looking to make it their own or investors seeking to expand their portfolio.While it needs a little TLC to restore its former glory, the possibilities are endless! Please note that the property is tenant-occupied, and same-day showings are not available. For scheduling, please schedule showings through Showing Time. Allow 24 hours for response.
-
1997-11-06soldstatus $67,500
-
1997-03-06$68,000
-
1980-06-27soldstatus $85,406
ⓘ Source: listings_history table (triggers on properties + properties_extension) + one-shot
backfill from property_details.listing_events for pre-trigger history.
Tax reassessment forecast LA · Resets to sale price
- Current annual tax
- $698 · $58/mo
- Projected year-2 tax
- $698 · $58/mo
- Expected delta
- $0/yr ($0/mo · 0.0%)
ⓘ Screening estimate from a state-policy table — verify with the county assessor before closing.
Climate risk First Street
- Flood 8/10 Severe FEMA zone X (shaded) · 60% chance over 30 yrs
- Wildfire 1/10 Low
- Heat 10/10 Extreme 7 d/yr ≥107°F today · 21 d/yr by 30 yrs out
- Wind 10/10 Extreme 99% chance of damaging wind over 30 yrs
- Air quality 3/10 Moderate 3 unhealthy d/yr today · 3 by 30 yrs out
Nearby sold comps map
Loading sold comps map…
Walkable amenities ~0.75 mi
Loading nearby amenities…
Taxation est. · year 1
- Rental income
- $20,032
- − Mortgage interest
- −$6,722
- − Property taxes
- −$698
- − Insurance
- −$1,398
- − Repairs & maintenance
- −$1,603
- − Management
- −$1,603
- − HOA
- −$1,800
- − Depreciation
- −$3,491
- Taxable income
- $2,718
- Est. tax owed @ 24.0%
- −$652
- After-tax cash flow
- $3,726/yr
For passive investors: Depreciation is non-cash, so a rental often shows a tax loss while cash-flowing — sheltering income. Rental losses are passive: they offset passive income freely, and up to $25,000/yr can offset ordinary (W-2) income if you actively participate and your MAGI is under $100k (phasing out to $0 by $150k); unused losses carry forward. On sale, claimed depreciation is recaptured at up to 25%, and gains may owe capital-gains tax (a 1031 exchange can defer both). Figures are a year-1 estimate at your 24.0% rate — not tax advice; consult a CPA.
Schools (NCES district)
- District
- Orleans Parish
- NCES district ID
- 2201170
- Math proficiency
- 11% ▼ -52.00%
- Reading proficiency
- 27% ▼ -46.00%
- Median HH income
- $37,011
- Composite
- 15.78/100
- National rank
- #9271
- State rank
- #69 of 98 in LA
Livability — New Orleans
- Score
- 81/100
- State rank
- #3
- US rank
- #1383
Category grades
Schools grade is shown separately in the Schools card above.
Census & demographics
- Census place
- New Orleans, LA
- County
- Orleans Parish · 338,817 people
- City population
- 338,817
- Metro
- New Orleans-Metairie, LA
- Population (ZIP)
- 27,047
- Household income
- $41,709
- Rent vs Own
- Severe rent burden
- 1767.0
Population outlook (Orleans County) Hauer SSP2
- Today (2025)
- 513,025 people
- By 2030
- 575,781 · +12.2%
- By 2040
- 700,174 · +36.5%
- By 2050
- 826,541 · +61.1%
- By 2075
- 1,123,374 · +119.0%
- By 2100
- 1,355,609 · +164.2%
Race, ethnicity, and origin ACS 2023
- Neighborhood character
- Predominantly Black (85%)
- Race & ethnicity
- Black 85% Hispanic / Latino 6% Two or more races 5% White 5%
- Hispanic origin (detail)
- Common ancestry
- Lithuanian 1% Italian 1%
- Foreign-born
- 4% · Canada, Vietnam
- Languages at home
- 94% English-only · Spanish 5% Other Indo-European 1%
Political lean MEDSL · Orleans
- 2024 margin
- Solid D (+67.0) · D 82.2% · R 15.2% · Other 2.7%
- 2008→2024 swing
- +6.7pp toward D · 2008: 60.3pp · 2024: 67.0pp
- All cycles
- 2024: D+67.0 2020: D+68.2 2016: D+66.2 2012: D+62.5 2008: D+60.3
Not yet ingested
- Civics
- —
Market trends
- HPI YoY
- ▼ -36.35%
- Current HPI
- 177.355
- Rent YoY
- ▼ -0.24%
- Metro
- New Orleans-Metairie, LA
- State GDP YoY
- ▲ 3.29%
- F500 in state
- 10
Industry mix (Fortune 500 HQ in LA)
| Industry | F500 HQs | Revenue |
|---|---|---|
| Telecommunications | 2 | $23B |
|
||
| Utilities | 1 | $12B |
|
||
| Wholesale / Distribution | 1 | $5B |
|
||
| Advertising | 1 | $2B |
|
||
Price history
+40.5% since first listed5 events — show timeline
- 2025-07-11 Listed $120,000 AcadianaMLS
- 2025-07-11 Listed $120,000 GSREIN
- 1997-11-06 Sold (Public Records) $67,500 Public Records
- 1997-03-06 Listed $68,000 AcadianaMLS
- 1980-06-27 Sold (Public Records) $85,406 Public Records
Property tax history
-2.3%/yrLatest (2026): $698 · +1.1% YoY. Source: county tax records.
Cash-flow waterfall
monthlySold comps — $/sqft
last 12 mo · ≤1 miLoading sold comps…