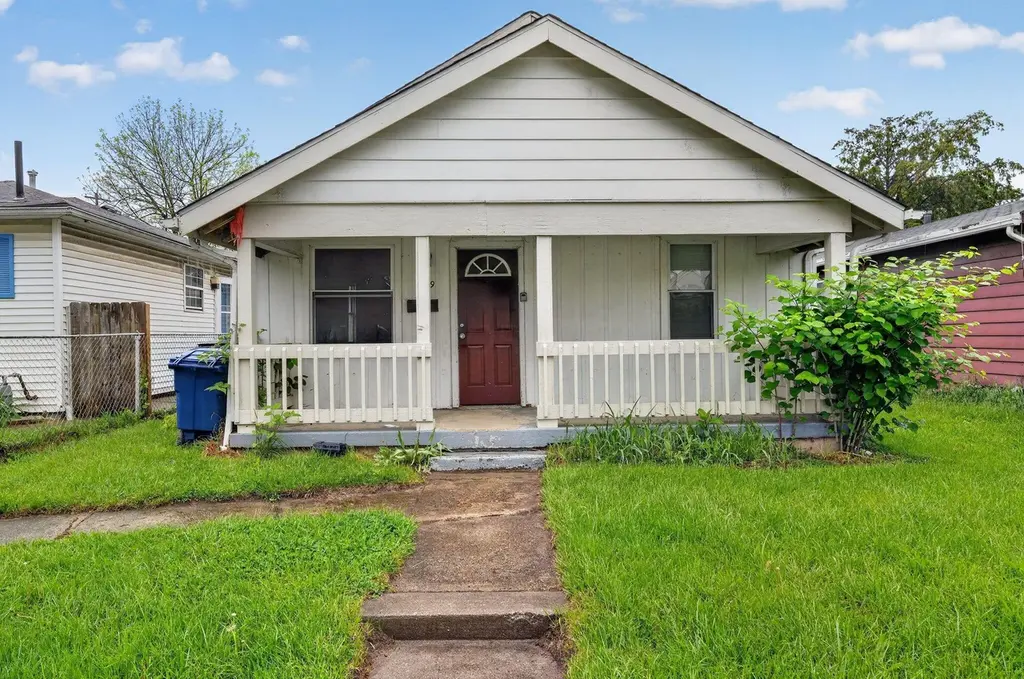
679 Dexter Ave · Columbus, OH
Flood risk 1/10 · Minimal
- FEMA flood zone
- X (unshaded)
- Chance of flooding over 30 yrs
- 0.0%
- Est. flood insurance / yr
- $507 – $1,088
Fire risk 1/10 · Minimal
- Est. fire insurance / yr
- $713 – $1,323
Heat risk 4/10 · Minor
- Hot days now (above 102°F)
- 7 days/yr
- Hot days in 30 yrs
- 18 days/yr
Wind risk 2/10 · Minimal
- Chance of severe wind over 30 yrs
- 1.0%
Air-quality risk 2/10 · Minimal
- Unhealthy air days now
- 1 days/yr
- Unhealthy air days in 30 yrs
- 2 days/yr
Risk factors via First Street. Map © Google.
Why this score? — see what drove the C grade
The composite is a weighted blend of 9 inputs, each scored 0–100. Each bar is that input's sub-score; the figure is the points it added to the 100-point composite (weight × sub-score).
- Cash flow +17.4/30.0
- ARV discount +15.0/15.0
- DSCR +5.4/10.0
- 1% rule +4.3/10.0
- Livability +4.0/5.0
- Schools +3.8/10.0
- Rent growth +3.6/5.0
- Condition / age +2.5/5.0
- Appreciation +0.0/10.0
$134,900
🖨 Deal sheet (PDF) 📄 Offer letter ✓ Due diligence
Listing remarks MLS
One story 3 bedroom home with huge fenced in backyard! Newly painted and wood vinyl floor! Only 15 minutes from downtown and close to shopping dining and more! Must See!
Key facts
- One story ranch
- Vinyl sided design
- Private driveway
Tags
Property features AI
Exterior
- Parking: On-street parking
- Utilities: Public water; Public sewer
- Home design: Single family residence; One story; No common walls; Built in 1950
- Construction: Slab foundation
- Exterior features: Lot approximately 0.11 acres; Subdivision: G.W. Shaffer's S.W. Addition
Interior
- Bedrooms: 3 bedrooms on the main level
- Flooring: Wood flooring; Carpet; Ceramic/porcelain tile
- Bathrooms: 1 full bathroom
- Heating & cooling: Forced air heating; Central air conditioning
- Interior features: Crawl space basement; Living area approximately 960
Neighborhood map
What this means for you Summary
Snapshot
- This is a 3-bed/1.0-bath single-family listed at $135k.
Deal economics
- At list price, monthly cash flow is $101 ($1k/yr) — positive.
- The deal already cash-flows at list — no discount required.
- To meet the 1% rule (rent ≥ 1% of price), the offer needs to be $125k (7.1% below list).
- Recommended offer: $125k (7.1% below list) — sets the bar for 1% rule.
- Cap rate 7.2% vs local median 3.8% in Columbus — top-decile yield for the area; either an underpriced asset or a hidden risk that comps aren't pricing in. Stress-test before assuming the spread holds.
Location & tenants
- Location reads 81/100 on livability (#97 in OH, #1,491 nationally) — a professional / high-income tenant draw. Strengths: commute A+, cost of living A+, housing A+; Watch: employment C-, crime F.
- South-Western City (suburban): math 40% / reading 48% proficiency, ranked #500 of 656 in OH (top 76%) — families likely to look elsewhere, expect single-tenant / working-renter base with shorter leases.
- Zoned schools: West Franklin Elementary School (math 32% / reading 32%, grade F, #1,135 of 1,584 statewide, top 73%, 476 students, 85% FRL); Galloway Ridge Intermediate School (math 31% / reading 44%, grade F, #534 of 654 statewide, top 82%, 731 students, 74% FRL); Westland High School (math 20% / reading 53%, grade F, #578 of 781 statewide, top 74%, 1,832 students, 59% FRL) — zoned schools average 73% FRL vs 51% district-wide (22 pts higher); higher-poverty schools than district average — tighter screening recommended.
- Market conditions: Rents rising fast (+4.5%/yr); 187 active listings in the ZIP; 35 comparable units currently listed for rent nearby; rentals at typical pace (median 25d on market — plan ~3-4 weeks tenant-placement turnaround); 43% of comp listings sitting > 30 days — soft ceiling on asking rent; 8,139 units permitted in Franklin County in 2024 (5,940 in 5+ unit buildings).
Forward outlook
- Local home prices are declining (-3.0%/yr); year-one equity from $933 of loan paydown is wiped out by about $4k of value loss. Plan a longer hold.
- Franklin County population projected at +34% by 2050 — long-run rental-demand tailwind backs the buy-and-hold thesis.
Negotiation context
- It's been on market 37 days — a 3% lower offer ($131k) is reasonable based on typical stale-listing flexibility.
- 10 sale attempts since 27y ago; this cycle's ask has dropped $10k (7%) from the opening price — seller is motivated, your offer sets the floor, not the list.
Risks & watch-outs
- Watch-outs: built in 1950 — expect roof / HVAC / electrical / plumbing capex.
Questions for the listing agent
- It's been on market 37 days. Have you received any prior offers? Is the seller open to a 7% concession, seller financing, or rate buy-down credit?
- Built in 1950 — when were the roof, HVAC, electrical panel, plumbing, and water heater last replaced?
- Is there a deadline driving the sale (1031 exchange, divorce, estate, relocation)? That informs how much negotiation room exists.
- Crime grade is F in this area — have there been break-ins, vandalism, or insurance claims at this property in the last 3 years? What carrier currently insures it and at what premium?
- What's the average days-on-market for RENTAL listings here right now (not sales)? A rising rental-DOM trend means longer vacancies and softer asking-rent achievability than the comps imply.
- What's the recent tenant-quality profile in this submarket — average credit score on applications, eviction rate, late-payment / NSF rate, and stable-employment percentage? A property-management company in the area should have these aggregated.
- How much new for-sale + rental construction is in the pipeline within 1–3 miles? Heavy new supply typically softens prices + rents 12–24 months out; constrained supply supports both.
Investment metrics
- 1% rule
- 0.93% ✗
- Cap rate
- 7.19%
- Cash-on-cash
- 3.20%
- DSCR
- 1.14
- GRM
- 9.0
CMA / ARV
- ARV (median comp)
- $174,586
- List price
- $134,900
- Delta
- -17.00%
- Verdict
- UNDERPRICED
- Comps
- 20 within 1.0 mi
Show comp detail 12 sales within ~0.75 mi
| Address | Dist | Beds/Ba | Sqft | Sold | Price | $/sf | Match |
|---|---|---|---|---|---|---|---|
| 3295 Mary Ave | 0.23mi | 3/1.0 | 1,028 (+7%) | 1mo | $131,000 | $127 | 77 |
| 814 Miriam Dr W | 0.22mi | 3/1.0 | 1,028 (+7%) | 2mo | $219,840 | $214 | 77 |
| 3232 Mary Ave | 0.28mi | 3/1.0 | 1,028 (+7%) | 2mo | $130,000 | $126 | 74 |
| 744 Powhatan Ave | 0.24mi | 3/1.0 | 1,066 (+11%) | 0mo | $238,000 | $223 | 70 |
| 3340 Miriam Dr S | 0.38mi | 3/2.0 | 1,080 (+12%) | 1mo | $236,000 | $219 | 56 |
| 3851 Fairmoor Rd | 0.66mi | 2/1.0 (-1) | 1,009 (+5%) | 1mo | $179,500 | $178 | 55 |
| 638 Fairmoor Pl | 0.61mi | 3/1.0 | 896 (-7%) | 7mo | $160,000 | $179 | 54 |
| 408 Derrer Rd | 0.39mi | 3/1.5 | 825 (-14%) | 4mo | $182,500 | $221 | 53 |
| 3431 Michael Ct | 0.40mi | 3/2.0 | 1,104 (+15%) | 4mo | $212,000 | $192 | 48 |
| 3360 Briggs Rd | 0.49mi | 3/2.0 | 1,080 (+12%) | 6mo | $205,000 | $190 | 47 |
| 894 Binns Blvd | 0.58mi | 2/2.0 (-1) | 867 (-10%) | 2mo | $250,000 | $288 | 46 |
| 182 S Sylvan Ave | 0.72mi | 2/1.0 (-1) | 1,068 (+11%) | 0mo | $175,950 | $165 | 42 |
Match score weights: distance 35% · size 25% · config 20% · recency 20%. Top-matched comps best support the ARV.
Projected returns pro-forma
-3.0% appreciation · 4.49% rent growth · sell at horizon
- IRR
- -9.7%
- Equity multiple
- 0.64×
- Total profit
- $-13,542
- Equity at exit
- $20,114
- IRR
- 1.6%
- Equity multiple
- 1.12×
- Total profit
- $4,505
- Equity at exit
- $11,664
Cash invested: $37,772 (down + closing). Projections, not guarantees.
Landlord ↔ Tenant lean methodology
- Overall (STATE)
- 73 Landlord-Friendly
- State Ohio
- 73 Landlord-Friendly · R+6
- County
- — inherits STATE
- City
- — inherits STATE
ZIP-level market 43204
- Rents YoY
- 4.5%
- Active inventory
- 187
- Price-to-rent
- 9.0×
Monthly cashflow live
- Estimated rent
- $1,253 high interval (Pro) →
- Mortgage (P&I)
- −$707
- Tax from tax record
- −$125 /mo · $1,504/yr
- Insurance
- −$56
- HOA
- −$0
- Vacancy / Maint / Mgmt
- −$263
- Net cashflow
- $101
Break-even live
Sensitivity live
| Price | -10% $177 | -5% $139 | +0% $101 | +5% $63 | +10% $24 |
|---|---|---|---|---|---|
| Rent | -10% $2 | -5% $51 | +0% $101 | +5% $150 | +10% $200 |
| Rate | -1.0pp $169 | -0.5pp $135 | base $101 | +0.5pp $66 | +1.0pp $30 |
UW: 25.0% down · 7.5% · 30yr · 1.5% tax · 5.0% vac · 8.0% maint · 8.0% mgmt
Financing live
Cash to close
- Down payment
- $33,725
- Closing costs
- $4,047
- Reserves months
- —
- Total cash needed
- —
Loan-product check · same deal, 3 products live
Conventional
25% down · 7.5% · 30yr
- Down + closing
- —
- Monthly P&I
- —
- Monthly cashflow
- —
- DSCR
- —
- Eligible?
- —
Personal DTI + credit; lowest rate.
DSCR
20% down · 8.5% · 30yr
- Down + closing
- —
- Monthly P&I
- —
- Monthly cashflow
- —
- DSCR
- —
- Eligible?
- —
No personal income docs; deal must DSCR.
Hard money
10% down · 12.0% · 12mo
- Down + closing
- —
- Monthly P&I
- —
- Monthly cashflow
- —
- DSCR
- —
- Eligible?
- —
Short-term bridge; refi at stabilization.
Rent comps 35 comps
| Address | Beds | Baths | Sqft | Rent | $/sqft | DOM | Units | Dist |
|---|---|---|---|---|---|---|---|---|
| 3285 Sullivant Ave Unit D Columbus, OH | 2.0 | 1.0 | 860 | $1,200 | $1.40 | 9d | 1 | 0.24mi |
| 690 Kingsford Rd Columbus, OH | 2.0 | 1.0 | 864 | $825 | $0.95 | 45d | 1 | 0.31mi |
| 751 Kingsford Rd Unit C Columbus, OH | 2.0 | 1.0 | 858 | $1,200 | $1.40 | 16d | 1 | 0.36mi |
| 881 Kingsford Rd Unit A Columbus, OH | 2.0 | 1.0 | 895 | $900 | $1.01 | 5d | 1 | 0.46mi |
| 486-488 S Huron Ave Unit 488 Columbus, OH | 2.0 | 1.0 | 1104 | $1,150 | $1.04 | 45d | 1 | 0.58mi |
| 775 Maurine Dr Columbus, OH | 3.0 | 1.0 | 884 | $1,525 | $1.73 | 45d | 1 | 0.65mi |
| 1045 Binns Blvd Unit A Columbus, OH | 2.0 | 1.0 | 731 | $905 | $1.24 | 25d | 1 | 0.65mi |
| 1118 Arnelle Ct Columbus, OH | 2.0 | 1.5 | 975 | $1,150 | $1.18 | 45d | 1 | 0.69mi |
| 1138 McCarley Dr E Columbus, OH | 2.0 | 1.5 | 975 | $1,150 | $1.18 | 45d | 1 | 0.69mi |
| 793 Wiltshire Rd Columbus, OH | 2.0 | 1.0 | 900 | $1,450 | $1.61 | 45d | 1 | 0.72mi |
| 3712 Clime Rd Columbus, OH | 2.0 | 1.0 | 1100 | $1,250 | $1.14 | 6d | 1 | 0.85mi |
| 364 S Chase Ave Unit B Columbus, OH | 2.0 | 1.0 | 1010 | $975 | $0.97 | 45d | 1 | 0.87mi |
| 396 S Powell Ave Unit 396 Columbus, OH | 2.0 | 1.0 | 1022 | $925 | $0.91 | 45d | 1 | 0.91mi |
| 1028 S Harris Ave Columbus, OH | 3.0 | 1.0 | 900 | $1,500 | $1.67 | 45d | 1 | 0.91mi |
| 390 S Powell Ave Columbus, OH | 2.0 | 1.0 | 775 | $1,025 | $1.32 | 4d | 1 | 0.91mi |
| 322 S Powell Ave Columbus, OH | 2.0 | 1.0 | 1100 | $950 | $0.86 | 21d | 1 | 0.96mi |
| 406 1/2 S Hague Ave Columbus, OH | 2.0 | 1.0 | 918 | $765 | $0.83 | 45d | 1 | 0.96mi |
| 50 Florence Ave Columbus, OH | 3.0 | 1.0 | 910 | $1,625 | $1.79 | 45d | 1 | 1.00mi |
| 839-841 S Ogden Ave Columbus, OH | 2.0 | 1.0 | 727 | $1,000 | $1.38 | 3d | 1 | 1.02mi |
| 475 S Ogden Ave Columbus, OH | 2.0 | 1.0 | 888 | $1,100 | $1.24 | 25d | 1 | 1.07mi |
| 616-618 S Ogden Ave Columbus, OH | 3.0 | 1.0 | 1100 | $1,125 | $1.02 | 45d | 1 | 1.08mi |
| 427 S Ogden Ave Unit 427 Columbus, OH | 2.0 | 1.0 | 980 | $1,350 | $1.38 | 9d | 1 | 1.09mi |
| 148 S Powell Ave Columbus, OH | 2.0 | 1.0 | 900 | $1,050 | $1.17 | 45d | 1 | 1.11mi |
| 148 S Powell Ave Unit B Columbus, OH | 2.0 | 1.0 | 900 | $1,000 | $1.11 | 9d | 1 | 1.11mi |
| 661-663 S Burgess Ave Columbus, OH | 3.0 | 1.0 | 1100 | $1,028 | $0.93 | 45d | 1 | 1.12mi |
| 375 S Burgess Ave Columbus, OH | 2.0 | 1.0 | 732 | $950 | $1.30 | 21d | 1 | 1.17mi |
| 375 S Burgess Ave Columbus, OH | 2.0 | 1.0 | 732 | $950 | $1.30 | 5d | 1 | 1.17mi |
| 945 Hodges Dr Columbus, OH | 3.0 | 1.0 | 1078 | $1,640 | $1.52 | 25d | 1 | 1.21mi |
| 2545-2547 Sullivant Ave Columbus, OH | 3.0 | 1.0 | 1064 | $1,100 | $1.03 | 12d | 1 | 1.23mi |
| 530 S Terrace Ave Columbus, OH | 2.0 | 1.0 | 896 | $900 | $1.00 | 25d | 1 | 1.28mi |
| 169 N Wilson Rd Columbus, OH | 1.0–2.0 | 1.0 | 615 | $1,115 | $1.81 | 3d | 14 | 1.30mi |
| 521-523 S Wayne Ave Columbus, OH | 3.0 | 1.0 | 1092 | $1,195 | $1.09 | 5d | 1 | 1.38mi |
| 548 S Wayne Ave Columbus, OH | 3.0 | 1.0 | 1008 | $1,225 | $1.22 | 21d | 1 | 1.42mi |
| 329 S Wayne Ave Columbus, OH | 3.0 | 1.0 | 1120 | $1,425 | $1.27 | 4d | 1 | 1.44mi |
| 3152 Winding Creek Dr Unit 3152 Columbus, OH | 2.0 | 1.0 | 964 | $1,295 | $1.34 | 45d | 1 | 1.50mi |
Listing history 43 events
-
2026-06-21pricedays on market $134,900 Active 37 DOM
-
2026-06-18days on market $144,900 Active 34 DOM
-
2026-06-17days on market $144,900 Active 33 DOM
-
2026-06-16days on market $144,900 Active 32 DOM
-
2026-06-15days on market $144,900 Active 31 DOM
-
2026-06-13days on market $144,900 Active 29 DOM
-
2026-06-09days on market $144,900 Active 25 DOM
-
2026-06-08days on market $144,900 Active 24 DOM
-
2026-06-07days on market $144,900 Active 23 DOM
-
2026-06-03days on market $144,900 Active 19 DOM
-
2026-06-02days on market $144,900 Active 18 DOM
-
2026-06-01days on market $144,900 Active 17 DOM
-
2026-05-31days on market $144,900 Active 16 DOM
-
2026-05-15$144,900 Active 550-char remark
-
2024-11-18soldstatus $6,955,000
-
2017-03-24soldstatus $47,000
-
2017-03-20soldstatus $47,000 Closed 169-char remark
Show marketing remark (169 chars)
One story 3 bedroom home with huge fenced in backyard! Newly painted and wood vinyl floor! Only 15 minutes from downtown and close to shopping dining and more! Must See!
-
2017-03-12status Pending 169-char remark
Show marketing remark (169 chars)
One story 3 bedroom home with huge fenced in backyard! Newly painted and wood vinyl floor! Only 15 minutes from downtown and close to shopping dining and more! Must See!
-
2017-03-02$54,900 Active 169-char remark
Show marketing remark (169 chars)
One story 3 bedroom home with huge fenced in backyard! Newly painted and wood vinyl floor! Only 15 minutes from downtown and close to shopping dining and more! Must See!
-
2017-03-02historical
Show marketing remark (169 chars)
One story 3 bedroom home with huge fenced in backyard! Newly painted and wood vinyl floor! Only 15 minutes from downtown and close to shopping dining and more! Must See!
-
2017-02-17price $54,900
-
2017-01-08price $59,900
-
2016-11-23$64,900 Active
-
2014-11-04historical
-
2014-10-03$60,900
-
2012-09-10soldstatus $37,000
-
2012-08-31historical
-
2012-06-04$39,500
-
2012-04-01historical
-
2011-09-16$47,000
-
2011-06-21historical
-
2010-04-09$44,900
-
2010-02-25soldstatus $12,000
-
2010-01-08historical
-
2009-12-04$15,900
-
2005-10-25soldstatus $85,000
-
2005-07-18soldstatus $24,000
-
2005-06-29historical
-
2005-03-10$27,900
-
1999-10-22soldstatus $48,000
-
1999-09-18historical
-
1999-05-10$54,900
-
1994-03-25soldstatus $14,600
ⓘ Source: listings_history table (triggers on properties + properties_extension) + one-shot
backfill from property_details.listing_events for pre-trigger history.
Tax reassessment forecast OH · Partial reset (capped growth)
- Current annual tax
- $1,504 · $125/mo
- Projected year-2 tax
- $1,804 · $150/mo
- Expected delta
- +$300/yr (+$25/mo · 20.0%)
ⓘ Screening estimate from a state-policy table — verify with the county assessor before closing.
Climate risk First Street
- Flood 1/10 Low FEMA zone X (unshaded) · 0% chance over 30 yrs
- Wildfire 1/10 Low
- Heat 4/10 Moderate 7 d/yr ≥102°F today · 18 d/yr by 30 yrs out
- Wind 2/10 Low 100% chance of damaging wind over 30 yrs
- Air quality 2/10 Low 1 unhealthy d/yr today · 2 by 30 yrs out
Nearby sold comps map
Loading sold comps map…
Walkable amenities ~0.75 mi
Loading nearby amenities…
Taxation est. · year 1
- Rental income
- $15,034
- − Mortgage interest
- −$7,556
- − Property taxes
- −$1,504
- − Insurance
- −$674
- − Repairs & maintenance
- −$1,203
- − Management
- −$1,203
- − Depreciation
- −$3,924
- Taxable loss
- −$1,031
- Est. tax savings @ 24.0%
- +$247
- After-tax cash flow
- $1,457/yr
For passive investors: Depreciation is non-cash, so a rental often shows a tax loss while cash-flowing — sheltering income. Rental losses are passive: they offset passive income freely, and up to $25,000/yr can offset ordinary (W-2) income if you actively participate and your MAGI is under $100k (phasing out to $0 by $150k); unused losses carry forward. On sale, claimed depreciation is recaptured at up to 25%, and gains may owe capital-gains tax (a 1031 exchange can defer both). Figures are a year-1 estimate at your 24.0% rate — not tax advice; consult a CPA.
Schools (NCES district)
- District
- South-Western City
- NCES district ID
- 3904480
- Math proficiency
- 40% ▼ -18.00%
- Reading proficiency
- 48% ▼ -10.00%
- Median HH income
- $51,689
- Composite
- 37.95/100
- National rank
- #4305
- State rank
- #500 of 656 in OH
Livability — Columbus
- Score
- 81/100
- State rank
- #97
- US rank
- #1491
Category grades
Schools grade is shown separately in the Schools card above.
Census & demographics
- Census place
- Columbus, OH
- County
- Franklin County · 1,351,780 people
- City population
- 612,189
- Metro
- Columbus, OH
- Population (ZIP)
- 42,962
- Household income
- $59,266
- Rent vs Own
- Severe rent burden
- 2290.0
Population outlook (Franklin County) Hauer SSP2
- Today (2025)
- 1,456,139 people
- By 2030
- 1,556,890 · +6.9%
- By 2040
- 1,757,349 · +20.7%
- By 2050
- 1,950,539 · +34.0%
- By 2075
- 2,376,171 · +63.2%
- By 2100
- 2,636,796 · +81.1%
Race, ethnicity, and origin ACS 2023
- Neighborhood character
- Diverse neighborhood (Simpson 0.58)
- Race & ethnicity
- White 61% Hispanic / Latino 16% Black 13% Two or more races 12% Asian 3%
- Hispanic origin (detail)
- Mexican 9%
- Common ancestry
- Lithuanian 1% Slovak 1% Romanian 1%
- Foreign-born
- 13% · Canada
- Languages at home
- 81% English-only · Spanish 13% Arabic 2% Other Asian/Pacific 1%
Political lean MEDSL · Franklin
- 2024 margin
- Strong D (+28.4) · D 63.7% · R 35.3% · Other 1.0%
- 2008→2024 swing
- +7.7pp toward D · 2008: 20.7pp · 2024: 28.4pp
- All cycles
- 2024: D+28.4 2020: D+31.4 2016: D+25.9 2012: D+21.7 2008: D+20.7
Not yet ingested
- Civics
- —
Market trends
- HPI YoY
- ▼ -220.67%
- Current HPI
- 265.7711
- Rent YoY
- ▲ 4.49%
- Metro
- Columbus, OH
- State GDP YoY
- ▲ 1.98%
- F500 in state
- 48
Industry mix (Fortune 500 HQ in OH)
| Industry | F500 HQs | Revenue |
|---|---|---|
| Insurance | 3 | $145B |
|
||
| Industrial Machinery | 3 | $49B |
|
||
| Financial Services | 3 | $24B |
|
||
| Consumer Goods | 2 | $93B |
|
||
| Aerospace / Defense | 2 | $47B |
|
||
| Utilities | 2 | $33B |
|
||
Price history
+892.5% since first listed30 events — show timeline
- 2026-05-15 Listed $144,900 CBRMLS
- 2024-11-18 Sold (Public Records) $6,955,000 Public Records
- 2017-03-24 Sold (Public Records) $47,000 Public Records
- 2017-03-20 Sold (MLS) $47,000 CBRMLS
- 2017-03-12 Pending — CBRMLS
- 2017-03-02 Listed $54,900 CBRMLS
- 2017-03-02 Listing Removed — CBRMLS
- 2017-02-17 Price Changed $54,900 CBRMLS
- 2017-01-08 Price Changed $59,900 CBRMLS
- 2016-11-23 Listed $64,900 CBRMLS
- 2014-11-04 Listing Removed — CBRMLS
- 2014-10-03 Listed $60,900 CBRMLS
- 2012-09-10 Sold (MLS) $37,000 CBRMLS
- 2012-08-31 Listing Removed — CBRMLS
- 2012-06-04 Listed $39,500 CBRMLS
- 2012-04-01 Listing Removed — CBRMLS
- 2011-09-16 Listed $47,000 CBRMLS
- 2011-06-21 Listing Removed — CBRMLS
- 2010-04-09 Listed $44,900 CBRMLS
- 2010-02-25 Sold (MLS) $12,000 CBRMLS
- 2010-01-08 Listing Removed — CBRMLS
- 2009-12-04 Listed $15,900 CBRMLS
- 2005-10-25 Sold (Public Records) $85,000 Public Records
- 2005-07-18 Sold (MLS) $24,000 CBRMLS
- 2005-06-29 Listing Removed — CBRMLS
- 2005-03-10 Listed $27,900 CBRMLS
- 1999-10-22 Sold (Public Records) $48,000 Public Records
- 1999-09-18 Listing Removed — CBRMLS
- 1999-05-10 Listed $54,900 CBRMLS
- 1994-03-25 Sold (Public Records) $14,600 Public Records
Property tax history
+4.2%/yrLatest (2024): $1,504 · +1.8% YoY. Source: county tax records.
Cash-flow waterfall
monthlySold comps — $/sqft
last 12 mo · ≤1 miLoading sold comps…