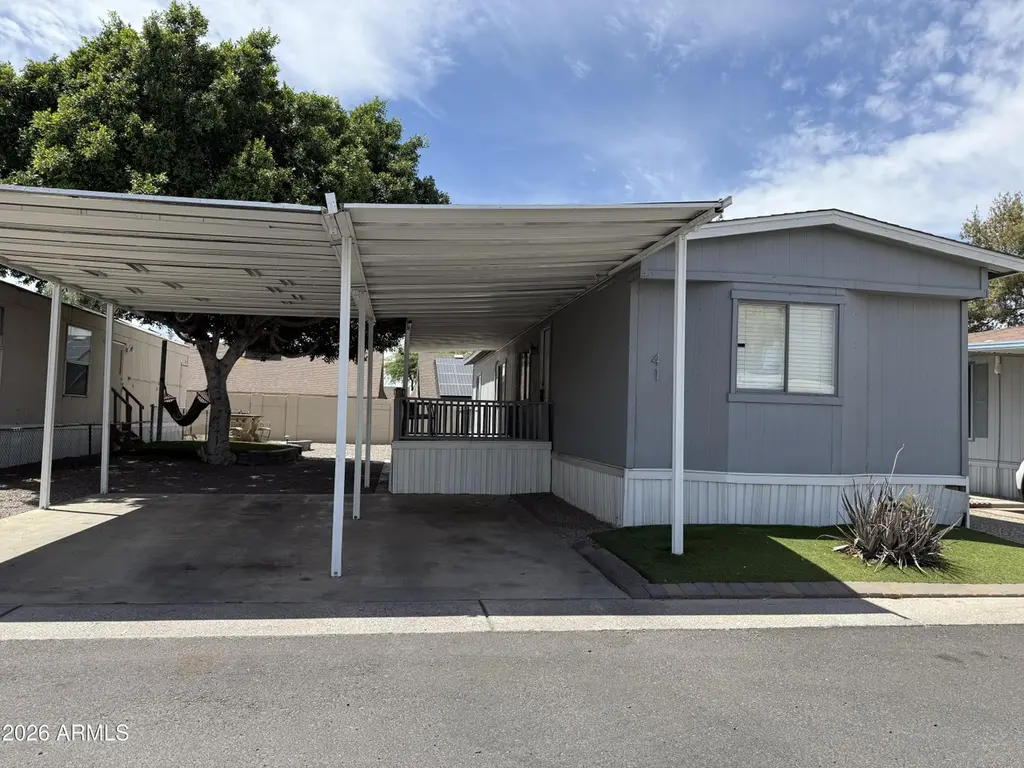
19401 N 7th St #41 · Phoenix, AZ
Flood risk 1/10 · Minimal
- FEMA flood zone
- X (shaded)
- Chance of flooding over 30 yrs
- 0.0%
- Est. flood insurance / yr
- $507 – $1,088
Fire risk 4/10 · Minor
- Est. fire insurance / yr
- $610 – $1,132
Heat risk 8/10 · Major
- Hot days now (above 111°F)
- 6 days/yr
- Hot days in 30 yrs
- 16 days/yr
Wind risk 1/10 · Minimal
- Chance of severe wind over 30 yrs
- —
Air-quality risk 3/10 · Minor
- Unhealthy air days now
- 2 days/yr
- Unhealthy air days in 30 yrs
- 3 days/yr
Risk factors via First Street. Map © Google.
Why this score? — see what drove the B grade
The composite is a weighted blend of 9 inputs, each scored 0–100. Each bar is that input's sub-score; the figure is the points it added to the 100-point composite (weight × sub-score).
- Cash flow +30.0/30.0
- 1% rule +10.0/10.0
- DSCR +10.0/10.0
- ARV discount +7.5/15.0
- Condition / age +4.0/5.0
- Schools +3.8/10.0
- Livability +3.8/5.0
- Rent growth +2.9/5.0
- Appreciation +0.0/10.0
$65,000
🖨 Deal sheet 📄 Offer letter ✓ Due diligence
Listing remarks
This cozy home is completely remodeled! Such a great starter home in a quiet subdivision. There is a small peaceful yard and 2car carport! Do not miss this one!
Key facts
- Completely remodeled
- 2car carport
- Quiet subdivision
Tags
Property features AI
Finance
- HOA & community: Land lease community; Land lease fee $880 monthly; No additional association fees listed
Exterior
- Parking: Covered parking for 2 vehicles; 2 carport spaces
- Utilities: City water; Public sewer
- Home design: Manufactured/mobile home; Leasehold ownership
- Construction: Wood siding and painted exterior; Composition roof
- Exterior features: Block and chain link fencing; Gravel/stone front; Synthetic grass front
Interior
- Kitchen: Refrigerator; Dishwasher
- Bedrooms: Up to 2 bedrooms (possible)
- Bathrooms: 1 full bathroom
- Heating & cooling: Mini split cooling; Window/wall unit cooling; Mini split heating; Floor furnace; Wall furnace
- Interior features: Eat-in kitchen
- Laundry & utility: No laundry hookups in unit
Neighborhood map
What this means for you Summary
Snapshot
- This is a 2-bed/1.0-bath manufactured listed at $65k. Condition is rated good.
Deal economics
- At list price, monthly cash flow is $866 ($10k/yr) — positive.
- The deal already cash-flows at list — no discount required.
- Meets the 1% rule at list price ($2k rent vs $65k).
- Cap rate 22.3% vs local median 3.3% in Phoenix — top-decile yield for the area; either an underpriced asset or a hidden risk that comps aren't pricing in. Stress-test before assuming the spread holds.
Location & tenants
- Location reads 75/100 on livability (#16 in AZ, #3,924 nationally) — a middle-class / working-renter tenant base. Strengths: amenities A+, commute A+, housing A+; Watch: health & safety C-, crime F.
- Paradise Valley Unified District (4241) (urban): math 39% / reading 46% proficiency, ranked #56 of 249 in AZ (top 22%) — families likely to look elsewhere, expect single-tenant / working-renter base with shorter leases.
- Zoned schools: Eagle Ridge Elementary School (math 25% / reading 30%, grade F, #592 of 1,109 statewide, top 54%, 374 students, 61% FRL); Mountain Trail Middle School (math 33% / reading 41%, grade F, #57 of 218 statewide, top 27%, 680 students, 24% FRL); North Canyon High School (math 13% / reading 23%, grade F, #242 of 381 statewide, top 64%, 1,842 students, 55% FRL) — zoned schools average 47% FRL vs 29% district-wide (17 pts higher); higher-poverty schools than district average — tighter screening recommended.
- Zoned-school proficiency averages 28% at this address vs 42% district-wide (-15 pts) — the specific schools serving this property underperform the Paradise Valley Unified District (4241) average; the district grade overstates school quality for this exact location.
- Market conditions: Rents rising (+1.4%/yr); 201 active listings in the ZIP; 31 comparable units currently listed for rent nearby; rentals leasing fast (median 8d on market — plan ~1-2 weeks tenant-placement turnaround); solid renter incomes; 36,011 units permitted in Maricopa County in 2024 (12,801 in 5+ unit buildings).
Forward outlook
- Local home prices are declining (-3.0%/yr); year-one equity from $449 of loan paydown is wiped out by about $2k of value loss. Plan a longer hold.
- Maricopa County population projected at +38% by 2050 — long-run rental-demand tailwind backs the buy-and-hold thesis.
- At projected returns (-3.0% appreciation + 1.4% rent growth), your $18k cash investment doubles in ~3 years — after that, you're playing with house money.
Negotiation context
- Only 11 days on market — expect competitive offers; lowballing is unlikely to land.
Risks & watch-outs
- Climate carrying-cost: extreme-heat days projected 6→16/yr by 2055 (HVAC capex compounding) — expect insurance premiums to compound above CPI over the hold.
Questions for the listing agent
- Is there a deadline driving the sale (1031 exchange, divorce, estate, relocation)? That informs how much negotiation room exists.
- Crime grade is F in this area — have there been break-ins, vandalism, or insurance claims at this property in the last 3 years? What carrier currently insures it and at what premium?
- What's the average days-on-market for RENTAL listings here right now (not sales)? A rising rental-DOM trend means longer vacancies and softer asking-rent achievability than the comps imply.
- What's the recent tenant-quality profile in this submarket — average credit score on applications, eviction rate, late-payment / NSF rate, and stable-employment percentage? A property-management company in the area should have these aggregated.
- How much new for-sale + rental construction is in the pipeline within 1–3 miles? Heavy new supply typically softens prices + rents 12–24 months out; constrained supply supports both.
Investment metrics
- 1% rule
- 2.56% ✓
- Cap rate
- 22.28%
- Cash-on-cash
- 57.09%
- DSCR
- 3.54
- GRM
- 3.3
CMA / ARV
- ARV (on-the-fly)
- $183,200
- Comps found
- 6
Show comp detail 6 sales within ~0.75 mi
| Address | Dist | Beds/Ba | Sqft | Sold | Price | $/sf | Match |
|---|---|---|---|---|---|---|---|
| 18217 N 2nd Pl | 0.62mi | 2/1.0 | 833 (+4%) | 4mo | $180,000 | $216 | 61 |
| 18231 N 6th St N | 0.45mi | 2/2.0 | 840 (+5%) | 13mo | $225,000 | $268 | 56 |
| 17825 N 7th St #105 | 0.70mi | 2/2.0 | 840 (+5%) | 1mo | $35,000 | $42 | 55 |
| 18441 N 1st St | 0.61mi | 2/2.0 | 840 (+5%) | 8mo | $230,000 | $274 | 52 |
| 18426 N 1st St | 0.65mi | 2/1.5 | 720 (-10%) | 9mo | $165,000 | $229 | 43 |
| 412 E Wagoner Rd | 0.49mi | 3/2.0 (+1) | 890 (+11%) | 12mo | $130,000 | $146 | 40 |
Match score weights: distance 35% · size 25% · config 20% · recency 20%. Top-matched comps best support the ARV.
Projected returns pro-forma
-3.0% appreciation · 1.44% rent growth · sell at horizon
- IRR
- 53.8%
- Equity multiple
- 3.31×
- Total profit
- $42,064
- Equity at exit
- $9,692
- IRR
- 58.3%
- Equity multiple
- 6.36×
- Total profit
- $97,506
- Equity at exit
- $5,620
Cash invested: $18,200 (down + closing). Projections, not guarantees.
Landlord ↔ Tenant lean methodology
- Overall (STATE)
- 87 Strongly Landlord-Friendly
- State Arizona
- 87 Strongly Landlord-Friendly · R+3
- County
- — inherits STATE
- City
- — inherits STATE
ZIP-level market 85024
- Home prices YoY
- -21.0%
- Rents YoY
- 1.4%
- Active inventory
- 201
- Price-to-rent
- 3.3×
Monthly cashflow live
- Estimated rent
- $1,665 high interval (Pro) →
- Mortgage (P&I)
- −$341
- Tax est. 1.5%
- −$81 /mo · $975/yr
- Insurance
- −$27
- HOA
- −$0
- Vacancy / Maint / Mgmt
- −$350
- Net cashflow
- $866
Break-even live
UW: 25.0% down · 7.5% · 30yr · 1.5% tax · 5.0% vac · 8.0% maint · 8.0% mgmt
Financing live
Cash to close
- Down payment
- $16,250
- Closing costs
- $1,950
- Reserves months
- —
- Total cash needed
- —
Loan-product check · same deal, 3 products live
Conventional
25% down · 7.5% · 30yr
- Down + closing
- —
- Monthly P&I
- —
- Monthly cashflow
- —
- DSCR
- —
- Eligible?
- —
Personal DTI + credit; lowest rate.
DSCR
20% down · 8.5% · 30yr
- Down + closing
- —
- Monthly P&I
- —
- Monthly cashflow
- —
- DSCR
- —
- Eligible?
- —
No personal income docs; deal must DSCR.
Hard money
10% down · 12.0% · 12mo
- Down + closing
- —
- Monthly P&I
- —
- Monthly cashflow
- —
- DSCR
- —
- Eligible?
- —
Short-term bridge; refi at stabilization.
Rent comps 31 comps
| Address | Beds | Baths | Sqft | Rent | $/sqft | DOM | Units | Dist |
|---|---|---|---|---|---|---|---|---|
| 19601 N 7th St Phoenix, AZ | 2.0–3.0 | 2.0–2.5 | 1000 | $1,295 | $1.29 | 5d | 3 | 0.37mi |
| 726 E Villa Rita Dr Phoenix, AZ | 2.0 | 2.0 | 1088 | $2,000 | $1.84 | 18d | 1 | 0.54mi |
| 726 E Villa Rita Dr Phoenix, AZ | 2.0 | 2.0 | 1088 | $2,000 | $1.84 | 11d | 1 | 0.54mi |
| 1032 E Villa Maria Dr Phoenix, AZ | 2.0 | 2.0 | 1097 | $1,850 | $1.69 | 20d | 1 | 0.57mi |
| 1032 E Villa Maria Dr Phoenix, AZ | 2.0 | 2.0 | 1097 | $1,850 | $1.69 | 7d | 1 | 0.57mi |
| 719 E Lola Dr Phoenix, AZ | 1.0 | 1.0 | 688 | $2,900 | $4.22 | 7d | 1 | 0.63mi |
| 18217 N 2nd Pl Phoenix, AZ | 2.0 | 1.0 | 833 | $1,300 | $1.56 | 16d | 1 | 0.65mi |
| 1130 E Grovers Ave Phoenix, AZ | 2.0 | 2.0 | 934 | $1,336 | $1.43 | 2d | 12 | 0.79mi |
| 17625 N 7th St Phoenix, AZ | 1.0–3.0 | 1.0–2.0 | 925 | $1,369 | $1.48 | 3d | 7 | 0.86mi |
| 20435 N 7th St Phoenix, AZ | 1.0–3.0 | 1.0–2.0 | 957 | $1,722 | $1.80 | 2d | 20 | 0.86mi |
| 17617 N 9th St Phoenix, AZ | 1.0–3.0 | 1.0–2.0 | 956 | $1,513 | $1.58 | 2d | 35 | 0.90mi |
| 17249 N 7th St Phoenix, AZ | 1.0–3.0 | 1.0–2.0 | 956 | $1,518 | $1.59 | 2d | 37 | 1.10mi |
| 310 W Pontiac Dr #8 Phoenix, AZ | 2.0 | 2.0 | 994 | $1,700 | $1.71 | 15d | 1 | 1.14mi |
| 409 W Pontiac Dr #3 Phoenix, AZ | 2.0 | 2.0 | 863 | $1,495 | $1.73 | 24d | 1 | 1.16mi |
| 1100 E Bell Rd Phoenix, AZ | 1.0–3.0 | 1.0–2.0 | 987 | $1,822 | $1.85 | 1d | 26 | 1.22mi |
| 312 W Yukon Dr #2 Phoenix, AZ | 2.0 | 2.0 | 863 | $1,550 | $1.80 | 24d | 1 | 1.23mi |
| 312 W Yukon Dr #7 Phoenix, AZ | 2.0 | 2.0 | 863 | $1,425 | $1.65 | 22d | 1 | 1.23mi |
| 317 W Hononegh Dr Phoenix, AZ | 2.0 | 2.0 | 994 | $1,495 | $1.50 | 18d | 1 | 1.25mi |
| 511 W Blackhawk Dr #4 Phoenix, AZ | 2.0 | 2.0 | 994 | $1,550 | $1.56 | 24d | 1 | 1.26mi |
| 501 W Yukon Dr #4 Phoenix, AZ | 2.0 | 2.0 | 994 | $1,695 | $1.71 | 7d | 1 | 1.28mi |
| 1450 E Bell Rd Phoenix, AZ | 1.0–3.0 | 1.0–2.0 | 957 | $1,555 | $1.62 | 2d | 93 | 1.31mi |
| 601 W Yukon Dr #3 Phoenix, AZ | 2.0 | 2.0 | 863 | $1,563 | $1.81 | 43d | 1 | 1.31mi |
| 10 E Bell Rd Phoenix, AZ | 2.0 | 1.0–2.0 | 658 | $1,419 | $2.16 | 2d | 33 | 1.31mi |
| 17017 N 12th St Phoenix, AZ | 1.0–2.0 | 1.0 | 910 | $2,500 | $2.75 | 24d | 2 | 1.34mi |
| 110 W Bell Rd Phoenix, AZ | 1.0 | 1.0 | 845 | $1,499 | $1.77 | 7d | 1 | 1.38mi |
| 20350 N 7th Ave Phoenix, AZ | 2.0 | 1.0–2.0 | 844 | $2,038 | $2.41 | 2d | 55 | 1.40mi |
| 110 W Bell Rd Unit 1 Phoenix, AZ | 1.0 | 1.0 | 739 | $1,299 | $1.76 | 24d | 1 | 1.40mi |
| 110 W Bell Rd Unit 2 Phoenix, AZ | 2.0 | 2.0 | 980 | $1,649 | $1.68 | 24d | 1 | 1.40mi |
| 110 W Bell Rd Unit 12 Phoenix, AZ | 1.0 | 1.0 | 856 | $1,399 | $1.63 | 24d | 1 | 1.40mi |
| 220 W Bell Rd Phoenix, AZ | 1.0–3.0 | 1.0–2.0 | 1082 | $1,564 | $1.45 | 1d | 32 | 1.44mi |
| 11 E Bell Rd Phoenix, AZ | 1.0–2.0 | 1.0–2.0 | 950 | $1,705 | $1.79 | 1d | 11 | 1.46mi |
Listing history 8 events
-
2026-06-18days on market $65,000 Active 11 DOM
-
2026-06-17days on market $65,000 Active 10 DOM
-
2026-06-16days on market $65,000 Active 9 DOM
-
2026-06-15days on market $65,000 Active 8 DOM
-
2026-06-13days on market $65,000 Active 6 DOM
-
2026-06-13days on market $65,000 Active 5 DOM
-
2026-06-09remarks 160-char remark
-
2026-06-09$65,000 Active 2 DOM
ⓘ Source: listings_history table (triggers on properties + properties_extension) + one-shot
backfill from property_details.listing_events for pre-trigger history.
Climate risk First Street
- Flood 1/10 Low FEMA zone X (shaded) · 0% chance over 30 yrs
- Wildfire 4/10 Moderate
- Heat 8/10 Severe 6 d/yr ≥111°F today · 16 d/yr by 30 yrs out
- Wind 1/10 Low
- Air quality 3/10 Moderate 2 unhealthy d/yr today · 3 by 30 yrs out
Nearby sold comps map
Loading sold comps map…
Walkable amenities ~0.75 mi
Loading nearby amenities…
Taxation est. · year 1
- Rental income
- $19,975
- − Mortgage interest
- −$3,641
- − Property taxes
- −$975
- − Insurance
- −$325
- − Repairs & maintenance
- −$1,598
- − Management
- −$1,598
- − Depreciation
- −$1,891
- Taxable income
- $9,947
- Est. tax owed @ 24.0%
- −$2,387
- After-tax cash flow
- $8,003/yr
For passive investors: Depreciation is non-cash, so a rental often shows a tax loss while cash-flowing — sheltering income. Rental losses are passive: they offset passive income freely, and up to $25,000/yr can offset ordinary (W-2) income if you actively participate and your MAGI is under $100k (phasing out to $0 by $150k); unused losses carry forward. On sale, claimed depreciation is recaptured at up to 25%, and gains may owe capital-gains tax (a 1031 exchange can defer both). Figures are a year-1 estimate at your 24.0% rate — not tax advice; consult a CPA.
Condition & rehab AI · 6 photos
This completely remodeled mobile home is in good condition with a fresh paint job and modern updates, making it a great starter home in a quiet neighborhood.
Value-add opportunities
- Both Painting exterior and interior walls — Fresh paint enhances curb appeal and interior aesthetics.
- Both Landscaping improvements — Enhances curb appeal and adds value to the property.
- Resale Kitchen appliances — Modern appliances improve the home's appeal to potential buyers.
- Resale Bathroom fixtures — Upgraded fixtures can attract more buyers and renters.
- Both Flooring replacement — New flooring can improve the home's appearance and add value to the property.
Renovation cost estimate screening
Value-add ROI direction
- Both Painting exterior and interior walls — Fresh paint enhances curb appeal and interior aesthetics. ↑
- Both Landscaping improvements — Enhances curb appeal and adds value to the property. ↑
- Resale Kitchen appliances — Modern appliances improve the home's appeal to potential buyers. ↑
- Resale Bathroom fixtures — Upgraded fixtures can attract more buyers and renters. ↑
- Both Flooring replacement — New flooring can improve the home's appearance and add value to the property. ↑
ⓘ Cost ranges are severity-bucket heuristics (US national rule-of-thumb). Get contractor quotes + a written scope before underwriting a rehab budget.
Schools (NCES district)
- District
- Paradise Valley Unified District (4241)
- NCES district ID
- 0405930
- Math proficiency
- 39% ▼ -11.00%
- Reading proficiency
- 46% ▼ -7.00%
- Median HH income
- $64,106
- Composite
- 37.89/100
- National rank
- #4316
- State rank
- #56 of 249 in AZ
Livability — Phoenix
- Score
- 75/100
- State rank
- #16
- US rank
- #3924
Category grades
Schools grade is shown separately in the Schools card above.
Census & demographics
- Census place
- Phoenix, AZ
- County
- Maricopa County · 4,537,380 people
- City population
- 1,500,198
- Metro
- Phoenix-Mesa-Chandler, AZ
- Population (ZIP)
- 26,199
- Household income
- $106,724
- Rent vs Own
- Severe rent burden
- 547.0
Population outlook (Maricopa County) Hauer SSP2
- Today (2025)
- 4,979,203 people
- By 2030
- 5,378,229 · +8.0%
- By 2040
- 6,156,598 · +23.6%
- By 2050
- 6,872,376 · +38.0%
- By 2075
- 8,401,270 · +68.7%
- By 2100
- 9,247,439 · +85.7%
Race, ethnicity, and origin ACS 2023
- Neighborhood character
- Predominantly White (71%)
- Race & ethnicity
- White 71% Hispanic / Latino 16% Two or more races 12% Asian 6% Black 2%
- Hispanic origin (detail)
- Mexican 13% Puerto Rican 1%
- Common ancestry
- Romanian 3% Italian 3% Portuguese 3%
- Foreign-born
- 12% · Canada, China, South Korea
- Languages at home
- 78% English-only · Spanish 10% Other Indo-European 4% Russian/Polish/Slavic 1%
Political lean MEDSL · Maricopa
- 2024 margin
- Toss-up / Even · D 47.7% · R 51.2% · Other 1.1%
- 2008→2024 swing
- +7.1pp toward D · 2008: -10.6pp · 2024: -3.5pp
- All cycles
- 2024: R+3.5 2020: D+2.2 2016: R+3.5 2012: R+12.0 2008: R+10.6
Not yet ingested
- Civics
- —
Market trends
- HPI YoY
- ▼ -82.95%
- Current HPI
- 312.7238
- Rent YoY
- ▲ 1.44%
- Metro
- Phoenix-Mesa-Chandler, AZ
- State GDP YoY
- ▲ 4.54%
- F500 in state
- 20
Industry mix (Fortune 500 HQ in AZ)
| Industry | F500 HQs | Revenue |
|---|---|---|
| Technology | 2 | $13B |
|
||
| Mining / Metals | 1 | $23B |
|
||
| Environmental Services | 1 | $16B |
|
||
| Metals / Steel | 1 | $14B |
|
||
| Technology Distribution | 1 | $9B |
|
||
| Homebuilding | 1 | $8B |
|
||
Price history
1 event — show timeline
- 2026-06-05 Listed $65,000 ARMLS
Cash-flow waterfall
monthlySold comps — $/sqft
last 12 mo · ≤1 miLoading sold comps…