220 Sandbar Ln #101 · Hardeeville, SC
Flood risk No data
- FEMA flood zone
- —
- Chance of flooding over 30 yrs
- —
- Est. flood insurance / yr
- —
Fire risk No data
- Est. fire insurance / yr
- —
Heat risk No data
- Hot days now (above threshold)
- —
- Hot days in 30 yrs
- —
Wind risk No data
- Chance of severe wind over 30 yrs
- —
Air-quality risk No data
- Unhealthy air days now
- —
- Unhealthy air days in 30 yrs
- —
Risk factors via First Street. Map © Google.
Why this score? — see what drove the D- grade
The composite is a weighted blend of 9 inputs, each scored 0–100. Each bar is that input's sub-score; the figure is the points it added to the 100-point composite (weight × sub-score).
- Appreciation +10.0/10.0
- Cash flow +8.1/30.0
- ARV discount +5.6/15.0
- Livability +3.2/5.0
- Condition / age +2.5/5.0
- DSCR +2.1/10.0
- Rent growth +2.1/5.0
- 1% rule +1.6/10.0
- Schools +1.4/10.0
$355,000
🖨 Deal sheet 📄 Offer letter ✓ Due diligence
Listing remarks MLS
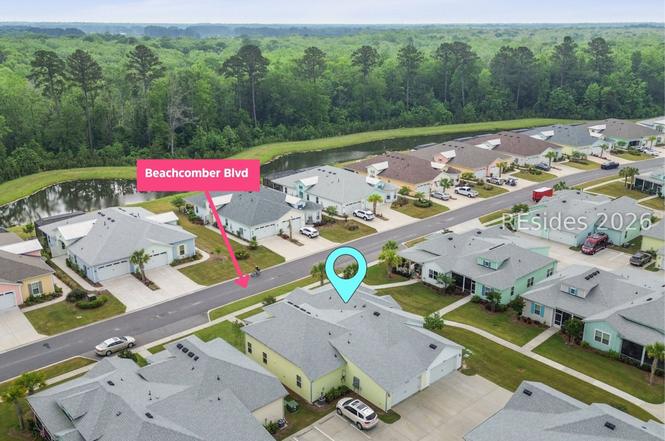
Enjoy the good life in this Bamboo floor plan in Phase 3 near Beachcomber Blvd! East-facing screened front patio is perfect for shady mornings. Features granite kitchen counters, quartz in baths, and easy parking. Live like you're on vacation with top-notch amenities resort-style pool, indoor pool, fitness center, restaurant, bar, live music, theater, walking trails, dog park, pickleball, tennis, and a private beach club. Everything you need for fun and relaxation is right here!
Key facts
- Fitness center
- Private beach club
- Quartz in baths
Tags
Property features AI
Finance
- Other: Located in a senior community; 1 lot
- HOA & community: Community amenities include clubhouse, fitness center, bocce court, pickleball and tennis courts, trails, dog park, pool, business center, fire pit, barbecue/picnic area, restaurant, guard
Exterior
- Parking: 2-car garage
- Utilities: Public water
- Home design: Single-story; Composite siding; Asphalt roof
- Construction: Composite siding construction; Asphalt roof
- Exterior features: Enclosed porch; Screened porch; Patio; Porch; Community pool
Interior
- Kitchen: Dishwasher; Disposal; Microwave; Refrigerator; Eat-in kitchen; Pantry
- Flooring: Vinyl
- Bathrooms: 2 full bathrooms
- Heating & cooling: Gas heating; Central air conditioning
- Interior features: Ceiling fans; Smooth ceilings; Multiple closets; Pantry; Eat-in kitchen
- Laundry & utility: Washer; Dryer; Utility room
Neighborhood map
What this means for you Summary
Snapshot
- This is a 2-bed/2.0-bath single-family listed at $355k.
Deal economics
- At list price, monthly cash flow is $-348 ($-4k/yr) — negative.
- To cash-flow at today's rent, offer at most $293k (17.3% below list).
- To meet the 1% rule (rent ≥ 1% of price), the offer needs to be $235k (33.9% below list).
- Recommended offer: $235k (33.9% below list) — sets the bar for 1% rule.
- Cap rate 5.1% vs local median 3.6% in Hardeeville — top-decile yield for the area; either an underpriced asset or a hidden risk that comps aren't pricing in. Stress-test before assuming the spread holds.
Location & tenants
- Location reads 65/100 on livability (#136 in SC) — a middle-class / working-renter tenant base. Strengths: health & safety A+, crime B+, housing B+; Watch: schools F, amenities F, commute F.
- Jasper 01 (rural): math 12% / reading 22% proficiency, ranked #77 of 80 in SC (top 96%) — low school quality limits family demand, transient renter base, plan for 1-2y turnover; 78% free/reduced lunch — lower-income household profile, screen leases tightly.
- Market conditions: Rents soft (-1.7%/yr); 503 active listings in the ZIP; 5 comparable units currently listed for rent nearby; rentals at typical pace (median 21d on market — plan ~3-4 weeks tenant-placement turnaround); 1,385 units permitted in Jasper County in 2024 (0 in 5+ unit buildings).
- This rent runs 39% of the median local income ($73k/yr) — at the standard rent-burdened threshold; future hikes will face affordability resistance.
Forward outlook
- In year one you build about $38k of equity ($2k loan paydown + $36k appreciation (10.0% local appreciation)).
- Jasper County population projected at +46% by 2050 — long-run rental-demand tailwind backs the buy-and-hold thesis.
- By year 2, paydown + projected appreciation supports a ~$61k cash-out refi (75% LTV) — recoverable capital for the next deal without selling this one.
Negotiation context
- It's been on market 105 days — a 9% lower offer ($323k) is reasonable based on typical stale-listing flexibility.
- 5 sale attempts since 6y ago with the ask held roughly flat each time — persistent listings suggest the price (not the market) is what's stuck; bring a comps-based counter.
- Current owner paid $236k; list at $355k implies a 50% gain — meaningful room to come down on a strong offer.
Questions for the listing agent
- What do current leases actually rent for vs. the listed asking? Can we see a recent rent roll and the last 12 months of T-12 income?
- It's been on market 105 days. Have you received any prior offers? Is the seller open to a 34% concession, seller financing, or rate buy-down credit?
- Why hasn't it sold? Are there any deal-killer items the seller is aware of (foundation, flood, title, zoning, code violations)?
- Is there a deadline driving the sale (1031 exchange, divorce, estate, relocation)? That informs how much negotiation room exists.
- Schools are F-rated, which usually means shorter tenancies and higher turnover. Who's the typical renter profile here, and what's been the actual vacancy rate?
- The area grade is low — what's the realistic commute time and amenity access for the typical tenant pool here? Any planned neighborhood developments (good or bad) we should know about?
- What's the average days-on-market for RENTAL listings here right now (not sales)? A rising rental-DOM trend means longer vacancies and softer asking-rent achievability than the comps imply.
- What's the recent tenant-quality profile in this submarket — average credit score on applications, eviction rate, late-payment / NSF rate, and stable-employment percentage? A property-management company in the area should have these aggregated.
- How much new for-sale + rental construction is in the pipeline within 1–3 miles? Heavy new supply typically softens prices + rents 12–24 months out; constrained supply supports both.
Investment metrics
- 1% rule
- 0.66% ✗
- Cap rate
- 5.12%
- Cash-on-cash
- -4.20%
- DSCR
- 0.81
- GRM
- 12.6
CMA / ARV
- ARV (on-the-fly)
- $340,732
- Comps found
- 12
Show comp detail 12 sales within ~0.75 mi
| Address | Dist | Beds/Ba | Sqft | Sold | Price | $/sf | Match |
|---|---|---|---|---|---|---|---|
| 151 Island Breeze Ln #102 | 0.08mi | 2/2.0 | 1,204 (0%) | 5mo | $385,000 | $320 | 92 |
| 676 Beachcomber Blvd | 0.18mi | 2/2.0 | 1,210 (+0%) | 1mo | $348,000 | $288 | 90 |
| 43 Barefoot Ln #101 | 0.16mi | 2/2.0 | 1,321 (+10%) | 3mo | $389,000 | $294 | 74 |
| 218 Landing Ln | 0.44mi | 2/2.0 | 1,165 (-3%) | 8mo | $264,000 | $227 | 68 |
| 117 Barefoot Ln #101 | 0.13mi | 2/2.0 | 1,378 (+14%) | 3mo | $385,000 | $279 | 67 |
| 690 Beachcomber Blvd #101 | 0.17mi | 2/2.0 | 1,378 (+14%) | 3mo | $390,000 | $283 | 66 |
| 38 Nesting Ln | 0.61mi | 2/2.0 | 1,138 (-6%) | 6mo | $310,000 | $272 | 57 |
| 71 Cypress Run | 0.72mi | 2/2.0 | 1,156 (-4%) | 8mo | $335,000 | $290 | 54 |
| 32 Tupelo Ct | 0.63mi | 2/2.0 | 1,328 (+10%) | 6mo | $305,000 | $230 | 48 |
| 36 Nesting Ln | 0.62mi | 3/2.0 (+1) | 1,338 (+11%) | 1mo | $375,000 | $280 | 47 |
| 27 Golden Eagle Dr | 0.62mi | 2/2.0 | 1,341 (+11%) | 9mo | $399,000 | $298 | 45 |
| 561 Colonel Thomas Heyward Rd | 0.69mi | 2/2.0 | 1,328 (+10%) | 8mo | $375,000 | $282 | 44 |
Match score weights: distance 35% · size 25% · config 20% · recency 20%. Top-matched comps best support the ARV.
Projected returns pro-forma
10.0% appreciation · 0.0% rent growth · sell at horizon
- IRR
- 20.5%
- Equity multiple
- 2.65×
- Total profit
- $164,166
- Equity at exit
- $319,812
- IRR
- 18.2%
- Equity multiple
- 5.91×
- Total profit
- $488,342
- Equity at exit
- $689,687
Cash invested: $99,400 (down + closing). Projections, not guarantees.
Landlord ↔ Tenant lean methodology
- Overall (STATE)
- 90 Strongly Landlord-Friendly
- State South Carolina
- 90 Strongly Landlord-Friendly · R+6
- County
- — inherits STATE
- City
- — inherits STATE
ZIP-level market 29927
- Home prices YoY
- 18.8%
- Rents YoY
- -1.7%
- Active inventory
- 503
- Price-to-rent
- 12.6×
Monthly cashflow live
- Estimated rent
- $2,345 high interval (Pro) →
- Mortgage (P&I)
- −$1,862
- Tax from tax record
- −$192 /mo · $2,298/yr
- Insurance
- −$148
- HOA
- −$0
- Vacancy / Maint / Mgmt
- −$493
- Net cashflow
- $-348
Break-even live
UW: 25.0% down · 7.5% · 30yr · 1.5% tax · 5.0% vac · 8.0% maint · 8.0% mgmt
Financing live
Cash to close
- Down payment
- $88,750
- Closing costs
- $10,650
- Reserves months
- —
- Total cash needed
- —
Loan-product check · same deal, 3 products live
Conventional
25% down · 7.5% · 30yr
- Down + closing
- —
- Monthly P&I
- —
- Monthly cashflow
- —
- DSCR
- —
- Eligible?
- —
Personal DTI + credit; lowest rate.
DSCR
20% down · 8.5% · 30yr
- Down + closing
- —
- Monthly P&I
- —
- Monthly cashflow
- —
- DSCR
- —
- Eligible?
- —
No personal income docs; deal must DSCR.
Hard money
10% down · 12.0% · 12mo
- Down + closing
- —
- Monthly P&I
- —
- Monthly cashflow
- —
- DSCR
- —
- Eligible?
- —
Short-term bridge; refi at stabilization.
Rent comps 5 comps
| Address | Beds | Baths | Sqft | Rent | $/sqft | DOM | Units | Dist |
|---|---|---|---|---|---|---|---|---|
| 37 Nesting Ln Bluffton, SC | 2.0 | 2.0 | 1158 | $2,350 | $2.03 | 13d | 1 | 0.65mi |
| 120 Treasure Past Way Hardeeville, SC | 2.0 | 2.0 | 1204 | $2,750 | $2.28 | 21d | 1 | 0.88mi |
| 1495 Shoreside Dr Hardeeville, SC | 2.0 | 2.0 | 1378 | $2,850 | $2.07 | 13d | 1 | 1.18mi |
| 1417 Shoreside Dr Hardeeville, SC | 2.0 | 2.0 | 1204 | $2,600 | $2.16 | 21d | 1 | 1.20mi |
| 61 Tropics Ave Unit 1 Hardeeville, SC | 2.0 | 2.0 | 1321 | $2,650 | $2.01 | 21d | 1 | 1.47mi |
Listing history 31 events
-
2026-06-18days on market $355,000 Active 105 DOM
-
2026-06-17days on market $355,000 Active 104 DOM
-
2026-06-16days on market $355,000 Active 103 DOM
-
2026-06-15pricedays on market $355,000 Active 102 DOM
-
2026-06-14days on market $362,000 Active 100 DOM
-
2026-06-13days on market $362,000 Active 99 DOM
-
2026-06-10days on market $362,000 Active 97 DOM
-
2026-06-09days on market $362,000 Active 96 DOM
-
2026-06-08days on market $362,000 Active 95 DOM
-
2026-06-07days on market $362,000 Active 94 DOM
-
2026-06-03days on market $362,000 Active 90 DOM
-
2026-06-02days on market $362,000 Active 89 DOM
-
2026-06-01days on market $362,000 Active 88 DOM
-
2026-05-31days on market $362,000 Active 87 DOM
-
2026-05-30days on market $362,000 Active 86 DOM
-
2026-05-04price $362,000
Show marketing remark (483 chars)
Enjoy the good life in this Bamboo floor plan in Phase 3 near Beachcomber Blvd! East-facing screened front patio is perfect for shady mornings. Features granite kitchen counters, quartz in baths, and easy parking. Live like you're on vacation with top-notch amenities resort-style pool, indoor pool, fitness center, restaurant, bar, live music, theater, walking trails, dog park, pickleball, tennis, and a private beach club. Everything you need for fun and relaxation is right here!
-
2026-05-04price $362,000 483-char remark
Show marketing remark (483 chars)
Enjoy the good life in this Bamboo floor plan in Phase 3 near Beachcomber Blvd! East-facing screened front patio is perfect for shady mornings. Features granite kitchen counters, quartz in baths, and easy parking. Live like you're on vacation with top-notch amenities resort-style pool, indoor pool, fitness center, restaurant, bar, live music, theater, walking trails, dog park, pickleball, tennis, and a private beach club. Everything you need for fun and relaxation is right here!
-
2026-03-25price $365,000
Show marketing remark (483 chars)
Enjoy the good life in this Bamboo floor plan in Phase 3 near Beachcomber Blvd! East-facing screened front patio is perfect for shady mornings. Features granite kitchen counters, quartz in baths, and easy parking. Live like you're on vacation with top-notch amenities resort-style pool, indoor pool, fitness center, restaurant, bar, live music, theater, walking trails, dog park, pickleball, tennis, and a private beach club. Everything you need for fun and relaxation is right here!
-
2026-03-25price $365,000 483-char remark
Show marketing remark (483 chars)
Enjoy the good life in this Bamboo floor plan in Phase 3 near Beachcomber Blvd! East-facing screened front patio is perfect for shady mornings. Features granite kitchen counters, quartz in baths, and easy parking. Live like you're on vacation with top-notch amenities resort-style pool, indoor pool, fitness center, restaurant, bar, live music, theater, walking trails, dog park, pickleball, tennis, and a private beach club. Everything you need for fun and relaxation is right here!
-
2026-03-05$370,000 Active
Show marketing remark (483 chars)
Enjoy the good life in this Bamboo floor plan in Phase 3 near Beachcomber Blvd! East-facing screened front patio is perfect for shady mornings. Features granite kitchen counters, quartz in baths, and easy parking. Live like you're on vacation with top-notch amenities resort-style pool, indoor pool, fitness center, restaurant, bar, live music, theater, walking trails, dog park, pickleball, tennis, and a private beach club. Everything you need for fun and relaxation is right here!
-
2026-03-05$370,000 Active 483-char remark
Show marketing remark (483 chars)
Enjoy the good life in this Bamboo floor plan in Phase 3 near Beachcomber Blvd! East-facing screened front patio is perfect for shady mornings. Features granite kitchen counters, quartz in baths, and easy parking. Live like you're on vacation with top-notch amenities resort-style pool, indoor pool, fitness center, restaurant, bar, live music, theater, walking trails, dog park, pickleball, tennis, and a private beach club. Everything you need for fun and relaxation is right here!
-
2025-09-29price $379,900
-
2025-09-29price $379,900
-
2025-08-15price $384,900
-
2025-08-15price $384,900
-
2025-06-05price $389,900
-
2025-06-05price $389,900
-
2025-05-08$397,000 Active
-
2025-05-05$397,000 Active
-
2021-05-13soldstatus $236,070
-
2020-08-31$236,070
ⓘ Source: listings_history table (triggers on properties + properties_extension) + one-shot
backfill from property_details.listing_events for pre-trigger history.
Tax reassessment forecast SC · Resets to sale price
- Current annual tax
- $2,298 · $192/mo
- Projected year-2 tax
- $2,298 · $192/mo
- Expected delta
- $0/yr ($0/mo · 0.0%)
ⓘ Screening estimate from a state-policy table — verify with the county assessor before closing.
Nearby sold comps map
Loading sold comps map…
Walkable amenities ~0.75 mi
Loading nearby amenities…
Taxation est. · year 1
- Rental income
- $28,144
- − Mortgage interest
- −$19,886
- − Property taxes
- −$2,298
- − Insurance
- −$1,775
- − Repairs & maintenance
- −$2,252
- − Management
- −$2,252
- − Depreciation
- −$10,327
- Taxable loss
- −$10,645
- Est. tax savings @ 24.0%
- +$2,555
- After-tax cash flow
- $-1,625/yr
For passive investors: Depreciation is non-cash, so a rental often shows a tax loss while cash-flowing — sheltering income. Rental losses are passive: they offset passive income freely, and up to $25,000/yr can offset ordinary (W-2) income if you actively participate and your MAGI is under $100k (phasing out to $0 by $150k); unused losses carry forward. On sale, claimed depreciation is recaptured at up to 25%, and gains may owe capital-gains tax (a 1031 exchange can defer both). Figures are a year-1 estimate at your 24.0% rate — not tax advice; consult a CPA.
Schools (NCES district)
- District
- Jasper 01
- NCES district ID
- 4502520
- Math proficiency
- 12% ▼ -11.00%
- Reading proficiency
- 22% ▼ -5.00%
- Median HH income
- $37,878
- Composite
- 14.23/100
- National rank
- #9450
- State rank
- #77 of 80 in SC
Livability — Hardeeville
- Score
- 65/100
- State rank
- #136
- US rank
- #13105
Category grades
Schools grade is shown separately in the Schools card above.
Census & demographics
- Census place
- Hardeeville, SC
- County
- Jasper County · 26,362 people
- City population
- 11,373
- Metro
- Hilton Head Island-Bluffton, SC
- Population (ZIP)
- 11,373
- Household income
- $72,821
- Rent vs Own
- Severe rent burden
- 337.0
Population outlook (Jasper County) Hauer SSP2
- Today (2025)
- 34,428 people
- By 2030
- 37,718 · +9.6%
- By 2040
- 44,061 · +28.0%
- By 2050
- 50,302 · +46.1%
- By 2075
- 66,869 · +94.2%
- By 2100
- 110,455 · +220.8%
Race, ethnicity, and origin ACS 2023
- Neighborhood character
- Diverse neighborhood (Simpson 0.68)
- Race & ethnicity
- White 41% Hispanic / Latino 29% Black 27% Two or more races 14%
- Hispanic origin (detail)
- Mexican 14% Puerto Rican 3%
- Common ancestry
- Iranian 2% Slovak 2% Romanian 1%
- Foreign-born
- 16% · Canada, Jamaica
- Languages at home
- 71% English-only · Spanish 26% Russian/Polish/Slavic 1%
Political lean MEDSL · Jasper
- 2024 margin
- Lean R (+9.6) · D 44.7% · R 54.3% · Other 1.0%
- 2008→2024 swing
- -32.5pp toward R · 2008: 22.9pp · 2024: -9.6pp
- All cycles
- 2024: R+9.6 2020: D+0.8 2016: D+11.9 2012: D+15.6 2008: D+22.9
Not yet ingested
- Civics
- —
Market trends
- HPI YoY
- ▲ 60.81%
- Current HPI
- 384.6071
- Rent YoY
- ▼ -1.68%
- Metro
- Hilton Head Island-Bluffton, SC
- State GDP YoY
- ▲ 4.51%
- F500 in state
- 2
Industry mix (Fortune 500 HQ in SC)
| Industry | F500 HQs | Revenue |
|---|---|---|
| Packaging | 1 | $7B |
|
||
Price history
+53.3% since first listed16 events — show timeline
- 2026-05-04 Price Changed $362,000 RSMLS
- 2026-05-04 Price Changed $362,000 LRMLS
- 2026-03-25 Price Changed $365,000 RSMLS
- 2026-03-25 Price Changed $365,000 LRMLS
- 2026-03-05 Listed $370,000 RSMLS
- 2026-03-05 Listed $370,000 LRMLS
- 2025-09-29 Price Changed $379,900 RSMLS
- 2025-09-29 Price Changed $379,900 LRMLS
- 2025-08-15 Price Changed $384,900 RSMLS
- 2025-08-15 Price Changed $384,900 LRMLS
- 2025-06-05 Price Changed $389,900 LRMLS
- 2025-06-05 Price Changed $389,900 RSMLS
- 2025-05-08 Listed $397,000 LRMLS
- 2025-05-05 Listed $397,000 RSMLS
- 2021-05-13 Sold (MLS) $236,070 RSMLS
- 2020-08-31 Listed $236,070 RSMLS
Property tax history
+76.7%/yrLatest (2025): $2,298 · +4.8% YoY. Source: county tax records.
Cash-flow waterfall
monthlySold comps — $/sqft
last 12 mo · ≤1 miLoading sold comps…