 🌊 Lakefront
17051 NE 35th Ave #307 · North Miami Beach, FL
Flood risk 10/10 · Severe
- FEMA flood zone
- AE
- Chance of flooding over 30 yrs
- 0.99%
- Est. flood insurance / yr
- $1,737 – $8,500
Fire risk 1/10 · Minimal
- Est. fire insurance / yr
- $947 – $1,759
Heat risk 10/10 · Severe
- Hot days now (above 103°F)
- 7 days/yr
- Hot days in 30 yrs
- 27 days/yr
Wind risk 10/10 · Severe
- Chance of severe wind over 30 yrs
- 99.0%
Air-quality risk 2/10 · Minimal
- Unhealthy air days now
- 1 days/yr
- Unhealthy air days in 30 yrs
- 2 days/yr
Risk factors via First Street. Map © Google.
Why this score? — see what drove the B- grade
The composite is a weighted blend of 9 inputs, each scored 0–100. Each bar is that input's sub-score; the figure is the points it added to the 100-point composite (weight × sub-score).
- Cash flow +23.8/30.0
- 1% rule +8.3/10.0
- DSCR +7.7/10.0
- ARV discount +7.5/15.0
- Appreciation +5.3/10.0
- Schools +5.0/10.0
- Livability +4.1/5.0
- Rent growth +2.7/5.0
- Condition / age +2.5/5.0
$269,900
🖨 Deal sheet 📄 Offer letter ✓ Due diligence
Listing remarks MLS
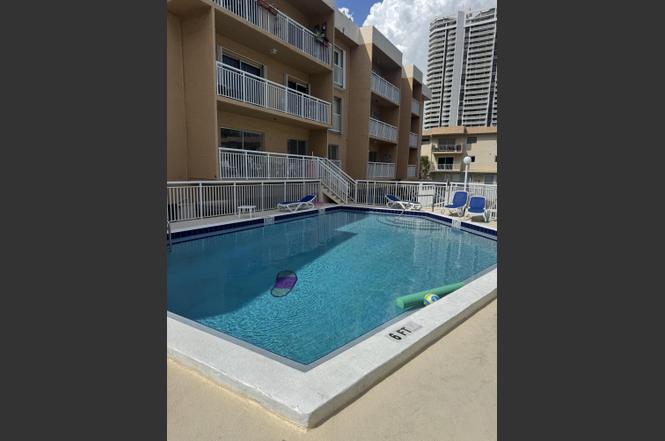
BRIGHT UNIT IN DESIRABLE EASTERN SHORES GATED COMMUNITY. WATERFRONT BUILDING WITH POOL. UNIT HAS BEEN CONVERTED INTO A ONE BEDROOM BUT IT WOULD BE VERY EASY TO PUT BACK THE PARTITION TO RECREATE THE SECOND BEDROOM. THE ENTIRE UNIT LEADS TO A BEAUTIFUL TER RACE OVERLOOKING THE CANAL ON THE OTHER SIDE OF THE STREET. BLOCKS AWAY FROM BEACHES AND SHOPPING CENTERS. GREAT SCHOOLS. SMALL PETS WELCOME. LOW MANTENANCE FEE $ 290/MONTH. THERE IS A SPECIAL ASSESSMENT OF $ 333.00/PER MONTH UNTIL APRIL 2014.
Key facts
- $580 HOA
- Garage
- Community pool
Property features AI
Finance
- HOA & community: HOA with monthly fee (includes insurance, grounds maintenance, elevator); Association amenities: elevators, pool, picnic area; Pets allowed
Exterior
- Parking: Garage (1 covered space, 1 garage space)
- Utilities: Public water; Public sewer; Three-phase electric; Cable available
- Home design: Condominium; Resale property; Faces northeast; 3-story building
- Construction: CBS construction
- Exterior features: Private pool; Not waterfront
Interior
- Kitchen: Electric range; Refrigerator
- Bedrooms: 1 bedroom on the main level
- Bathrooms: 2 full bathrooms (1 on the main level)
- Heating & cooling: Central electric heating; Central electric cooling (central air)
- Interior features: No special interior features listed; Unfurnished unit
- Laundry & utility: Washer hookup; Dryer hookup
Neighborhood map
What this means for you Summary
Snapshot
- This is a 2-bed/2.0-bath condo listed at $270k.
Deal economics
- At list price, monthly cash flow is $91 ($1k/yr) — positive.
- The deal already cash-flows at list — no discount required.
- Meets the 1% rule at list price ($4k rent vs $270k).
- Recommended offer: $254k (6.0% below list) — sets the bar for market timing.
- Cap rate 8.6% vs local median 5.2% in North Miami Beach — top-decile yield for the area; either an underpriced asset or a hidden risk that comps aren't pricing in. Stress-test before assuming the spread holds.
Location & tenants
- Location reads 82/100 on livability (#71 in FL, #1,177 nationally) — a professional / high-income tenant draw. Strengths: commute A+, housing A+, health & safety A+; Watch: employment D+, crime F.
- Market conditions: Rents flat; 1870 active listings in the ZIP; 10,051 units permitted in Miami-Dade County in 2024 (7,758 in 5+ unit buildings).
- At $3,577/mo this rent would consume 64% of the median local household income ($67k/yr) (locally 3106% of renters already pay >50% of income on rent) — very limited rent-growth headroom before tenants either downsize or default.
Forward outlook
- In year one you build about $3k of equity ($2k loan paydown + $1k appreciation (0.5% local appreciation)).
- Miami-Dade County population projected at +28% by 2050 — long-run rental-demand tailwind backs the buy-and-hold thesis.
- By year 9, paydown + projected appreciation supports a ~$33k cash-out refi (75% LTV) — recoverable capital for the next deal without selling this one.
Negotiation context
- It's been on market 90 days — a 6% lower offer ($254k) is reasonable based on typical stale-listing flexibility.
- 3 sale attempts since 13y ago; this cycle's ask has dropped $45k (14%) from the opening price — seller is motivated, your offer sets the floor, not the list.
- Current owner paid $134k; list at $270k implies a 101% gain — meaningful room to come down on a strong offer.
Risks & watch-outs
- Watch-outs: flood insurance adds $427/mo.
- Climate carrying-cost: in FEMA flood zone AE (mandatory federal flood insurance); severe wind risk, 99% chance of damaging wind over 30y; extreme-heat days projected 7→27/yr by 2055 (HVAC capex compounding) — expect insurance premiums to compound above CPI over the hold.
Questions for the listing agent
- It's been on market 90 days. Have you received any prior offers? Is the seller open to a 6% concession, seller financing, or rate buy-down credit?
- Built in 1973 — when were the roof, HVAC, electrical panel, plumbing, and water heater last replaced?
- What's the actual annual flood-insurance premium (NFIP or private), and is the property in a SFHA with mandatory coverage?
- What does the HOA fee cover, when was the last increase, and are there any pending special assessments or reserve-fund shortfalls?
- Any open or pending special assessments — roof, HVAC, plumbing, elevator, façade? What's the per-unit balance and payoff schedule, and is the seller paying it off at close or rolling it to the buyer?
- Why hasn't it sold? Are there any deal-killer items the seller is aware of (foundation, flood, title, zoning, code violations)?
- Is there a deadline driving the sale (1031 exchange, divorce, estate, relocation)? That informs how much negotiation room exists.
- Crime grade is F in this area — have there been break-ins, vandalism, or insurance claims at this property in the last 3 years? What carrier currently insures it and at what premium?
- This sits on a lake — are riparian / water-frontage rights deeded with the parcel? Any dock permits, shoreline easements, or HOA water-use restrictions?
- What's the documented flood / surge / shoreline-erosion history here (FEMA AND non-FEMA — e.g., storm surge, creek backup, septic-field saturation)?
- Any water-quality or seasonal algae-bloom issues that affect tenant satisfaction or short-term-rental demand?
- What's the average days-on-market for RENTAL listings here right now (not sales)? A rising rental-DOM trend means longer vacancies and softer asking-rent achievability than the comps imply.
- What's the recent tenant-quality profile in this submarket — average credit score on applications, eviction rate, late-payment / NSF rate, and stable-employment percentage? A property-management company in the area should have these aggregated.
- How much new apartment / multifamily construction is in the pipeline within 1–3 miles? Heavy new supply (>2% of stock underway) typically softens rents 12–24 months out; light construction supports rent growth.
Investment metrics
- 1% rule
- 1.33% ✓
- Cap rate
- 8.60%
- Cash-on-cash
- 8.22%
- DSCR
- 1.37
- GRM
- 6.3
CMA / ARV
No comps found within radius.
Projected returns pro-forma
0.53% appreciation · 0.94% rent growth · sell at horizon
- IRR
- -0.6%
- Equity multiple
- 0.97×
- Total profit
- $-2,003
- Equity at exit
- $85,556
- IRR
- 2.8%
- Equity multiple
- 1.30×
- Total profit
- $22,743
- Equity at exit
- $108,768
Cash invested: $75,572 (down + closing). Projections, not guarantees.
Landlord ↔ Tenant lean methodology
- Overall (STATE)
- 87 Strongly Landlord-Friendly
- State Florida
- 87 Strongly Landlord-Friendly · R+3
- County
- — inherits STATE
- City
- — inherits STATE
ZIP-level market 33160
- Home prices YoY
- 0.2%
- Rents YoY
- 0.9%
- Active inventory
- 1870
- Price-to-rent
- 6.3×
Monthly cashflow live
- Estimated rent
- $3,577 medium interval (Pro) →
- Mortgage (P&I)
- −$1,415
- Tax from tax record
- −$200 /mo · $2,405/yr
- Insurance
- −$112
- Flood insurance flood zone
- −$427 /mo · $5,118/yr
- HOA
- −$580
- Vacancy / Maint / Mgmt
- −$751
- Net cashflow
- $91
Break-even live
UW: 25.0% down · 7.5% · 30yr · 1.5% tax · 5.0% vac · 8.0% maint · 8.0% mgmt
Financing live
Cash to close
- Down payment
- $67,475
- Closing costs
- $8,097
- Reserves months
- —
- Total cash needed
- —
Loan-product check · same deal, 3 products live
Conventional
25% down · 7.5% · 30yr
- Down + closing
- —
- Monthly P&I
- —
- Monthly cashflow
- —
- DSCR
- —
- Eligible?
- —
Personal DTI + credit; lowest rate.
DSCR
20% down · 8.5% · 30yr
- Down + closing
- —
- Monthly P&I
- —
- Monthly cashflow
- —
- DSCR
- —
- Eligible?
- —
No personal income docs; deal must DSCR.
Hard money
10% down · 12.0% · 12mo
- Down + closing
- —
- Monthly P&I
- —
- Monthly cashflow
- —
- DSCR
- —
- Eligible?
- —
Short-term bridge; refi at stabilization.
HOA detail condo
- Monthly dues
- $580 · $6,960/yr
- Likely covers
- waterpoolsecurity
- ⚠ Special-assessment mentions
-
…AWAY FROM BEACHES AND SHOPPING CENTERS. GREAT SCHOOLS. SMALL PETS WELCOME. LOW MANTENANCE FEE $ 290/MONTH. THERE IS A SPECIAL ASSESSMENT OF $ 333.00/PER MONTH UNTIL APRIL 2014.
Listing history 24 events
-
2026-06-18days on market $269,900 Active 90 DOM
-
2026-06-17days on market $269,900 Active 89 DOM
-
2026-06-16days on market $269,900 Active 88 DOM
-
2026-06-15days on market $269,900 Active 87 DOM
-
2026-06-13days on market $269,900 Active 85 DOM
-
2026-06-09days on market $269,900 Active 81 DOM
-
2026-06-08days on market $269,900 Active 80 DOM
-
2026-06-07days on market $269,900 Active 79 DOM
-
2026-06-04days on market $269,900 Active 76 DOM
-
2026-06-03days on market $269,900 Active 75 DOM
-
2026-06-02days on market $269,900 Active 74 DOM
-
2026-06-01days on market $269,900 Active 73 DOM
-
2026-05-31days on market $269,900 Active 72 DOM
-
2026-04-30price $269,900
-
2026-04-30status Active
-
2026-04-24historical
-
2026-03-14$314,999 Active
-
2026-03-02historical $314,999
-
2013-11-22soldstatus $134,500 Sold 499-char remark
Show marketing remark (499 chars)
BRIGHT UNIT IN DESIRABLE EASTERN SHORES GATED COMMUNITY. WATERFRONT BUILDING WITH POOL. UNIT HAS BEEN CONVERTED INTO A ONE BEDROOM BUT IT WOULD BE VERY EASY TO PUT BACK THE PARTITION TO RECREATE THE SECOND BEDROOM. THE ENTIRE UNIT LEADS TO A BEAUTIFUL TER RACE OVERLOOKING THE CANAL ON THE OTHER SIDE OF THE STREET. BLOCKS AWAY FROM BEACHES AND SHOPPING CENTERS. GREAT SCHOOLS. SMALL PETS WELCOME. LOW MANTENANCE FEE $ 290/MONTH. THERE IS A SPECIAL ASSESSMENT OF $ 333.00/PER MONTH UNTIL APRIL 2014.
-
2013-11-22soldstatus $134,500
Show marketing remark (499 chars)
BRIGHT UNIT IN DESIRABLE EASTERN SHORES GATED COMMUNITY. WATERFRONT BUILDING WITH POOL. UNIT HAS BEEN CONVERTED INTO A ONE BEDROOM BUT IT WOULD BE VERY EASY TO PUT BACK THE PARTITION TO RECREATE THE SECOND BEDROOM. THE ENTIRE UNIT LEADS TO A BEAUTIFUL TER RACE OVERLOOKING THE CANAL ON THE OTHER SIDE OF THE STREET. BLOCKS AWAY FROM BEACHES AND SHOPPING CENTERS. GREAT SCHOOLS. SMALL PETS WELCOME. LOW MANTENANCE FEE $ 290/MONTH. THERE IS A SPECIAL ASSESSMENT OF $ 333.00/PER MONTH UNTIL APRIL 2014.
-
2013-10-29status Pending 499-char remark
Show marketing remark (499 chars)
BRIGHT UNIT IN DESIRABLE EASTERN SHORES GATED COMMUNITY. WATERFRONT BUILDING WITH POOL. UNIT HAS BEEN CONVERTED INTO A ONE BEDROOM BUT IT WOULD BE VERY EASY TO PUT BACK THE PARTITION TO RECREATE THE SECOND BEDROOM. THE ENTIRE UNIT LEADS TO A BEAUTIFUL TER RACE OVERLOOKING THE CANAL ON THE OTHER SIDE OF THE STREET. BLOCKS AWAY FROM BEACHES AND SHOPPING CENTERS. GREAT SCHOOLS. SMALL PETS WELCOME. LOW MANTENANCE FEE $ 290/MONTH. THERE IS A SPECIAL ASSESSMENT OF $ 333.00/PER MONTH UNTIL APRIL 2014.
-
2013-10-06$139,000 Active 499-char remark
Show marketing remark (499 chars)
BRIGHT UNIT IN DESIRABLE EASTERN SHORES GATED COMMUNITY. WATERFRONT BUILDING WITH POOL. UNIT HAS BEEN CONVERTED INTO A ONE BEDROOM BUT IT WOULD BE VERY EASY TO PUT BACK THE PARTITION TO RECREATE THE SECOND BEDROOM. THE ENTIRE UNIT LEADS TO A BEAUTIFUL TER RACE OVERLOOKING THE CANAL ON THE OTHER SIDE OF THE STREET. BLOCKS AWAY FROM BEACHES AND SHOPPING CENTERS. GREAT SCHOOLS. SMALL PETS WELCOME. LOW MANTENANCE FEE $ 290/MONTH. THERE IS A SPECIAL ASSESSMENT OF $ 333.00/PER MONTH UNTIL APRIL 2014.
-
1986-11-01soldstatus $34,800
-
1979-07-01soldstatus $39,500
ⓘ Source: listings_history table (triggers on properties + properties_extension) + one-shot
backfill from property_details.listing_events for pre-trigger history.
Tax reassessment forecast FL · Resets to sale price
- Current annual tax
- $2,405 · $200/mo
- Projected year-2 tax
- $2,405 · $200/mo
- Expected delta
- $0/yr ($0/mo · 0.0%)
ⓘ Screening estimate from a state-policy table — verify with the county assessor before closing.
Climate risk First Street
- Flood 10/10 Extreme FEMA zone AE · 99% chance over 30 yrs
- Wildfire 1/10 Low
- Heat 10/10 Extreme 7 d/yr ≥103°F today · 27 d/yr by 30 yrs out
- Wind 10/10 Extreme 99% chance of damaging wind over 30 yrs
- Air quality 2/10 Low 1 unhealthy d/yr today · 2 by 30 yrs out
Nearby sold comps map
Loading sold comps map…
Walkable amenities ~0.75 mi
Loading nearby amenities…
Taxation est. · year 1
- Rental income
- $42,929
- − Mortgage interest
- −$15,119
- − Property taxes
- −$2,405
- − Insurance
- −$6,468
- − Repairs & maintenance
- −$3,434
- − Management
- −$3,434
- − HOA
- −$6,960
- − Depreciation
- −$7,852
- Taxable loss
- −$2,743
- Est. tax savings @ 24.0%
- +$658
- After-tax cash flow
- $1,754/yr
For passive investors: Depreciation is non-cash, so a rental often shows a tax loss while cash-flowing — sheltering income. Rental losses are passive: they offset passive income freely, and up to $25,000/yr can offset ordinary (W-2) income if you actively participate and your MAGI is under $100k (phasing out to $0 by $150k); unused losses carry forward. On sale, claimed depreciation is recaptured at up to 25%, and gains may owe capital-gains tax (a 1031 exchange can defer both). Figures are a year-1 estimate at your 24.0% rate — not tax advice; consult a CPA.
Schools (NCES district)
No district data.
Livability — North Miami Beach
- Score
- 82/100
- State rank
- #71
- US rank
- #1177
Category grades
Schools grade is shown separately in the Schools card above.
Census & demographics
- Census place
- North Miami Beach, FL
- County
- Miami-Dade County · 2,697,751 people
- City population
- 90,324
- Metro
- Miami-Fort Lauderdale-Pompano Beach, FL
- Population (ZIP)
- 43,718
- Household income
- $67,040
- Rent vs Own
- Severe rent burden
- 3106.0
Population outlook (Miami-Dade County) Hauer SSP2
- Today (2025)
- 3,126,439 people
- By 2030
- 3,325,765 · +6.4%
- By 2040
- 3,697,561 · +18.3%
- By 2050
- 4,012,134 · +28.3%
- By 2075
- 4,605,612 · +47.3%
- By 2100
- 4,866,598 · +55.7%
Race, ethnicity, and origin ACS 2023
- Neighborhood character
- Diverse neighborhood (Simpson 0.59)
- Race & ethnicity
- Hispanic / Latino 46% White 44% Two or more races 27% Black 4% Asian 2%
- Hispanic origin (detail)
- Mexican 1% Puerto Rican 3% Cuban 8% Dominican 1% Salvadoran 4%
- Common ancestry
- Scotch-Irish 8% Hispanic 3% Subsaharan African 3%
- Foreign-born
- 61% · Canada, Jamaica, Dominican Republic
- Languages at home
- 29% English-only · Spanish 45% Russian/Polish/Slavic 12% Other Indo-European 5%
Political lean MEDSL · Miami-Dade
- 2024 margin
- R (+11.4) · D 43.9% · R 55.4%
- 2008→2024 swing
- -27.6pp toward R · 2008: 16.1pp · 2024: -11.4pp
- All cycles
- 2024: R+11.4 2020: D+7.3 2016: D+29.6 2012: D+23.7 2008: D+16.1
Not yet ingested
- Civics
- —
Market trends
- HPI YoY
- ▲ 0.53%
- Current HPI
- 284.9293
- Rent YoY
- ▲ 0.94%
- Metro
- Miami-Fort Lauderdale-Pompano Beach, FL
- State GDP YoY
- ▲ 3.28%
- F500 in state
- 36
Industry mix (Fortune 500 HQ in FL)
| Industry | F500 HQs | Revenue |
|---|---|---|
| Industrial Technology | 2 | $29B |
|
||
| Insurance | 2 | $17B |
|
||
| Retail | 1 | $60B |
|
||
| Technology Distribution | 1 | $58B |
|
||
| Homebuilding | 1 | $35B |
|
||
| Technology Manufacturing | 1 | $35B |
|
||
Price history
+583.3% since first listed11 events — show timeline
- 2026-04-30 Price Changed $269,900 Beaches MLS
- 2026-04-30 Relisted — Beaches MLS
- 2026-04-24 Listing Removed — Beaches MLS
- 2026-03-14 Listed $314,999 Beaches MLS
- 2026-03-02 Coming Soon $314,999 Beaches MLS
- 2013-11-22 Sold (MLS) $134,500 MARMLS
- 2013-11-22 Sold (Public Records) $134,500 Public Records
- 2013-10-29 Pending — MARMLS
- 2013-10-06 Listed $139,000 MARMLS
- 1986-11-01 Sold (Public Records) $34,800 Public Records
- 1979-07-01 Sold (Public Records) $39,500 Public Records
Property tax history
+1.2%/yrLatest (2025): $2,405 · +6.0% YoY. Source: county tax records.
Cash-flow waterfall
monthlySold comps — $/sqft
last 12 mo · ≤1 miLoading sold comps…