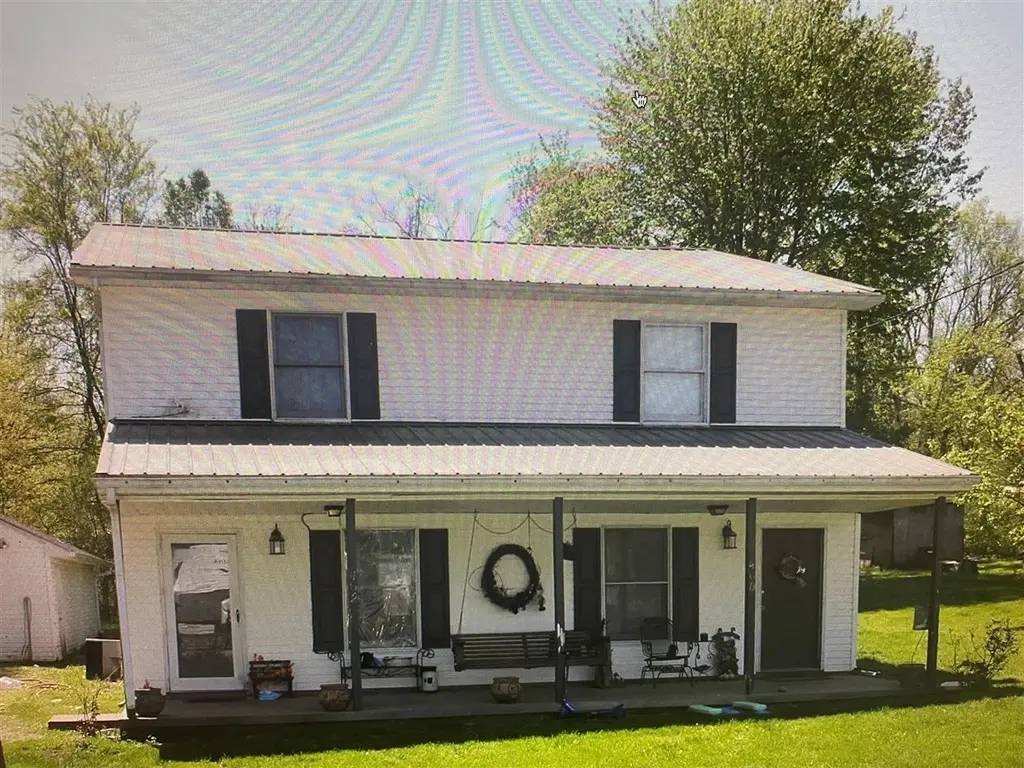
460 Oak St · Lewisburg, KY
Flood risk 1/10 · Minimal
- FEMA flood zone
- X (unshaded)
- Chance of flooding over 30 yrs
- 0.0%
- Est. flood insurance / yr
- $507 – $1,088
Fire risk 4/10 · Minor
- Est. fire insurance / yr
- $839 – $1,559
Heat risk 5/10 · Moderate
- Hot days now (above 108°F)
- 7 days/yr
- Hot days in 30 yrs
- 19 days/yr
Wind risk 4/10 · Minor
- Chance of severe wind over 30 yrs
- 9.0%
Air-quality risk 2/10 · Minimal
- Unhealthy air days now
- 0 days/yr
- Unhealthy air days in 30 yrs
- 1 days/yr
Risk factors via First Street. Map © Google.
Why this score? — see what drove the D grade
The composite is a weighted blend of 9 inputs, each scored 0–100. Each bar is that input's sub-score; the figure is the points it added to the 100-point composite (weight × sub-score).
- Cash flow +10.6/30.0
- ARV discount +7.5/15.0
- Appreciation +5.0/10.0
- Schools +3.3/10.0
- Livability +3.2/5.0
- DSCR +3.0/10.0
- Rent growth +2.5/5.0
- Condition / age +2.5/5.0
- 1% rule +2.4/10.0
$175,000
🖨 Deal sheet 📄 Offer letter ✓ Due diligence
Listing remarks MLS
Great rental investment! Duplex with both sides being 2 bedroom 1.5 bath. Both sides occupied and rent current, covered front and back porch. Garage outside included for tenants to have extra storage.
Key facts
- Extra storage
- Duplex
- 0.32 acre lot
Tags
Neighborhood map
What this means for you Summary
Snapshot
- This is a 4-bed/3.0-bath other listed at $175k.
Deal economics
- At list price, monthly cash flow is $-88 ($-1k/yr) — negative.
- To cash-flow at today's rent, offer at most $160k (8.8% below list).
- To meet the 1% rule (rent ≥ 1% of price), the offer needs to be $129k (26.2% below list).
- Recommended offer: $129k (26.2% below list) — sets the bar for 1% rule.
Location & tenants
- Location reads 64/100 on livability (#295 in KY) — a middle-class / working-renter tenant base. Strengths: crime A+, cost of living A+, housing A+; Watch: schools D, amenities F, commute F.
- Logan County (rural): math 35% / reading 44% proficiency, ranked #32 of 165 in KY (top 19%) — families likely to look elsewhere, expect single-tenant / working-renter base with shorter leases.
- Market conditions: 62 active listings in the ZIP; 30 units permitted in Logan County in 2024 (0 in 5+ unit buildings).
Forward outlook
- In year one you build about $1k of equity ($1k loan paydown + $67 appreciation (0.0% local appreciation)).
- Logan County population projected at -13% by 2050 — secular population decline; favor cash flow + early exit over multi-decade hold.
Negotiation context
- It's been on market 524 days — a 12% lower offer ($154k) is reasonable based on typical stale-listing flexibility.
- 8 sale attempts since 11y ago; this cycle's ask is 21112% above the opening price — seller raised mid-cycle; expect resistance to lowballs.
- Current owner paid $135k; 30% above their basis — modest negotiation headroom, anchor on the comps not their cost.
Risks & watch-outs
- Climate carrying-cost: extreme-heat days projected 7→19/yr by 2055 (HVAC capex compounding) — expect insurance premiums to compound above CPI over the hold.
Questions for the listing agent
- What do current leases actually rent for vs. the listed asking? Can we see a recent rent roll and the last 12 months of T-12 income?
- It's been on market 524 days. Have you received any prior offers? Is the seller open to a 26% concession, seller financing, or rate buy-down credit?
- Why hasn't it sold? Are there any deal-killer items the seller is aware of (foundation, flood, title, zoning, code violations)?
- Is there a deadline driving the sale (1031 exchange, divorce, estate, relocation)? That informs how much negotiation room exists.
- Schools are D-rated, which usually means shorter tenancies and higher turnover. Who's the typical renter profile here, and what's been the actual vacancy rate?
- The area grade is low — what's the realistic commute time and amenity access for the typical tenant pool here? Any planned neighborhood developments (good or bad) we should know about?
- What's the average days-on-market for RENTAL listings here right now (not sales)? A rising rental-DOM trend means longer vacancies and softer asking-rent achievability than the comps imply.
- What's the recent tenant-quality profile in this submarket — average credit score on applications, eviction rate, late-payment / NSF rate, and stable-employment percentage? A property-management company in the area should have these aggregated.
- How much new for-sale + rental construction is in the pipeline within 1–3 miles? Heavy new supply typically softens prices + rents 12–24 months out; constrained supply supports both.
Investment metrics
- 1% rule
- 0.74% ✗
- Cap rate
- 5.69%
- Cash-on-cash
- -2.14%
- DSCR
- 0.90
- GRM
- 11.3
CMA / ARV
No comps found within radius.
Projected returns pro-forma
0.04% appreciation · 3.0% rent growth · sell at horizon
- IRR
- -4.5%
- Equity multiple
- 0.79×
- Total profit
- $-10,425
- Equity at exit
- $51,150
- IRR
- 1.3%
- Equity multiple
- 1.14×
- Total profit
- $6,881
- Equity at exit
- $61,753
Cash invested: $49,000 (down + closing). Projections, not guarantees.
Landlord ↔ Tenant lean methodology
- Overall (STATE)
- 83 Strongly Landlord-Friendly
- State Kentucky
- 83 Strongly Landlord-Friendly · R+16
- County
- — inherits STATE
- City
- — inherits STATE
ZIP-level market 42256
- Home prices YoY
- 0.0%
- Active inventory
- 62
- Price-to-rent
- 11.3×
Monthly cashflow live
- Estimated rent
- $1,292 medium interval (Pro) →
- Mortgage (P&I)
- −$918
- Tax from tax record
- −$117 /mo · $1,409/yr
- Insurance
- −$73
- HOA
- −$0
- Vacancy / Maint / Mgmt
- −$271
- Net cashflow
- $-88
Break-even live
UW: 25.0% down · 7.5% · 30yr · 1.5% tax · 5.0% vac · 8.0% maint · 8.0% mgmt
Financing live
Cash to close
- Down payment
- $43,750
- Closing costs
- $5,250
- Reserves months
- —
- Total cash needed
- —
Loan-product check · same deal, 3 products live
Conventional
25% down · 7.5% · 30yr
- Down + closing
- —
- Monthly P&I
- —
- Monthly cashflow
- —
- DSCR
- —
- Eligible?
- —
Personal DTI + credit; lowest rate.
DSCR
20% down · 8.5% · 30yr
- Down + closing
- —
- Monthly P&I
- —
- Monthly cashflow
- —
- DSCR
- —
- Eligible?
- —
No personal income docs; deal must DSCR.
Hard money
10% down · 12.0% · 12mo
- Down + closing
- —
- Monthly P&I
- —
- Monthly cashflow
- —
- DSCR
- —
- Eligible?
- —
Short-term bridge; refi at stabilization.
Listing history 29 events
-
2026-06-18days on market $175,000 Active 524 DOM
-
2026-06-17days on market $175,000 Active 523 DOM
-
2026-06-16days on market $175,000 Active 522 DOM
-
2026-06-15days on market $175,000 Active 521 DOM
-
2026-06-14days on market $175,000 Active 519 DOM
-
2026-06-13days on market $175,000 Active 518 DOM
-
2026-06-10days on market $175,000 Active 516 DOM
-
2026-06-09days on market $175,000 Active 515 DOM
-
2026-06-08days on market $175,000 Active 514 DOM
-
2026-06-07days on market $175,000 Active 513 DOM
-
2026-06-03days on market $175,000 Active 509 DOM
-
2026-06-02days on market $175,000 Active 508 DOM
-
2026-06-01days on market $175,000 Active 507 DOM
-
2026-05-31days on market $175,000 Active 506 DOM
-
2026-05-31days on market $175,000 Active 505 DOM
-
2026-04-02status Active 200-char remark
Show marketing remark (200 chars)
Great rental investment! Duplex with both sides being 2 bedroom 1.5 bath. Both sides occupied and rent current, covered front and back porch. Garage outside included for tenants to have extra storage.
-
2026-01-07status Active 200-char remark
Show marketing remark (200 chars)
Great rental investment! Duplex with both sides being 2 bedroom 1.5 bath. Both sides occupied and rent current, covered front and back porch. Garage outside included for tenants to have extra storage.
-
2025-10-11historical $800
-
2025-10-07price $800
-
2025-09-11$825
-
2025-01-09$175,000 Active 200-char remark
Show marketing remark (200 chars)
Great rental investment! Duplex with both sides being 2 bedroom 1.5 bath. Both sides occupied and rent current, covered front and back porch. Garage outside included for tenants to have extra storage.
-
2024-08-24historical $750
-
2024-08-08$750
-
2023-08-10$199,900 Active
-
2023-08-06historical
-
2023-04-12$199,900 Active
-
2021-10-01soldstatus $135,000
-
2021-08-04soldstatus $96,000
-
2015-04-15$89,900
ⓘ Source: listings_history table (triggers on properties + properties_extension) + one-shot
backfill from property_details.listing_events for pre-trigger history.
Tax reassessment forecast KY · Resets to sale price
- Current annual tax
- $1,409 · $117/mo
- Projected year-2 tax
- $1,505 · $125/mo
- Expected delta
- +$96/yr (+$8/mo · 6.8%)
ⓘ Screening estimate from a state-policy table — verify with the county assessor before closing.
Climate risk First Street
- Flood 1/10 Low FEMA zone X (unshaded) · 0% chance over 30 yrs
- Wildfire 4/10 Moderate
- Heat 5/10 Major 7 d/yr ≥108°F today · 19 d/yr by 30 yrs out
- Wind 4/10 Moderate 9% chance of damaging wind over 30 yrs
- Air quality 2/10 Low 0 unhealthy d/yr today · 1 by 30 yrs out
Nearby sold comps map
Loading sold comps map…
Walkable amenities ~0.75 mi
Loading nearby amenities…
Taxation est. · year 1
- Rental income
- $15,501
- − Mortgage interest
- −$9,803
- − Property taxes
- −$1,409
- − Insurance
- −$875
- − Repairs & maintenance
- −$1,240
- − Management
- −$1,240
- − Depreciation
- −$5,091
- Taxable loss
- −$4,157
- Est. tax savings @ 24.0%
- +$998
- After-tax cash flow
- $-53/yr
For passive investors: Depreciation is non-cash, so a rental often shows a tax loss while cash-flowing — sheltering income. Rental losses are passive: they offset passive income freely, and up to $25,000/yr can offset ordinary (W-2) income if you actively participate and your MAGI is under $100k (phasing out to $0 by $150k); unused losses carry forward. On sale, claimed depreciation is recaptured at up to 25%, and gains may owe capital-gains tax (a 1031 exchange can defer both). Figures are a year-1 estimate at your 24.0% rate — not tax advice; consult a CPA.
Schools (NCES district)
- District
- Logan County
- NCES district ID
- 2103540
- Math proficiency
- 35% ▼ -17.00%
- Reading proficiency
- 44% ▼ -14.00%
- Median HH income
- $42,577
- Composite
- 33.34/100
- National rank
- #5492
- State rank
- #32 of 165 in KY
Livability — Lewisburg
- Score
- 64/100
- State rank
- #295
- US rank
- #14165
Category grades
Schools grade is shown separately in the Schools card above.
Census & demographics
- Census place
- Lewisburg, KY
- Population (ZIP)
- 5,052
Population outlook (Logan County) Hauer SSP2
- Today (2025)
- 26,133 people
- By 2030
- 25,572 · -2.1%
- By 2040
- 24,247 · -7.2%
- By 2050
- 22,849 · -12.6%
- By 2075
- 19,587 · -25.0%
- By 2100
- 15,927 · -39.1%
Race, ethnicity, and origin ACS 2023
- Neighborhood character
- Predominantly White (95%)
- Race & ethnicity
- White 95% Hispanic / Latino 3% Two or more races 2%
- Common ancestry
- Italian 2% Slovak 1% Romanian 1%
- Foreign-born
- 0%
- Languages at home
- 96% English-only · German/W. Germanic 2% Russian/Polish/Slavic 1% Other Indo-European 1%
Political lean MEDSL · Logan
- 2024 margin
- Solid R (+55.1) · D 21.9% · R 76.9% · Other 1.2%
- 2008→2024 swing
- -26.5pp toward R · 2008: -28.6pp · 2024: -55.1pp
- All cycles
- 2024: R+55.1 2020: R+48.4 2016: R+46.1 2012: R+32.6 2008: R+28.6
Not yet ingested
- Civics
- —
Market trends
- HPI YoY
- ▬ 0.04%
- Current HPI
- 265.4274
- Rent YoY
- —
- Metro
- —
- State GDP YoY
- ▲ 1.81%
- F500 in state
- 4
Industry mix (Fortune 500 HQ in KY)
| Industry | F500 HQs | Revenue |
|---|---|---|
| Healthcare | 1 | $118B |
|
||
| Food / Beverage | 1 | $7B |
|
||
Price history
+94.7% since first listed14 events — show timeline
- 2026-04-02 Relisted — RASKMLS
- 2026-01-07 Relisted — RASKMLS
- 2025-10-11 Rental Removed $800 APPFOLIO
- 2025-10-07 Price Changed $800 APPFOLIO
- 2025-09-11 Listed for Rent $825 APPFOLIO
- 2025-01-09 Listed $175,000 RASKMLS
- 2024-08-24 Rental Removed $750 APPFOLIO
- 2024-08-08 Listed for Rent $750 APPFOLIO
- 2023-08-10 Listed $199,900 RASKMLS
- 2023-08-06 Delisted — RASKMLS
- 2023-04-12 Listed $199,900 RASKMLS
- 2021-10-01 Sold (Public Records) $135,000 Public Records
- 2021-08-04 Sold (Public Records) $96,000 Public Records
- 2015-04-15 Listed $89,900 RASKMLS
Property tax history
+5.6%/yrLatest (2025): $1,409 · -0.8% YoY. Source: county tax records.
Cash-flow waterfall
monthlySold comps — $/sqft
last 12 mo · ≤1 miLoading sold comps…