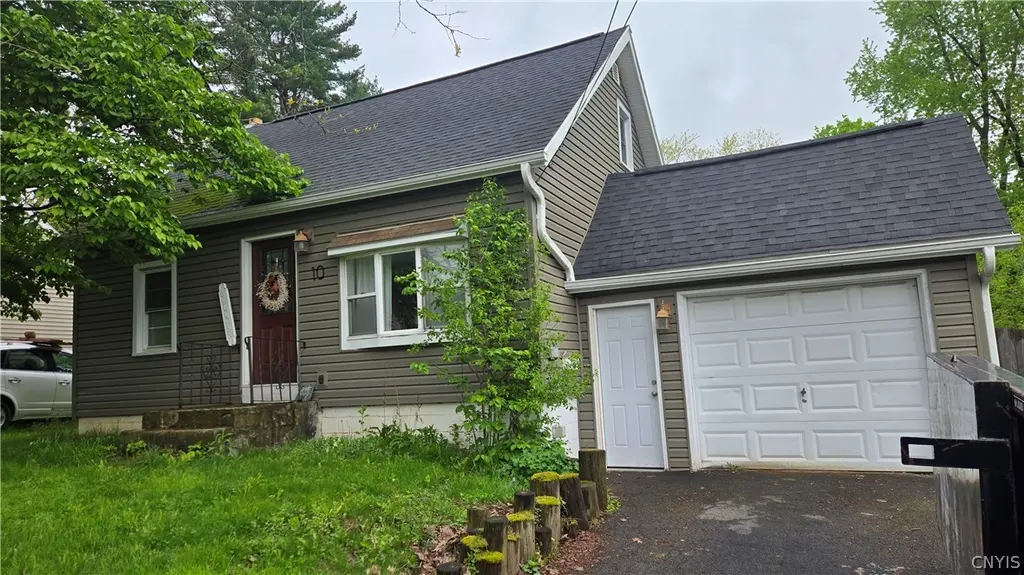
10 Tibbitts Rd · Washington Mills, NY
Flood risk 1/10 · Minimal
- FEMA flood zone
- X (unshaded)
- Chance of flooding over 30 yrs
- 0.0%
- Est. flood insurance / yr
- $473 – $860
Fire risk 1/10 · Minimal
- Est. fire insurance / yr
- $691 – $1,283
Heat risk 3/10 · Minor
- Hot days now (above 94°F)
- 7 days/yr
- Hot days in 30 yrs
- 17 days/yr
Wind risk 1/10 · Minimal
- Chance of severe wind over 30 yrs
- 1.0%
Air-quality risk 2/10 · Minimal
- Unhealthy air days now
- 0 days/yr
- Unhealthy air days in 30 yrs
- 2 days/yr
Risk factors via First Street. Map © Google.
Why this score? — see what drove the C grade
The composite is a weighted blend of 9 inputs, each scored 0–100. Each bar is that input's sub-score; the figure is the points it added to the 100-point composite (weight × sub-score).
- Cash flow +19.3/30.0
- ARV discount +12.9/15.0
- DSCR +6.1/10.0
- Schools +6.1/10.0
- 1% rule +5.0/10.0
- Livability +3.0/5.0
- Rent growth +2.5/5.0
- Condition / age +2.5/5.0
- Appreciation +0.0/10.0
$220,000
🖨 Deal sheet (PDF) 📄 Offer letter ✓ Due diligence
Listing remarks MLS
Why rent when you can own a home in desirable New Hartford? Cute cape cod with updated kitchen, living & dining rooms, 1st floor bedroom plus 2 more upstairs, updated bath. Sliders to deck overlook fenced in yard. Newer roof, siding, and windows. Easy access to shopping, highways.
Key facts
- 8,010 sq ft lot
- Garage
- Built 1950
Neighborhood map
What this means for you Summary
Snapshot
- This is a 3-bed/1.0-bath single-family listed at $220k.
Deal economics
- At list price, monthly cash flow is $243 ($3k/yr) — positive.
- The deal already cash-flows at list — no discount required.
- Meets the 1% rule at list price ($2k rent vs $220k).
Location & tenants
- Location reads 60/100 on livability (#952 in NY) — a middle-class / working-renter tenant base. Strengths: housing A+, health & safety A+, crime A; Watch: schools F, amenities F, commute F.
- New Hartford Central School District (suburban): math 65% / reading 76% proficiency, ranked #128 of 590 in NY (top 22%) — strong family-tenant draw, lease renewals of 3-5y typical; only 9% free/reduced lunch — higher-income household profile.
- Market conditions: 100 active listings in the ZIP; solid renter incomes; 204 units permitted in Oneida County in 2024 (68 in 5+ unit buildings).
Forward outlook
- Local home prices are declining (-3.0%/yr); year-one equity from $2k of loan paydown is wiped out by about $7k of value loss. Plan a longer hold.
- Oneida County population projected at -12% by 2050 — secular population decline; favor cash flow + early exit over multi-decade hold.
Negotiation context
- Only 0 days on market — expect competitive offers; lowballing is unlikely to land.
- 3 sale attempts since 11y ago with the ask held roughly flat each time — persistent listings suggest the price (not the market) is what's stuck; bring a comps-based counter.
- Current owner paid $92k; list at $220k implies a 139% gain — meaningful room to come down on a strong offer.
Risks & watch-outs
- Watch-outs: built in 1950 — expect roof / HVAC / electrical / plumbing capex.
Questions for the listing agent
- Built in 1950 — when were the roof, HVAC, electrical panel, plumbing, and water heater last replaced?
- Is there a deadline driving the sale (1031 exchange, divorce, estate, relocation)? That informs how much negotiation room exists.
- Schools are F-rated, which usually means shorter tenancies and higher turnover. Who's the typical renter profile here, and what's been the actual vacancy rate?
- What's the average days-on-market for RENTAL listings here right now (not sales)? A rising rental-DOM trend means longer vacancies and softer asking-rent achievability than the comps imply.
- What's the recent tenant-quality profile in this submarket — average credit score on applications, eviction rate, late-payment / NSF rate, and stable-employment percentage? A property-management company in the area should have these aggregated.
- How much new for-sale + rental construction is in the pipeline within 1–3 miles? Heavy new supply typically softens prices + rents 12–24 months out; constrained supply supports both.
Investment metrics
- 1% rule
- 1.00% ✓
- Cap rate
- 7.62%
- Cash-on-cash
- 4.74%
- DSCR
- 1.21
- GRM
- 8.3
CMA / ARV
- ARV (on-the-fly)
- $249,964
- Comps found
- 4
Show comp detail 4 sales within ~0.75 mi
| Address | Dist | Beds/Ba | Sqft | Sold | Price | $/sf | Match |
|---|---|---|---|---|---|---|---|
| 12 Tibbitts Rd | 0.01mi | 3/1.0 | 1,012 (0%) | 22mo | $249,900 | $247 | 81 |
| 127 1/2 Oxford Rd | 0.58mi | 3/1.0 | 1,008 (-0%) | 11mo | $230,000 | $228 | 63 |
| 20 Janet Ter | 0.28mi | 3/1.5 | 1,161 (+15%) | 13mo | $259,000 | $223 | 50 |
| 138 Oxford Rd | 0.32mi | 2/1.5 (-1) | 925 (-9%) | 20mo | $247,200 | $267 | 46 |
Match score weights: distance 35% · size 25% · config 20% · recency 20%. Top-matched comps best support the ARV.
Projected returns pro-forma
-3.0% appreciation · 3.0% rent growth · sell at horizon
- IRR
- -8.9%
- Equity multiple
- 0.67×
- Total profit
- $-20,149
- Equity at exit
- $32,803
- IRR
- 0.6%
- Equity multiple
- 1.04×
- Total profit
- $2,465
- Equity at exit
- $19,022
Cash invested: $61,600 (down + closing). Projections, not guarantees.
Landlord ↔ Tenant lean methodology
- Overall (STATE)
- 15 Strongly Tenant-Friendly
- State New York
- 15 Strongly Tenant-Friendly · D+10
- County
- — inherits STATE
- City
- — inherits STATE
ZIP-level market 13413
- Active inventory
- 100
- Price-to-rent
- 8.3×
Monthly cashflow live
- Estimated rent
- $2,202 medium interval (Pro) →
- Mortgage (P&I)
- −$1,154
- Tax from tax record
- −$251 /mo · $3,010/yr
- Insurance
- −$92
- HOA
- −$0
- Vacancy / Maint / Mgmt
- −$462
- Net cashflow
- $243
Break-even live
Sensitivity live
| Price | -10% $368 | -5% $305 | +0% $243 | +5% $181 | +10% $119 |
|---|---|---|---|---|---|
| Rent | -10% $69 | -5% $156 | +0% $243 | +5% $330 | +10% $417 |
| Rate | -1.0pp $354 | -0.5pp $299 | base $243 | +0.5pp $186 | +1.0pp $128 |
UW: 25.0% down · 7.5% · 30yr · 1.5% tax · 5.0% vac · 8.0% maint · 8.0% mgmt
Financing live
Cash to close
- Down payment
- $55,000
- Closing costs
- $6,600
- Reserves months
- —
- Total cash needed
- —
Loan-product check · same deal, 3 products live
Conventional
25% down · 7.5% · 30yr
- Down + closing
- —
- Monthly P&I
- —
- Monthly cashflow
- —
- DSCR
- —
- Eligible?
- —
Personal DTI + credit; lowest rate.
DSCR
20% down · 8.5% · 30yr
- Down + closing
- —
- Monthly P&I
- —
- Monthly cashflow
- —
- DSCR
- —
- Eligible?
- —
No personal income docs; deal must DSCR.
Hard money
10% down · 12.0% · 12mo
- Down + closing
- —
- Monthly P&I
- —
- Monthly cashflow
- —
- DSCR
- —
- Eligible?
- —
Short-term bridge; refi at stabilization.
Listing history 7 events
-
2026-05-14$220,000
-
2026-05-14historical
-
2016-04-14soldstatus $92,000
-
2016-04-12soldstatus $92,000
-
2016-04-12$99,000
-
2016-04-11soldstatus $92,000 287-char remark
Show marketing remark (287 chars)
Why rent when you can own a home in desirable New Hartford? Cute cape cod with updated kitchen, living & dining rooms, 1st floor bedroom plus 2 more upstairs, updated bath. Sliders to deck overlook fenced in yard. Newer roof, siding, and windows. Easy access to shopping, highways.
-
2015-11-30$99,000 287-char remark
Show marketing remark (287 chars)
Why rent when you can own a home in desirable New Hartford? Cute cape cod with updated kitchen, living & dining rooms, 1st floor bedroom plus 2 more upstairs, updated bath. Sliders to deck overlook fenced in yard. Newer roof, siding, and windows. Easy access to shopping, highways.
ⓘ Source: listings_history table (triggers on properties + properties_extension) + one-shot
backfill from property_details.listing_events for pre-trigger history.
Tax reassessment forecast NY · Partial reset (capped growth)
- Current annual tax
- $3,010 · $251/mo
- Projected year-2 tax
- $3,364 · $280/mo
- Expected delta
- +$354/yr (+$30/mo · 11.8%)
ⓘ Screening estimate from a state-policy table — verify with the county assessor before closing.
Climate risk First Street
- Flood 1/10 Low FEMA zone X (unshaded) · 0% chance over 30 yrs
- Wildfire 1/10 Low
- Heat 3/10 Moderate 7 d/yr ≥94°F today · 17 d/yr by 30 yrs out
- Wind 1/10 Low 100% chance of damaging wind over 30 yrs
- Air quality 2/10 Low 0 unhealthy d/yr today · 2 by 30 yrs out
Nearby sold comps map
Loading sold comps map…
Walkable amenities ~0.75 mi
Loading nearby amenities…
Taxation est. · year 1
- Rental income
- $26,419
- − Mortgage interest
- −$12,323
- − Property taxes
- −$3,010
- − Insurance
- −$1,100
- − Repairs & maintenance
- −$2,114
- − Management
- −$2,114
- − Depreciation
- −$6,400
- Taxable loss
- −$641
- Est. tax savings @ 24.0%
- +$154
- After-tax cash flow
- $3,071/yr
For passive investors: Depreciation is non-cash, so a rental often shows a tax loss while cash-flowing — sheltering income. Rental losses are passive: they offset passive income freely, and up to $25,000/yr can offset ordinary (W-2) income if you actively participate and your MAGI is under $100k (phasing out to $0 by $150k); unused losses carry forward. On sale, claimed depreciation is recaptured at up to 25%, and gains may owe capital-gains tax (a 1031 exchange can defer both). Figures are a year-1 estimate at your 24.0% rate — not tax advice; consult a CPA.
Schools (NCES district)
- District
- New Hartford Central School District
- NCES district ID
- 3620370
- Math proficiency
- 65% ▼ -7.00%
- Reading proficiency
- 76% ▲ 5.00%
- Median HH income
- $67,028
- Composite
- 61.37/100
- National rank
- #769
- State rank
- #128 of 590 in NY
Livability — Washington Mills
- Score
- 60/100
- State rank
- #952
- US rank
- #18623
Category grades
Schools grade is shown separately in the Schools card above.
Census & demographics
- Census place
- Washington Mills, NY
- County
- Oneida County · 89,710 people
- Metro
- Utica-Rome, NY
- Population (ZIP)
- 16,742
- Household income
- $95,261
- Rent vs Own
- Severe rent burden
- 395.0
Population outlook (Oneida County) Hauer SSP2
- Today (2025)
- 225,223 people
- By 2030
- 220,384 · -2.1%
- By 2040
- 209,071 · -7.2%
- By 2050
- 197,920 · -12.1%
- By 2075
- 175,541 · -22.1%
- By 2100
- 148,491 · -34.1%
Race, ethnicity, and origin ACS 2023
- Neighborhood character
- Predominantly White (88%)
- Race & ethnicity
- White 88% Asian 4% Hispanic / Latino 3% Two or more races 3%
- Common ancestry
- Romanian 8% Lithuanian 4% Subsaharan African 3%
- Foreign-born
- 11% · Vietnam, China, Canada
- Languages at home
- 86% English-only · Other Indo-European 4% Other Asian/Pacific 3% Russian/Polish/Slavic 2%
Political lean MEDSL · Oneida
- 2024 margin
- Strong R (+21.3) · D 39.4% · R 60.6%
- 2008→2024 swing
- -15.2pp toward R · 2008: -6.1pp · 2024: -21.3pp
- All cycles
- 2024: R+21.3 2020: R+15.5 2016: R+21.1 2012: R+5.3 2008: R+6.1
Not yet ingested
- Civics
- —
Market trends
- HPI YoY
- ▼ -210.17%
- Current HPI
- 295.4235
- Rent YoY
- —
- Metro
- Utica-Rome, NY
- State GDP YoY
- ▲ 2.60%
- F500 in state
- 92
Industry mix (Fortune 500 HQ in NY)
| Industry | F500 HQs | Revenue |
|---|---|---|
| Financial Services | 10 | $950B |
|
||
| Consumer Goods | 9 | $162B |
|
||
| Insurance | 4 | $225B |
|
||
| Telecommunications | 2 | $144B |
|
||
| Pharmaceuticals | 2 | $112B |
|
||
| Media / Entertainment | 2 | $69B |
|
||
Price history
+122.2% since first listed7 events — show timeline
- 2026-05-14 Listing Removed — CNYIS
- 2026-05-14 Listed $220,000 CNYIS
- 2016-04-14 Sold (Public Records) $92,000 Public Records
- 2016-04-12 Listed $99,000 CNYIS
- 2016-04-12 Sold (MLS) $92,000 CNYIS
- 2016-04-11 Sold (MLS) $92,000 CNYIS
- 2015-11-30 Listed $99,000 CNYIS
Property tax history
+7.2%/yrLatest (2025): $3,010 · -8.7% YoY. Source: county tax records.
Cash-flow waterfall
monthlySold comps — $/sqft
last 12 mo · ≤1 miLoading sold comps…