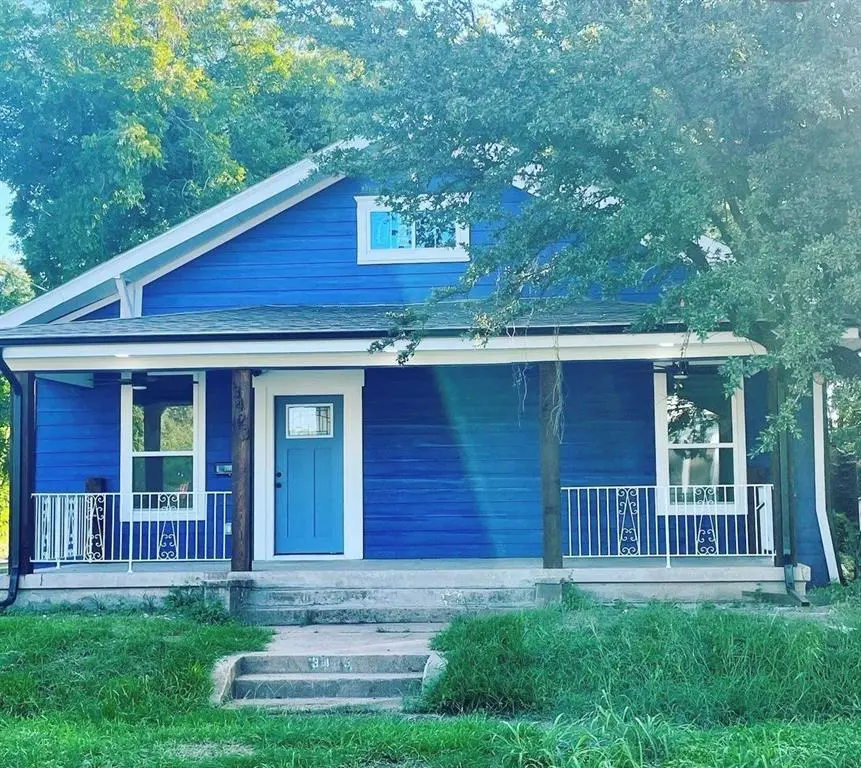
3423 S Harwood St · Dallas, TX
Flood risk 6/10 · Moderate
- FEMA flood zone
- X (unshaded)
- Chance of flooding over 30 yrs
- 0.94%
- Est. flood insurance / yr
- $507 – $1,088
Fire risk 1/10 · Minimal
- Est. fire insurance / yr
- $1,222 – $2,270
Heat risk 7/10 · Major
- Hot days now (above 109°F)
- 7 days/yr
- Hot days in 30 yrs
- 24 days/yr
Wind risk 6/10 · Moderate
- Chance of severe wind over 30 yrs
- 27.0%
Air-quality risk 3/10 · Minor
- Unhealthy air days now
- 2 days/yr
- Unhealthy air days in 30 yrs
- 3 days/yr
Risk factors via First Street. Map © Google.
Why this score? — see what drove the B- grade
The composite is a weighted blend of 9 inputs, each scored 0–100. Each bar is that input's sub-score; the figure is the points it added to the 100-point composite (weight × sub-score).
- Cash flow +20.6/30.0
- ARV discount +15.0/15.0
- DSCR +6.6/10.0
- 1% rule +5.4/10.0
- Appreciation +5.4/10.0
- Rent growth +4.3/5.0
- Livability +4.0/5.0
- Schools +2.8/10.0
- Condition / age +2.5/5.0
$245,000
🖨 Deal sheet 📄 Offer letter ✓ Due diligence
Listing remarks MLS
This spacious newly remodeled with a roof replaced in 2023, plumbing, electrical, redone from the ground up. The home features an open floor plan with 4-bedrooms, 2-full baths, beautiful laminate floors throughout the entire home with NO CARPET. An updated kitchen with plenty of cabinet space, bay windows, dish washer and a high grade flat range stove. Both bathrooms are spacious, both containing double sinks. The 4 bedrooms provide natural light and privacy. Full washer and dryer connections and a cozy backyard and a big covered porch to top it all off. The home is very spacious and priced well for its size. In walking distance to the local school, just minutes away from downtown Dallas.
Key facts
- Double sinks
- Open floor plan
- Big covered porch
Tags
Neighborhood map
What this means for you Summary
Snapshot
- This is a 3-bed/2.0-bath single-family listed at $245k.
Deal economics
- At list price, monthly cash flow is $329 ($4k/yr) — positive.
- The deal already cash-flows at list — no discount required.
- Meets the 1% rule at list price ($3k rent vs $245k).
- Recommended offer: $230k (6.0% below list) — sets the bar for market timing.
- Cap rate 7.9% vs local median 2.3% in Dallas — top-decile yield for the area; either an underpriced asset or a hidden risk that comps aren't pricing in. Stress-test before assuming the spread holds.
Location & tenants
- Location reads 81/100 on livability (#24 in TX, #1,380 nationally) — a professional / high-income tenant draw. Strengths: amenities A+, commute A+, housing A+; Watch: schools C-, crime F.
- Dallas ISD (urban): math 31% / reading 36% proficiency, ranked #559 of 826 in TX (top 68%) — families likely to look elsewhere, expect single-tenant / working-renter base with shorter leases; 83% free/reduced lunch — lower-income household profile, screen leases tightly.
- Market conditions: Rents rising fast (+7.2%/yr); 248 active listings in the ZIP; 40 comparable units currently listed for rent nearby; rentals at typical pace (median 24d on market — plan ~3-4 weeks tenant-placement turnaround); 40% of comp listings sitting > 30 days — soft ceiling on asking rent; 12,577 units permitted in Dallas County in 2024 (6,829 in 5+ unit buildings).
- At $2,551/mo this rent would consume 67% of the median local household income ($46k/yr) (locally 1464% of renters already pay >50% of income on rent) — very limited rent-growth headroom before tenants either downsize or default.
Forward outlook
- In year one you build about $4k of equity ($2k loan paydown + $2k appreciation (0.8% local appreciation)).
- Dallas County population projected at +35% by 2050 — long-run rental-demand tailwind backs the buy-and-hold thesis.
- At projected returns (0.8% appreciation + 7.2% rent growth), your $69k cash investment doubles in ~6 years — after that, you're playing with house money.
- By year 9, paydown + projected appreciation supports a ~$34k cash-out refi (75% LTV) — recoverable capital for the next deal without selling this one.
Negotiation context
- It's been on market 86 days — a 6% lower offer ($230k) is reasonable based on typical stale-listing flexibility.
- 6 sale attempts since 7y ago; this cycle's ask is 10552% above the opening price — seller raised mid-cycle; expect resistance to lowballs.
Risks & watch-outs
- Watch-outs: built in 1931 — expect roof / HVAC / electrical / plumbing capex.
- Climate carrying-cost: major flood risk; major wind risk, 27% chance of damaging wind over 30y; extreme-heat days projected 7→24/yr by 2055 (HVAC capex compounding) — expect insurance premiums to compound above CPI over the hold.
Questions for the listing agent
- It's been on market 86 days. Have you received any prior offers? Is the seller open to a 6% concession, seller financing, or rate buy-down credit?
- Built in 1931 — when were the roof, HVAC, electrical panel, plumbing, and water heater last replaced?
- Why hasn't it sold? Are there any deal-killer items the seller is aware of (foundation, flood, title, zoning, code violations)?
- Is there a deadline driving the sale (1031 exchange, divorce, estate, relocation)? That informs how much negotiation room exists.
- Crime grade is F in this area — have there been break-ins, vandalism, or insurance claims at this property in the last 3 years? What carrier currently insures it and at what premium?
- What's the average days-on-market for RENTAL listings here right now (not sales)? A rising rental-DOM trend means longer vacancies and softer asking-rent achievability than the comps imply.
- What's the recent tenant-quality profile in this submarket — average credit score on applications, eviction rate, late-payment / NSF rate, and stable-employment percentage? A property-management company in the area should have these aggregated.
- How much new for-sale + rental construction is in the pipeline within 1–3 miles? Heavy new supply typically softens prices + rents 12–24 months out; constrained supply supports both.
Investment metrics
- 1% rule
- 1.04% ✓
- Cap rate
- 7.91%
- Cash-on-cash
- 5.76%
- DSCR
- 1.26
- GRM
- 8.0
CMA / ARV
- ARV (median comp)
- $301,282
- List price
- $245,000
- Delta
- -18.68%
- Verdict
- UNDERPRICED
- Comps
- 20 within 1.0 mi
Show comp detail 12 sales within ~0.75 mi
| Address | Dist | Beds/Ba | Sqft | Sold | Price | $/sf | Match |
|---|---|---|---|---|---|---|---|
| 3604 Wendelkin St | 0.12mi | 4/3.0 (+1) | 2,000 (+3%) | 3mo | $388,500 | $194 | 78 |
| 2508 Park Row Ave | 0.57mi | 3/1.0 | 1,943 (-0%) | 5mo | $210,000 | $108 | 65 |
| 2618 Birmingham Ave | 0.45mi | 3/2.5 | 1,800 (-8%) | 1mo | $314,900 | $175 | 64 |
| 2317 Peabody Ave | 0.31mi | 4/2.5 (+1) | 1,792 (-8%) | 4mo | $314,500 | $176 | 62 |
| 3900 Colonial Ave | 0.43mi | 4/2.0 (+1) | 1,792 (-8%) | 2mo | $126,000 | $70 | 60 |
| 2620 Peabody Ave | 0.50mi | 3/3.5 | 1,850 (-5%) | 3mo | $345,000 | $186 | 60 |
| 3835 Spence St | 0.45mi | 4/3.0 (+1) | 2,064 (+6%) | 2mo | $420,000 | $203 | 59 |
| 2807 Tanner St | 0.59mi | 3/2.0 | 1,782 (-8%) | 1mo | $264,000 | $148 | 58 |
| 2512 Peabody Ave | 0.40mi | 3/3.5 | 1,700 (-13%) | 2mo | $355,000 | $209 | 53 |
| 3312 Latimer St | 0.31mi | 4/3.0 (+1) | 2,200 (+13%) | 6mo | $480,000 | $218 | 50 |
| 2616 Peabody Ave | 0.49mi | 3/3.5 | 1,690 (-13%) | 2mo | $345,000 | $204 | 48 |
| 2417 Felton Ct | 0.70mi | 4/3.5 (+1) | 2,042 (+5%) | 2mo | $377,500 | $185 | 46 |
Match score weights: distance 35% · size 25% · config 20% · recency 20%. Top-matched comps best support the ARV.
Projected returns pro-forma
0.79% appreciation · 7.19% rent growth · sell at horizon
- IRR
- 9.7%
- Equity multiple
- 1.50×
- Total profit
- $34,280
- Equity at exit
- $80,962
- IRR
- 16.4%
- Equity multiple
- 3.19×
- Total profit
- $150,074
- Equity at exit
- $105,551
Cash invested: $68,600 (down + closing). Projections, not guarantees.
Landlord ↔ Tenant lean methodology
- Overall (STATE)
- 87 Strongly Landlord-Friendly
- State Texas
- 87 Strongly Landlord-Friendly · R+5
- County
- — inherits STATE
- City
- — inherits STATE
ZIP-level market 75215
- Home prices YoY
- 0.3%
- Rents YoY
- 7.2%
- Active inventory
- 248
- Price-to-rent
- 8.0×
Monthly cashflow live
- Estimated rent
- $2,551 high interval (Pro) →
- Mortgage (P&I)
- −$1,285
- Tax from tax record
- −$299 /mo · $3,586/yr
- Insurance
- −$102
- HOA
- −$0
- Vacancy / Maint / Mgmt
- −$536
- Net cashflow
- $329
Break-even live
UW: 25.0% down · 7.5% · 30yr · 1.5% tax · 5.0% vac · 8.0% maint · 8.0% mgmt
Financing live
Cash to close
- Down payment
- $61,250
- Closing costs
- $7,350
- Reserves months
- —
- Total cash needed
- —
Loan-product check · same deal, 3 products live
Conventional
25% down · 7.5% · 30yr
- Down + closing
- —
- Monthly P&I
- —
- Monthly cashflow
- —
- DSCR
- —
- Eligible?
- —
Personal DTI + credit; lowest rate.
DSCR
20% down · 8.5% · 30yr
- Down + closing
- —
- Monthly P&I
- —
- Monthly cashflow
- —
- DSCR
- —
- Eligible?
- —
No personal income docs; deal must DSCR.
Hard money
10% down · 12.0% · 12mo
- Down + closing
- —
- Monthly P&I
- —
- Monthly cashflow
- —
- DSCR
- —
- Eligible?
- —
Short-term bridge; refi at stabilization.
Rent comps 40 comps
| Address | Beds | Baths | Sqft | Rent | $/sqft | DOM | Units | Dist |
|---|---|---|---|---|---|---|---|---|
| 3521 S Harwood St Dallas, TX | 3.0 | 2.5 | 1750 | $2,700 | $1.54 | 2d | 1 | 0.05mi |
| 3413 Wendelkin St Dallas, TX | 3.0 | 2.5 | 1724 | $2,650 | $1.54 | 1d | 1 | 0.09mi |
| 3502 Edgewood St Dallas, TX | 4.0 | 2.0 | 1866 | $2,523 | $1.35 | 1d | 1 | 0.16mi |
| 2507 Birmingham Ave Dallas, TX | 3.0 | 2.5 | 1516 | $2,500 | $1.65 | 24d | 1 | 0.32mi |
| 3609 Cleveland St Dallas, TX | 4.0 | 2.5 | 1500 | $2,700 | $1.80 | 7d | 1 | 0.38mi |
| 4024 Colonial Ave Dallas, TX | 4.0 | 2.0 | 1560 | $2,400 | $1.54 | 24d | 1 | 0.51mi |
| 2847 Metropolitan Ave Dallas, TX | 3.0 | 1.0 | 1344 | $2,050 | $1.53 | 21d | 1 | 0.68mi |
| 2312 Stoneman St Dallas, TX | 4.0 | 3.0 | 2106 | $3,100 | $1.47 | 4d | 1 | 0.74mi |
| 2618 Carpenter Ave Dallas, TX | 4.0 | 3.0 | 2050 | $3,200 | $1.56 | 43d | 1 | 0.83mi |
| 1713 Herald St Dallas, TX | 3.0 | 2.5 | 2142 | $2,300 | $1.07 | 7d | 1 | 0.96mi |
| 1711 Herald St Dallas, TX | 3.0 | 2.5 | 2140 | $2,350 | $1.10 | 43d | 1 | 0.96mi |
| 3915 Coolidge St Dallas, TX | 4.0 | 2.0 | 1416 | $2,100 | $1.48 | 43d | 1 | 1.02mi |
| 3308 Birmingham Ave Unit 11 Dallas, TX | 2.0 | 2.5 | 1505 | $2,375 | $1.58 | 43d | 1 | 1.05mi |
| 3308 Birmingham Ave Unit 03 Dallas, TX | 2.0 | 2.5 | 1451 | $2,275 | $1.57 | 43d | 1 | 1.05mi |
| 3308 Birmingham Ave Unit 1 Dallas, TX | 2.0 | 2.5 | 1451 | $2,275 | $1.57 | 24d | 1 | 1.05mi |
| 3308 Birmingham Ave Unit 6 Dallas, TX | 2.0 | 2.5 | 1341 | $2,175 | $1.62 | 16d | 1 | 1.05mi |
| 3308 Birmingham Ave Unit 7 Dallas, TX | 2.0 | 2.5 | 1287 | $2,125 | $1.65 | 14d | 1 | 1.05mi |
| 2406 Merlin St Dallas, TX | 3.0 | 2.5 | 2004 | $2,500 | $1.25 | 7d | 1 | 1.08mi |
| 1512 Seegar St Unit 1508 Dallas, TX | 3.0 | 3.5 | 2003 | $3,250 | $1.62 | 43d | 1 | 1.09mi |
| 1508 Seegar St Dallas, TX | 3.0 | 3.5 | 1966 | $3,124 | $1.59 | 14d | 9 | 1.09mi |
| 1100 Corinth St Dallas, TX | 2.0–3.0 | 2.5–3.5 | 1572 | $3,595 | $2.29 | 43d | 10 | 1.10mi |
| 1900 S Ervay St Dallas, TX | 2.0 | 3.0 | 1302 | $3,700 | $2.84 | 43d | 1 | 1.11mi |
| 2408 Meyers St Unit 204 Dallas, TX | 2.0 | 1.0 | 2375 | $770 | $0.32 | 2d | 1 | 1.15mi |
| 3331 Spring Ave Dallas, TX | 3.0 | 2.0 | 1652 | $2,200 | $1.33 | 7d | 1 | 1.17mi |
| 3331 Spring Ave Dallas, TX | 3.0 | 2.0 | 1652 | $2,200 | $1.33 | 24d | 1 | 1.17mi |
| 1874 Beaumont St Dallas, TX | 4.0 | 5.0 | 2578 | $4,900 | $1.90 | 43d | 1 | 1.18mi |
| 1805 Browder St #103 Dallas, TX | 3.0 | 3.5 | 2358 | $8,000 | $3.39 | 43d | 1 | 1.19mi |
| 1805 Browder St Unit 1019612P Dallas, TX | 3.0 | 3.5 | 2357 | $6,830 | $2.90 | 6d | 1 | 1.19mi |
| 3230 Elihu St #5 Dallas, TX | 2.0 | 3.5 | 1400 | $2,700 | $1.93 | 43d | 1 | 1.22mi |
| 3230 Elihu St #2 Dallas, TX | 2.0 | 3.5 | 1400 | $2,300 | $1.64 | 43d | 1 | 1.22mi |
| 5000 Linder Ave Dallas, TX | 3.0 | 2.0 | 1327 | $1,950 | $1.47 | 43d | 1 | 1.25mi |
| 4503 Bradshaw St Dallas, TX | 4.0 | 2.0 | 1263 | $1,600 | $1.27 | 7d | 1 | 1.26mi |
| 3523 Herrling St Dallas, TX | 3.0 | 2.0 | 1525 | $1,800 | $1.18 | 16d | 1 | 1.26mi |
| 2246 Hooper St Dallas, TX | 3.0 | 3.0 | 1870 | $2,400 | $1.28 | 43d | 1 | 1.28mi |
| 2207 Anderson St Dallas, TX | 3.0 | 2.5 | 1419 | $2,300 | $1.62 | 7d | 1 | 1.32mi |
| 2714 Hector St Dallas, TX | 3.0 | 2.0 | 1233 | $2,100 | $1.70 | 24d | 1 | 1.36mi |
| 1245 Gano St #602 Dallas, TX | 2.0 | 2.5 | 2465 | $2,800 | $1.14 | 21d | 1 | 1.39mi |
| 2840 Oakdale St Dallas, TX | 3.0 | 2.0 | 1379 | $1,900 | $1.38 | 43d | 1 | 1.39mi |
| 2521 Bethurum Ave Dallas, TX | 3.0 | 2.5 | 1600 | $2,300 | $1.44 | 43d | 1 | 1.40mi |
| 1552 Cosette Dr Dallas, TX | 2.0 | 2.5 | 2344 | $3,355 | $1.43 | 16d | 1 | 1.41mi |
Listing history 29 events
-
2026-06-18days on market $245,000 Active 86 DOM
-
2026-06-18price $245,000 Active 85 DOM
-
2026-06-17days on market $255,000 Active 85 DOM
-
2026-06-16days on market $255,000 Active 84 DOM
-
2026-06-15days on market $255,000 Active 83 DOM
-
2026-06-13days on market $255,000 Active 81 DOM
-
2026-06-09days on market $255,000 Active 77 DOM
-
2026-06-08days on market $255,000 Active 76 DOM
-
2026-06-07days on market $255,000 Active 75 DOM
-
2026-06-04days on market $255,000 Active 72 DOM
-
2026-06-03days on market $255,000 Active 71 DOM
-
2026-06-02days on market $255,000 Active 70 DOM
-
2026-06-01days on market $255,000 Active 69 DOM
-
2026-05-31days on market $255,000 Active 68 DOM
-
2026-04-21price $255,000 704-char remark
Show marketing remark (704 chars)
This spacious newly remodeled with a roof replaced in 2023, plumbing, electrical, redone from the ground up. The home features an open floor plan with 4-bedrooms, 2-full baths, beautiful laminate floors throughout the entire home with NO CARPET. An updated kitchen with plenty of cabinet space, bay windows, dish washer and a high grade flat range stove. Both bathrooms are spacious, both containing double sinks. The 4 bedrooms provide natural light and privacy. Full washer and dryer connections and a cozy backyard and a big covered porch to top it all off. The home is very spacious and priced well for its size. In walking distance to the local school, just minutes away from downtown Dallas.
-
2026-03-25$2,300
-
2026-03-24$269,000 Active 704-char remark
Show marketing remark (704 chars)
This spacious newly remodeled with a roof replaced in 2023, plumbing, electrical, redone from the ground up. The home features an open floor plan with 4-bedrooms, 2-full baths, beautiful laminate floors throughout the entire home with NO CARPET. An updated kitchen with plenty of cabinet space, bay windows, dish washer and a high grade flat range stove. Both bathrooms are spacious, both containing double sinks. The 4 bedrooms provide natural light and privacy. Full washer and dryer connections and a cozy backyard and a big covered porch to top it all off. The home is very spacious and priced well for its size. In walking distance to the local school, just minutes away from downtown Dallas.
-
2024-03-13historical $2,400
-
2024-02-13$2,400
-
2024-01-09historical $2,300
-
2023-11-01$2,300
-
2019-06-03status Pending
-
2019-05-08historical Active Option Contract
-
2019-05-08historical
-
2019-04-25status Active
-
2019-03-21status Pending
-
2019-03-18historical Active Option Contract
-
2019-03-11$90,000 Active
-
2005-03-18soldstatus
ⓘ Source: listings_history table (triggers on properties + properties_extension) + one-shot
backfill from property_details.listing_events for pre-trigger history.
Tax reassessment forecast TX · Resets to sale price
- Current annual tax
- $3,586 · $299/mo
- Projected year-2 tax
- $4,484 · $374/mo
- Expected delta
- +$898/yr (+$75/mo · 25.0%)
ⓘ Screening estimate from a state-policy table — verify with the county assessor before closing.
Climate risk First Street
- Flood 6/10 Major FEMA zone X (unshaded) · 94% chance over 30 yrs
- Wildfire 1/10 Low
- Heat 7/10 Severe 7 d/yr ≥109°F today · 24 d/yr by 30 yrs out
- Wind 6/10 Major 27% chance of damaging wind over 30 yrs
- Air quality 3/10 Moderate 2 unhealthy d/yr today · 3 by 30 yrs out
Nearby sold comps map
Loading sold comps map…
Walkable amenities ~0.75 mi
Loading nearby amenities…
Taxation est. · year 1
- Rental income
- $30,608
- − Mortgage interest
- −$13,724
- − Property taxes
- −$3,586
- − Insurance
- −$1,225
- − Repairs & maintenance
- −$2,449
- − Management
- −$2,449
- − Depreciation
- −$7,127
- Taxable income
- $49
- Est. tax owed @ 24.0%
- −$12
- After-tax cash flow
- $3,940/yr
For passive investors: Depreciation is non-cash, so a rental often shows a tax loss while cash-flowing — sheltering income. Rental losses are passive: they offset passive income freely, and up to $25,000/yr can offset ordinary (W-2) income if you actively participate and your MAGI is under $100k (phasing out to $0 by $150k); unused losses carry forward. On sale, claimed depreciation is recaptured at up to 25%, and gains may owe capital-gains tax (a 1031 exchange can defer both). Figures are a year-1 estimate at your 24.0% rate — not tax advice; consult a CPA.
Schools (NCES district)
- District
- Dallas ISD
- NCES district ID
- 4816230
- Math proficiency
- 31% ▼ -16.00%
- Reading proficiency
- 36% ▼ -4.00%
- Median HH income
- $42,881
- Composite
- 28.41/100
- National rank
- #6763
- State rank
- #559 of 826 in TX
Livability — Dallas
- Score
- 81/100
- State rank
- #24
- US rank
- #1380
Category grades
Schools grade is shown separately in the Schools card above.
Census & demographics
- Census place
- Dallas, TX
- County
- Dallas County · 2,612,404 people
- City population
- 1,168,437
- Metro
- Dallas-Fort Worth-Arlington, TX
- Population (ZIP)
- 18,895
- Household income
- $45,557
- Rent vs Own
- Severe rent burden
- 1464.0
Population outlook (Dallas County) Hauer SSP2
- Today (2025)
- 2,979,839 people
- By 2030
- 3,191,823 · +7.1%
- By 2040
- 3,619,611 · +21.5%
- By 2050
- 4,026,915 · +35.1%
- By 2075
- 4,957,073 · +66.4%
- By 2100
- 5,508,725 · +84.9%
Race, ethnicity, and origin ACS 2023
- Neighborhood character
- Diverse neighborhood (Simpson 0.58)
- Race & ethnicity
- Black 59% Hispanic / Latino 25% White 11% Two or more races 10%
- Hispanic origin (detail)
- Mexican 21%
- Common ancestry
- Italian 1% Hispanic 1%
- Foreign-born
- 16% · Canada
- Languages at home
- 74% English-only · Spanish 26%
Political lean MEDSL · Dallas
- 2024 margin
- Strong D (+22.2) · D 60.2% · R 38.0% · Other 1.8%
- 2008→2024 swing
- +6.9pp toward D · 2008: 15.3pp · 2024: 22.2pp
- All cycles
- 2024: D+22.2 2020: D+31.6 2016: D+26.2 2012: D+15.4 2008: D+15.3
Not yet ingested
- Civics
- —
Market trends
- HPI YoY
- ▲ 0.79%
- Current HPI
- 224.2955
- Rent YoY
- ▲ 7.19%
- Metro
- Dallas-Fort Worth-Arlington, TX
- State GDP YoY
- ▲ 3.95%
- F500 in state
- 110
Industry mix (Fortune 500 HQ in TX)
| Industry | F500 HQs | Revenue |
|---|---|---|
| Energy | 16 | $1,198B |
|
||
| Technology | 5 | $198B |
|
||
| Engineering / Construction | 4 | $72B |
|
||
| Energy Services | 3 | $60B |
|
||
| Utilities | 3 | $41B |
|
||
| Healthcare | 2 | $330B |
|
||
Price history
+183.3% since first listed15 events — show timeline
- 2026-04-21 Price Changed $255,000 NTREIS
- 2026-03-25 Listed for Rent $2,300 NTREIS
- 2026-03-24 Listed $269,000 NTREIS
- 2024-03-13 Rental Removed $2,400 NTREIS
- 2024-02-13 Listed for Rent $2,400 NTREIS
- 2024-01-09 Rental Removed $2,300 NTREIS
- 2023-11-01 Listed for Rent $2,300 NTREIS
- 2019-06-03 Pending — NTREIS
- 2019-05-08 Contingent — NTREIS
- 2019-05-08 Listing Removed — NTREIS
- 2019-04-25 Relisted — NTREIS
- 2019-03-21 Pending — NTREIS
- 2019-03-18 Contingent — NTREIS
- 2019-03-11 Listed $90,000 NTREIS
- 2005-03-18 Sold (Public Records) — Public Records
Property tax history
+12.2%/yrLatest (2025): $3,586 · +9.3% YoY. Source: county tax records.
Cash-flow waterfall
monthlySold comps — $/sqft
last 12 mo · ≤1 miLoading sold comps…