 Triplex
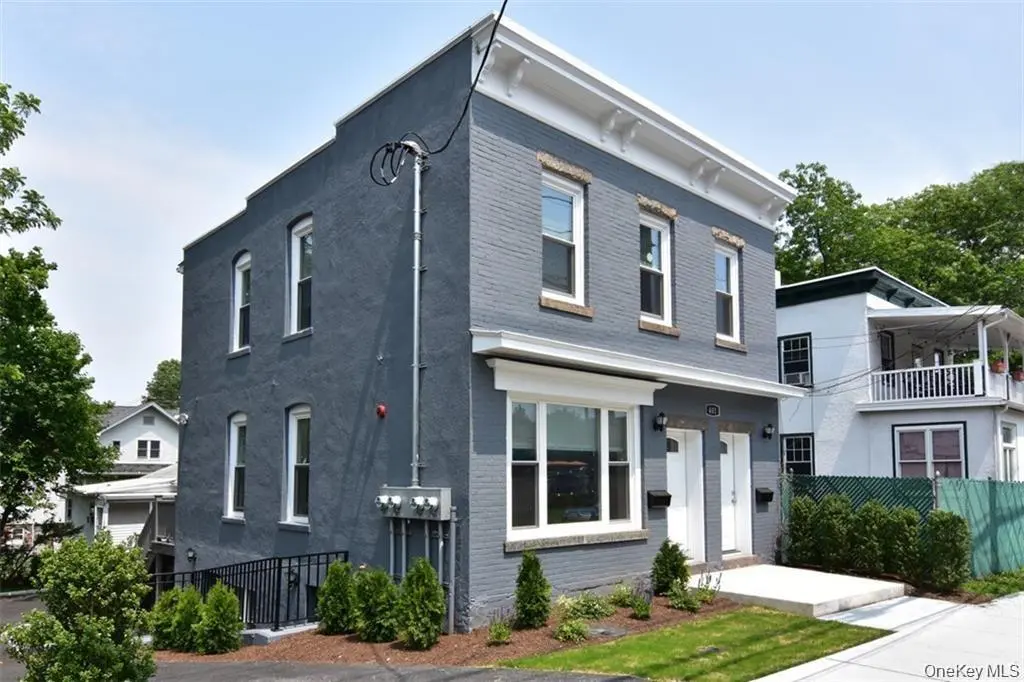
401 Ashford Ave · Dobbs Ferry, NY
Flood risk 9/10 · Severe
- FEMA flood zone
- X (unshaded)
- Chance of flooding over 30 yrs
- 0.99%
- Est. flood insurance / yr
- $473 – $860
Fire risk 3/10 · Minor
- Est. fire insurance / yr
- $691 – $1,283
Heat risk 6/10 · Moderate
- Hot days now (above 99°F)
- 7 days/yr
- Hot days in 30 yrs
- 15 days/yr
Wind risk 6/10 · Moderate
- Chance of severe wind over 30 yrs
- 27.0%
Air-quality risk 4/10 · Minor
- Unhealthy air days now
- 4 days/yr
- Unhealthy air days in 30 yrs
- 6 days/yr
Risk factors via First Street. Map © Google.
Why this score? — see what drove the C+ grade
The composite is a weighted blend of 9 inputs, each scored 0–100. Each bar is that input's sub-score; the figure is the points it added to the 100-point composite (weight × sub-score).
- Cash flow +23.0/30.0
- ARV discount +7.5/15.0
- Schools +7.5/10.0
- DSCR +7.4/10.0
- 1% rule +6.7/10.0
- Livability +3.7/5.0
- Rent growth +3.4/5.0
- Condition / age +2.5/5.0
- Appreciation +0.0/10.0
$985,000
🖨 Deal sheet (PDF) 📄 Offer letter ✓ Due diligence
Multi-family units
County records classify this as Multi-Family (2-4 Unit). Listing-text estimate: 3 units. confirmed
Listing remarks MLS
Phenomenal potential to own a house/building in Dobbs Ferry's downtown transition zone/area! Close to bus, parkways and shops, there are many possibilities of how to use this building! Most recently used as a two family house, there is a one bedroom apartment on the first floor and two bedroom apartment on the second floor. Full basement is walkout. There is a driveway to the back yard, which is large enough for a few cars. This zoning allows commercial on first floor w/residential above or just residential (see agents notes or zoning code). While it is being sold as is, the potential is endless. Additional Information: HeatingFuel:Oil Above Ground,
Key facts
- Beautiful kitchen
- Gut-renovated
- 4,792 sq ft lot
Tags
Property features AI
Exterior
- Parking: Driveway parking; Total of 3 parking spaces
- Utilities: Public sewer; Electricity connected; Sewer connected
- Home design: Triplex; Updated/remodeled
- Construction: Stucco construction
- Exterior features: Stucco exterior; Not waterfront; No additional parcels
Interior
- Kitchen: Breakfast bar; Kitchen island; Quartz/Quartzite and stone counters; Open kitchen
- Bedrooms: One 1-bedroom unit; Two 2-bedroom units
- Bathrooms: Three full bathrooms
- Heating & cooling: Electric heating; Ductless cooling
- Interior features: Breakfast bar; Kitchen island; Open kitchen; Quartz/Quartzite counters; Stone counters; Partial basement
- Laundry & utility: In-unit laundry
Neighborhood map
What this means for you Summary
Snapshot
- This is a 3 × 3-bed/1.5-bath units multifamily listed at $985k.
Deal economics
- At list price, monthly cash flow is $2k ($20k/yr) — positive. Per door: $563/mo.
- The deal already cash-flows at list — no discount required.
- Meets the 1% rule at list price ($12k rent vs $985k).
- Cap rate 8.4% vs local median 2.3% in Dobbs Ferry — top-decile yield for the area; either an underpriced asset or a hidden risk that comps aren't pricing in. Stress-test before assuming the spread holds.
Location & tenants
- Location reads 73/100 on livability (#329 in NY) — a middle-class / working-renter tenant base. Strengths: crime A+, employment A+, housing A; Watch: amenities F, commute F, cost of living F.
- Ardsley Union Free School District (suburban): math 76% / reading 81% proficiency, ranked #32 of 590 in NY (top 5%) — strong family-tenant draw, lease renewals of 3-5y typical; only 4% free/reduced lunch — higher-income household profile.
- Zoned schools: Concord Road Elementary School (math 64% / reading 83%, grade A, #371 of 2,108 statewide, top 18%, 830 students, 0% FRL); Ardsley Middle School (math 76% / reading 80%, grade A+, #37 of 729 statewide, top 5%, 754 students, 0% FRL); Ardsley High School (math 98% / reading 87%, grade A+, #158 of 1,100 statewide, top 15%, 716 students, 0% FRL) — zoned schools at 0% FRL track the district average.
- Market conditions: Rents rising (+3.8%/yr); 64 active listings in the ZIP; high-income renter base; 954 units permitted in Westchester County in 2024 (649 in 5+ unit buildings).
- At $11,506/mo this rent would consume 83% of the median local household income ($165k/yr) (locally 393% of renters already pay >50% of income on rent) — very limited rent-growth headroom before tenants either downsize or default.
Forward outlook
- Local home prices are declining (-3.0%/yr); year-one equity from $7k of loan paydown is wiped out by about $30k of value loss. Plan a longer hold.
- Westchester County population projected at +10% by 2050 — modest demand growth; plan on rents tracking national, not racing it.
Negotiation context
- Only 13 days on market — expect competitive offers; lowballing is unlikely to land.
- 2 sale attempts since 9y ago with the ask held roughly flat each time — persistent listings suggest the price (not the market) is what's stuck; bring a comps-based counter.
- Current owner paid $427k; list at $985k implies a 131% gain — meaningful room to come down on a strong offer.
Risks & watch-outs
- Watch-outs: flood insurance adds $56/mo; built in 1820 — expect roof / HVAC / electrical / plumbing capex.
- Climate carrying-cost: severe flood risk; major wind risk, 27% chance of damaging wind over 30y; extreme-heat days projected 7→15/yr by 2055 (HVAC capex compounding) — expect insurance premiums to compound above CPI over the hold.
Questions for the listing agent
- Can we see the unit-by-unit rent roll, current vacancy, and any below-market leases? What's the average tenancy length?
- What capital expenditures (roof, boiler, parking lot, exteriors) have been made in the last 5 years, and what's planned in the next 2?
- Built in 1820 — when were the roof, HVAC, electrical panel, plumbing, and water heater last replaced?
- What's the actual annual flood-insurance premium (NFIP or private), and is the property in a SFHA with mandatory coverage?
- Is there a deadline driving the sale (1031 exchange, divorce, estate, relocation)? That informs how much negotiation room exists.
- Schools are A-rated — typically a magnet for longer-tenancy family renters. What's the average tenant stay here, and is there a school-zone premium baked into asking?
- What's the average days-on-market for RENTAL listings here right now (not sales)? A rising rental-DOM trend means longer vacancies and softer asking-rent achievability than the comps imply.
- What's the recent tenant-quality profile in this submarket — average credit score on applications, eviction rate, late-payment / NSF rate, and stable-employment percentage? A property-management company in the area should have these aggregated.
- How much new apartment / multifamily construction is in the pipeline within 1–3 miles? Heavy new supply (>2% of stock underway) typically softens rents 12–24 months out; light construction supports rent growth.
Investment metrics
- 1% rule
- 1.17% ✓
- Cap rate
- 8.42%
- Cash-on-cash
- 7.59%
- DSCR
- 1.34
- GRM
- 7.1
CMA / ARV
No comps found within radius.
Projected returns pro-forma
-3.0% appreciation · 3.79% rent growth · sell at horizon
- IRR
- -4.1%
- Equity multiple
- 0.85×
- Total profit
- $-42,279
- Equity at exit
- $146,867
- IRR
- 6.6%
- Equity multiple
- 1.52×
- Total profit
- $142,330
- Equity at exit
- $85,165
Cash invested: $275,800 (down + closing). Projections, not guarantees.
Landlord ↔ Tenant lean methodology
- Overall (STATE)
- 15 Strongly Tenant-Friendly
- State New York
- 15 Strongly Tenant-Friendly · D+10
- County
- — inherits STATE
- City
- — inherits STATE
ZIP-level market 10522
- Rents YoY
- 3.8%
- Active inventory
- 64
- Price-to-rent
- 21.4×
Monthly cashflow live
- Estimated rent
- $11,506 medium interval (Pro) →
- Mortgage (P&I)
- −$5,165
- Tax from tax record
- −$1,769 /mo · $21,231/yr
- Insurance
- −$410
- Flood insurance flood zone
- −$56 /mo · $666/yr
- HOA
- −$0
- Vacancy / Maint / Mgmt
- −$2,416
- Net cashflow
- $1,689
Break-even live
Sensitivity live
| Price | -10% $2,247 | -5% $1,968 | +0% $1,689 | +5% $1,410 | +10% $1,131 |
|---|---|---|---|---|---|
| Rent | -10% $780 | -5% $1,235 | +0% $1,689 | +5% $2,144 | +10% $2,598 |
| Rate | -1.0pp $2,185 | -0.5pp $1,940 | base $1,689 | +0.5pp $1,434 | +1.0pp $1,174 |
3-unit breakdown (identical units grouped — click to expand)
| Units | Beds | Baths | Est. rent |
|---|---|---|---|
| 3× units | 3 | 1.5 | $11,505 |
| #1 | 3 | 1.5 | $3,835 |
| #2 | 3 | 1.5 | $3,835 |
| #3 | 3 | 1.5 | $3,835 |
| Total (3 units) | $11,506 | ||
UW: 25.0% down · 7.5% · 30yr · 1.5% tax · 5.0% vac · 8.0% maint · 8.0% mgmt
Financing live
Cash to close
- Down payment
- $246,250
- Closing costs
- $29,550
- Reserves months
- —
- Total cash needed
- —
Loan-product check · same deal, 3 products live
Conventional
25% down · 7.5% · 30yr
- Down + closing
- —
- Monthly P&I
- —
- Monthly cashflow
- —
- DSCR
- —
- Eligible?
- —
Personal DTI + credit; lowest rate.
DSCR
20% down · 8.5% · 30yr
- Down + closing
- —
- Monthly P&I
- —
- Monthly cashflow
- —
- DSCR
- —
- Eligible?
- —
No personal income docs; deal must DSCR.
Hard money
10% down · 12.0% · 12mo
- Down + closing
- —
- Monthly P&I
- —
- Monthly cashflow
- —
- DSCR
- —
- Eligible?
- —
Short-term bridge; refi at stabilization.
Listing history 9 events
-
2026-06-21days on market $985,000 Active 13 DOM
-
2026-06-18days on market $985,000 Active 10 DOM
-
2026-06-17days on market $985,000 Active 9 DOM
-
2026-06-16days on market $985,000 Active 8 DOM
-
2026-06-15days on market $985,000 Active 7 DOM
-
2026-06-13days on market $985,000 Active 5 DOM
-
2026-06-13days on market $985,000 Active 4 DOM
-
2026-06-08remarks 699-char remark
-
2026-06-08$985,000 Active 1 DOM
ⓘ Source: listings_history table (triggers on properties + properties_extension) + one-shot
backfill from property_details.listing_events for pre-trigger history.
Tax reassessment forecast NY · Partial reset (capped growth)
- Current annual tax
- $21,231 · $1,769/mo
- Projected year-2 tax
- $21,231 · $1,769/mo
- Expected delta
- $0/yr ($0/mo · 0.0%)
ⓘ Screening estimate from a state-policy table — verify with the county assessor before closing.
Climate risk First Street
- Flood 9/10 Extreme FEMA zone X (unshaded) · 99% chance over 30 yrs
- Wildfire 3/10 Moderate
- Heat 6/10 Major 7 d/yr ≥99°F today · 15 d/yr by 30 yrs out
- Wind 6/10 Major 27% chance of damaging wind over 30 yrs
- Air quality 4/10 Moderate 4 unhealthy d/yr today · 6 by 30 yrs out
Nearby sold comps map
Loading sold comps map…
Walkable amenities ~0.75 mi
Loading nearby amenities…
Taxation est. · year 1
- Rental income
- $138,072
- − Mortgage interest
- −$55,175
- − Property taxes
- −$21,231
- − Insurance
- −$5,592
- − Repairs & maintenance
- −$11,046
- − Management
- −$11,046
- − Depreciation
- −$28,655
- Taxable income
- $5,328
- Est. tax owed @ 24.0%
- −$1,279
- After-tax cash flow
- $18,990/yr
For passive investors: Depreciation is non-cash, so a rental often shows a tax loss while cash-flowing — sheltering income. Rental losses are passive: they offset passive income freely, and up to $25,000/yr can offset ordinary (W-2) income if you actively participate and your MAGI is under $100k (phasing out to $0 by $150k); unused losses carry forward. On sale, claimed depreciation is recaptured at up to 25%, and gains may owe capital-gains tax (a 1031 exchange can defer both). Figures are a year-1 estimate at your 24.0% rate — not tax advice; consult a CPA.
Schools (NCES district)
- District
- Ardsley Union Free School District
- NCES district ID
- 3603180
- Math proficiency
- 76% ▼ -1.00%
- Reading proficiency
- 81% ▲ 5.00%
- Median HH income
- $140,823
- Composite
- 75.09/100
- National rank
- #141
- State rank
- #32 of 590 in NY
Livability — Dobbs Ferry
- Score
- 73/100
- State rank
- #329
- US rank
- #5447
Category grades
Schools grade is shown separately in the Schools card above.
Census & demographics
- Census place
- Dobbs Ferry, NY
- County
- Westchester County · 709,332 people
- City population
- 11,502
- Metro
- New York-Newark-Jersey City, NY-NJ-PA
- Population (ZIP)
- 11,502
- Household income
- $165,417
- Rent vs Own
- Severe rent burden
- 393.0
Population outlook (Westchester County) Hauer SSP2
- Today (2025)
- 1,028,035 people
- By 2030
- 1,051,636 · +2.3%
- By 2040
- 1,098,520 · +6.9%
- By 2050
- 1,136,044 · +10.5%
- By 2075
- 1,196,925 · +16.4%
- By 2100
- 1,175,147 · +14.3%
Race, ethnicity, and origin ACS 2023
- Neighborhood character
- Predominantly White (68%)
- Race & ethnicity
- White 68% Hispanic / Latino 12% Asian 10% Two or more races 8% Black 3%
- Hispanic origin (detail)
- Puerto Rican 4%
- Common ancestry
- Romanian 4% Scotch-Irish 3% Italian 2%
- Foreign-born
- 21% · Canada, China, South Korea
- Languages at home
- 71% English-only · Other Indo-European 9% Spanish 8% Russian/Polish/Slavic 2%
Political lean MEDSL · Westchester
- 2024 margin
- Strong D (+26.3) · D 63.1% · R 36.9%
- 2008→2024 swing
- -1.3pp toward R · 2008: 27.6pp · 2024: 26.3pp
- All cycles
- 2024: D+26.3 2020: D+36.3 2016: D+32.8 2012: D+22.2 2008: D+27.6
Not yet ingested
- Civics
- —
Market trends
- HPI YoY
- ▼ -490.13%
- Current HPI
- 286.6096
- Rent YoY
- ▲ 3.79%
- Metro
- New York-Newark-Jersey City, NY-NJ-PA
- State GDP YoY
- ▲ 2.60%
- F500 in state
- 92
Industry mix (Fortune 500 HQ in NY)
| Industry | F500 HQs | Revenue |
|---|---|---|
| Financial Services | 10 | $950B |
|
||
| Consumer Goods | 9 | $162B |
|
||
| Insurance | 4 | $225B |
|
||
| Telecommunications | 2 | $144B |
|
||
| Pharmaceuticals | 2 | $112B |
|
||
| Media / Entertainment | 2 | $69B |
|
||
Price history
+1541.7% since first listed7 events — show timeline
- 2026-06-05 Listed $985,000 OneKey® MLS as Distributed by MLS Grid
- 2017-12-01 Sold (Public Records) $427,000 Public Records
- 2017-11-28 Sold (MLS) $427,000 OneKey® MLS as Distributed by MLS Grid
- 2017-10-03 Contingent — OneKey® MLS as Distributed by MLS Grid
- 2017-09-06 Price Changed $469,000 OneKey® MLS as Distributed by MLS Grid
- 2017-07-20 Listed $519,000 OneKey® MLS as Distributed by MLS Grid
- 1996-07-09 Sold (Public Records) $60,000 Public Records
Property tax history
+8.9%/yrLatest (2025): $21,231 · +7.5% YoY. Source: county tax records.
Cash-flow waterfall
monthlySold comps — $/sqft
last 12 mo · ≤1 miLoading sold comps…